
Key Insights
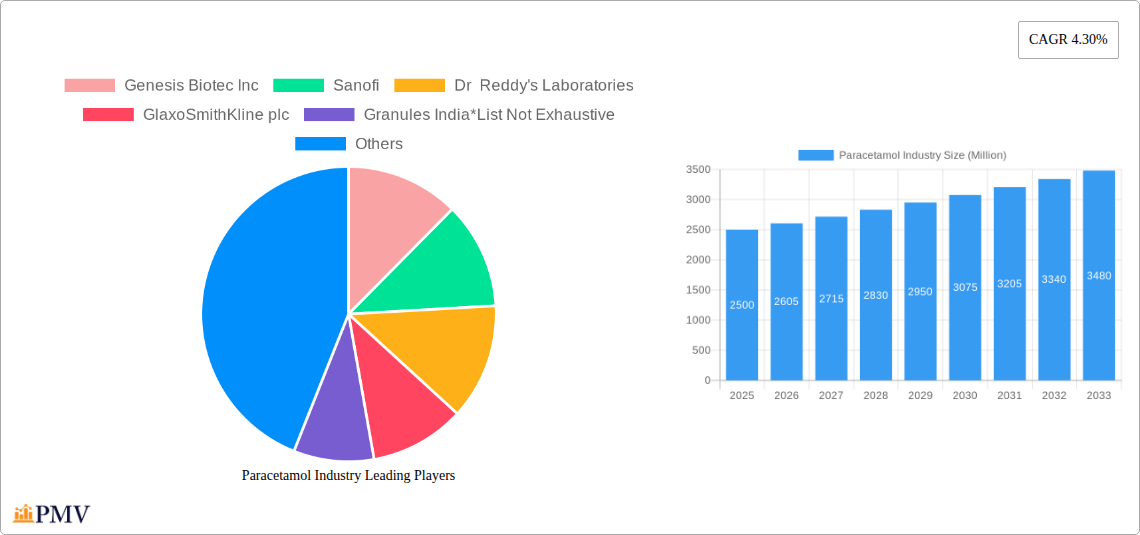
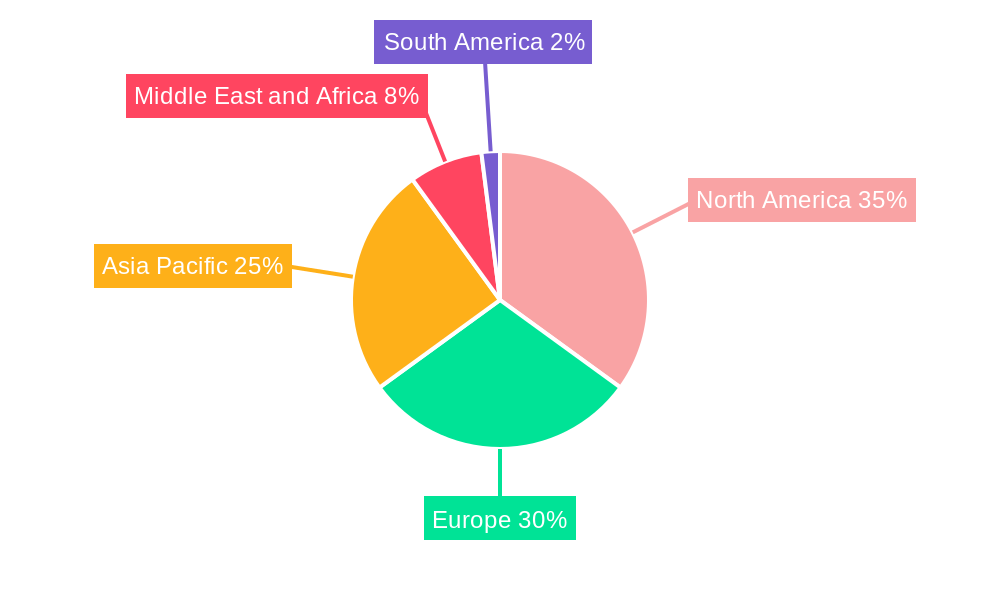
The global paracetamol market, valued at approximately $XX million in 2025, is projected to experience robust growth, driven by a compound annual growth rate (CAGR) of 4.30% from 2025 to 2033. This expansion is fueled by several key factors. The increasing prevalence of common ailments like headaches, fever, and cold & cough, particularly in developing economies, significantly boosts demand for readily available and affordable paracetamol formulations. Furthermore, the rising geriatric population, more susceptible to these conditions, contributes to market growth. The market is segmented by dosage form (tablets, capsules, others) and application (headache & fever, cold & cough, muscle cramps, others), with tablets currently dominating due to their ease of administration and cost-effectiveness. The presence of established pharmaceutical giants like Sanofi, GlaxoSmithKline, and Dr. Reddy's Laboratories, alongside numerous smaller players, ensures a competitive landscape fostering innovation and accessibility. However, regulatory hurdles in certain regions and the emergence of generic competition pose challenges to market expansion. Geographic distribution reveals strong performance in North America and Europe, while Asia-Pacific is poised for significant future growth due to its large and growing population.
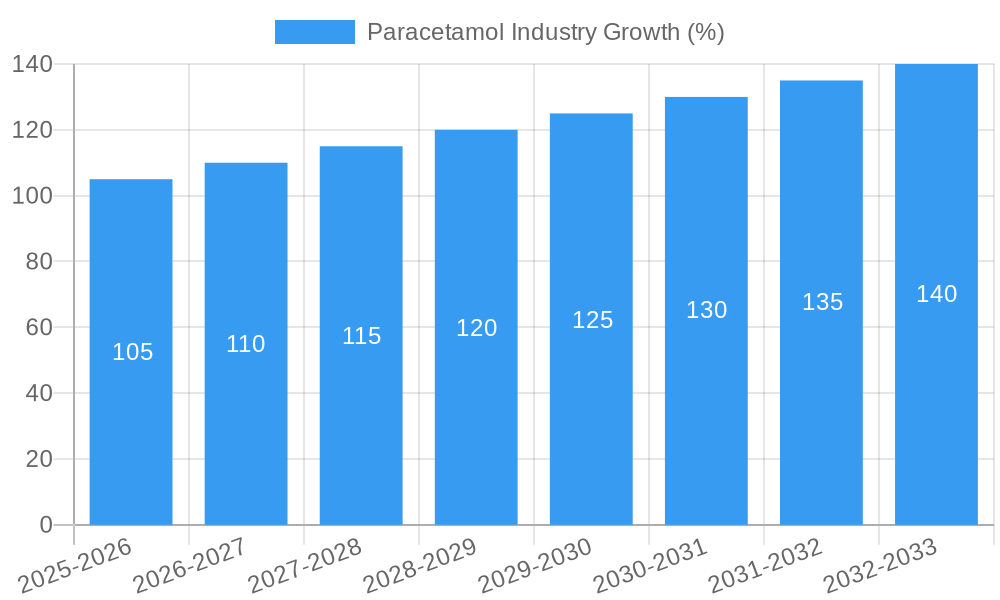
The forecast period (2025-2033) anticipates continued market growth, albeit at a potentially moderated pace compared to the historical period (2019-2024). This moderation could be attributed to increased market saturation in developed regions and the potential for price competition among generic manufacturers. Nevertheless, the market’s inherent resilience, bolstered by the consistent demand for paracetamol as a first-line treatment for common ailments, suggests a sustained growth trajectory throughout the forecast period. Innovation in dosage forms, such as extended-release formulations, and the exploration of new therapeutic applications might offer additional opportunities for market expansion. Further research focusing on the efficacy and safety of paracetamol, particularly in specific patient populations, will be crucial in maintaining public trust and sustaining the market's long-term growth.
Paracetamol Industry Market Report: 2019-2033
This comprehensive report provides a detailed analysis of the global Paracetamol industry, covering market dynamics, competitive landscape, and future growth prospects. The study period spans 2019-2033, with 2025 serving as the base and estimated year. The forecast period is 2025-2033, and the historical period is 2019-2024. This report is an indispensable resource for industry stakeholders, investors, and researchers seeking actionable insights into this vital pharmaceutical sector. The report projects a market value of xx Million by 2033.
Paracetamol Industry Market Structure & Competitive Dynamics
The global paracetamol market exhibits a moderately concentrated structure, with several large multinational pharmaceutical companies and a significant number of smaller regional players. Market share is influenced by factors including brand recognition, production capacity, pricing strategies, and regulatory approvals. Key players such as Sanofi, GlaxoSmithKline plc, and Dr Reddy's Laboratories hold substantial market share. However, the presence of numerous generic manufacturers fosters competition and influences pricing dynamics. The industry's innovation ecosystem is driven by ongoing efforts to enhance formulation, improve bioavailability, and develop novel drug delivery systems.
Regulatory frameworks governing paracetamol production and distribution vary across geographies, impacting market access and pricing. Substitutes for paracetamol, such as ibuprofen and naproxen, exist but paracetamol maintains its dominance due to its perceived safety profile and efficacy for mild to moderate pain relief. End-user trends reflect a growing preference for convenient dosage forms like tablets and capsules. Mergers and acquisitions (M&A) activity within the paracetamol industry has been moderate in recent years, with deal values ranging from xx Million to xx Million. Key M&A activities include [Insert specific examples of M&A activity with values if available, otherwise state "Specific details unavailable"].
- Market Concentration: Moderately concentrated, with top players holding a significant but not dominant share.
- Innovation Ecosystem: Focused on formulation improvements, drug delivery, and exploring new therapeutic applications.
- Regulatory Framework: Varied across regions, impacting market entry and pricing.
- Product Substitutes: Ibuprofen and naproxen offer competition, but paracetamol maintains its leading position.
- M&A Activity: Moderate activity, with deal values ranging from xx Million to xx Million. (Specific details unavailable)
Paracetamol Industry Industry Trends & Insights
The global paracetamol market is expected to experience steady growth during the forecast period (2025-2033), driven primarily by increasing prevalence of viral infections, growing demand for over-the-counter (OTC) pain relievers, and rising healthcare expenditure globally. The Compound Annual Growth Rate (CAGR) is estimated to be xx% during this period. Technological disruptions, particularly in manufacturing processes and supply chain optimization, are contributing to improved efficiency and cost-effectiveness. Consumer preferences are shifting towards convenient dosage forms, such as single-dose packaging and fast-dissolving tablets. Competitive dynamics remain intense, with companies focusing on product differentiation, brand building, and price competitiveness to gain market share. Market penetration is high in developed countries, with growth opportunities primarily focused on emerging markets with rising disposable incomes and improved healthcare access.
Dominant Markets & Segments in Paracetamol Industry
The global paracetamol market is dominated by the Asia-Pacific region, driven by significant population growth, high prevalence of infectious diseases, and increasing healthcare expenditure. Within this region, India and China are key contributors due to their large populations and robust pharmaceutical industries.
By Dosage Form:
- Tablets represent the largest segment, driven by cost-effectiveness and ease of administration.
- Capsules hold a significant share, appealing to consumers seeking improved swallowing ease.
- Other dosage forms (e.g., liquid suspensions, suppositories) cater to specific patient populations.
By Application:
- Headache and Fever remains the largest application segment, reflecting paracetamol's primary therapeutic use.
- Cold and Cough represents a substantial segment due to paracetamol's frequent inclusion in combination products.
- Muscle Cramps and other applications contribute to the overall market size.
Key Drivers: Rapid population growth, increasing prevalence of infectious diseases, rising disposable incomes (especially in emerging markets), improvements in healthcare infrastructure, and supportive government policies promoting affordable healthcare access.
Paracetamol Industry Product Innovations
Recent product innovations in the paracetamol industry focus on improving drug delivery systems for enhanced bioavailability and patient convenience. For instance, the development of fast-dissolving tablets and extended-release formulations aims to provide rapid pain relief and prolonged therapeutic effects. Innovative combination products that incorporate paracetamol with other active ingredients address the symptoms of common illnesses. These innovations provide a competitive advantage by catering to patient needs and optimizing therapeutic outcomes.
Report Segmentation & Scope
This report segments the paracetamol market by dosage form (tablets, capsules, others) and application (headache and fever, cold and cough, muscle cramps, others). Each segment is analyzed in detail, providing insights into market size, growth projections, and competitive dynamics. The report offers a comprehensive overview of the global paracetamol market, encompassing production, consumption, trade, and pricing patterns across major geographic regions.
By Dosage Form: Tablets are projected to maintain their dominant position, with a steady growth rate driven by affordability and widespread acceptance. Capsules are also expected to exhibit growth, driven by consumer preference for ease of consumption. Other dosage forms will have more niche growth.
By Application: Headache and fever applications will continue to dominate the market, fueled by the high incidence of these conditions. Cold and cough applications will also experience significant growth due to their frequent combination with paracetamol. Other applications will contribute to the market's overall expansion.
Key Drivers of Paracetamol Industry Growth
The paracetamol industry’s growth is propelled by several factors. The increasing prevalence of infectious diseases worldwide fuels demand for effective and accessible analgesics and antipyretics. Rising disposable incomes, particularly in emerging economies, improve access to healthcare and OTC medications. Government regulations promoting affordable and quality healthcare further contribute to market growth. Technological advancements in manufacturing and drug delivery enhance the overall efficiency and availability of paracetamol products.
Challenges in the Paracetamol Industry Sector
The paracetamol industry faces certain challenges, including increasing competition from generic manufacturers which leads to price erosion. Supply chain disruptions can impact production and distribution, affecting market stability. Stringent regulatory requirements related to drug safety and efficacy can increase development costs. Furthermore, fluctuating raw material prices pose a significant challenge. These factors can influence overall market profitability and growth.
Leading Players in the Paracetamol Industry Market
- Sanofi
- Dr Reddy's Laboratories
- GlaxoSmithKline plc
- Granules India
- Genesis Biotec Inc
- CFL Pharma
- Teva Pharmaceuticals USA Inc
- Cipla
- Biological E Ltd
- Sun Pharmaceuticals Industries ltd
- Mallinckrodt Pharmaceuticals
Key Developments in Paracetamol Industry Sector
March 2022: Paraveganio, a vegan paracetamol product, received the Vegan Trademark, signifying a shift towards vegan-friendly pharmaceutical options and expanding the market for specific consumer groups.
April 2022: IOL Chemicals and Pharmaceuticals commenced commercial paracetamol production, enhancing supply capacity by 1800 MTPA and integrating backward into Para Amino Phenol (PAP) production. This vertical integration offers significant supply chain advantages and potential cost reductions.
Strategic Paracetamol Industry Market Outlook
The future of the paracetamol market appears promising, driven by continuous growth in demand across both developed and developing nations. Strategic opportunities lie in developing innovative formulations, optimizing drug delivery systems, and exploring new therapeutic applications for paracetamol. Focusing on sustainable manufacturing practices and supply chain resilience will be crucial for long-term success. Expanding market reach into underserved regions presents a substantial opportunity for growth. The focus on personalization and patient-centric approaches will also shape the future landscape of this essential pharmaceutical product.
Paracetamol Industry Segmentation
-
1. Dosage Form
- 1.1. Tablet
- 1.2. Capsules
- 1.3. Others
-
2. Application
- 2.1. Headache and Fever
- 2.2. Cold and Cough
- 2.3. Muscle Cramps
- 2.4. Others
Paracetamol Industry Segmentation By Geography
-
1. North America
- 1.1. United States
- 1.2. Canada
- 1.3. Mexico
-
2. Europe
- 2.1. Germany
- 2.2. United Kingdom
- 2.3. France
- 2.4. Italy
- 2.5. Spain
- 2.6. Rest of Europe
-
3. Asia Pacific
- 3.1. China
- 3.2. Japan
- 3.3. India
- 3.4. Australia
- 3.5. South Korea
- 3.6. Rest of Asia Pacific
-
4. Middle East and Africa
- 4.1. GCC
- 4.2. South Africa
- 4.3. Rest of Middle East and Africa
-
5. South America
- 5.1. Brazil
- 5.2. Argentina
- 5.3. Rest of South America
Paracetamol Industry REPORT HIGHLIGHTS
| Aspects | Details |
|---|---|
| Study Period | 2019-2033 |
| Base Year | 2024 |
| Estimated Year | 2025 |
| Forecast Period | 2025-2033 |
| Historical Period | 2019-2024 |
| Growth Rate | CAGR of 4.30% from 2019-2033 |
| Segmentation |
|
Table of Contents
- 1. Introduction
- 1.1. Research Scope
- 1.2. Market Segmentation
- 1.3. Research Methodology
- 1.4. Definitions and Assumptions
- 2. Executive Summary
- 2.1. Introduction
- 3. Market Dynamics
- 3.1. Introduction
- 3.2. Market Drivers
- 3.2.1 Rising Prevalence of Conditions like Headaches
- 3.2.2 Flu etc.; Increasing Demand for Pain Management Drugs
- 3.3. Market Restrains
- 3.3.1. Side Effects of Overdosage of Paracetamol
- 3.4. Market Trends
- 3.4.1. Cold and Cough Segment is Dominating the Paracetamol Market
- 4. Market Factor Analysis
- 4.1. Porters Five Forces
- 4.2. Supply/Value Chain
- 4.3. PESTEL analysis
- 4.4. Market Entropy
- 4.5. Patent/Trademark Analysis
- 5. Global Paracetamol Industry Analysis, Insights and Forecast, 2019-2031
- 5.1. Market Analysis, Insights and Forecast - by Dosage Form
- 5.1.1. Tablet
- 5.1.2. Capsules
- 5.1.3. Others
- 5.2. Market Analysis, Insights and Forecast - by Application
- 5.2.1. Headache and Fever
- 5.2.2. Cold and Cough
- 5.2.3. Muscle Cramps
- 5.2.4. Others
- 5.3. Market Analysis, Insights and Forecast - by Region
- 5.3.1. North America
- 5.3.2. Europe
- 5.3.3. Asia Pacific
- 5.3.4. Middle East and Africa
- 5.3.5. South America
- 5.1. Market Analysis, Insights and Forecast - by Dosage Form
- 6. North America Paracetamol Industry Analysis, Insights and Forecast, 2019-2031
- 6.1. Market Analysis, Insights and Forecast - by Dosage Form
- 6.1.1. Tablet
- 6.1.2. Capsules
- 6.1.3. Others
- 6.2. Market Analysis, Insights and Forecast - by Application
- 6.2.1. Headache and Fever
- 6.2.2. Cold and Cough
- 6.2.3. Muscle Cramps
- 6.2.4. Others
- 6.1. Market Analysis, Insights and Forecast - by Dosage Form
- 7. Europe Paracetamol Industry Analysis, Insights and Forecast, 2019-2031
- 7.1. Market Analysis, Insights and Forecast - by Dosage Form
- 7.1.1. Tablet
- 7.1.2. Capsules
- 7.1.3. Others
- 7.2. Market Analysis, Insights and Forecast - by Application
- 7.2.1. Headache and Fever
- 7.2.2. Cold and Cough
- 7.2.3. Muscle Cramps
- 7.2.4. Others
- 7.1. Market Analysis, Insights and Forecast - by Dosage Form
- 8. Asia Pacific Paracetamol Industry Analysis, Insights and Forecast, 2019-2031
- 8.1. Market Analysis, Insights and Forecast - by Dosage Form
- 8.1.1. Tablet
- 8.1.2. Capsules
- 8.1.3. Others
- 8.2. Market Analysis, Insights and Forecast - by Application
- 8.2.1. Headache and Fever
- 8.2.2. Cold and Cough
- 8.2.3. Muscle Cramps
- 8.2.4. Others
- 8.1. Market Analysis, Insights and Forecast - by Dosage Form
- 9. Middle East and Africa Paracetamol Industry Analysis, Insights and Forecast, 2019-2031
- 9.1. Market Analysis, Insights and Forecast - by Dosage Form
- 9.1.1. Tablet
- 9.1.2. Capsules
- 9.1.3. Others
- 9.2. Market Analysis, Insights and Forecast - by Application
- 9.2.1. Headache and Fever
- 9.2.2. Cold and Cough
- 9.2.3. Muscle Cramps
- 9.2.4. Others
- 9.1. Market Analysis, Insights and Forecast - by Dosage Form
- 10. South America Paracetamol Industry Analysis, Insights and Forecast, 2019-2031
- 10.1. Market Analysis, Insights and Forecast - by Dosage Form
- 10.1.1. Tablet
- 10.1.2. Capsules
- 10.1.3. Others
- 10.2. Market Analysis, Insights and Forecast - by Application
- 10.2.1. Headache and Fever
- 10.2.2. Cold and Cough
- 10.2.3. Muscle Cramps
- 10.2.4. Others
- 10.1. Market Analysis, Insights and Forecast - by Dosage Form
- 11. North America Paracetamol Industry Analysis, Insights and Forecast, 2019-2031
- 11.1. Market Analysis, Insights and Forecast - By Country/Sub-region
- 11.1.1 United States
- 11.1.2 Canada
- 11.1.3 Mexico
- 12. Europe Paracetamol Industry Analysis, Insights and Forecast, 2019-2031
- 12.1. Market Analysis, Insights and Forecast - By Country/Sub-region
- 12.1.1 Germany
- 12.1.2 United Kingdom
- 12.1.3 France
- 12.1.4 Italy
- 12.1.5 Spain
- 12.1.6 Rest of Europe
- 13. Asia Pacific Paracetamol Industry Analysis, Insights and Forecast, 2019-2031
- 13.1. Market Analysis, Insights and Forecast - By Country/Sub-region
- 13.1.1 China
- 13.1.2 Japan
- 13.1.3 India
- 13.1.4 Australia
- 13.1.5 South Korea
- 13.1.6 Rest of Asia Pacific
- 14. Middle East and Africa Paracetamol Industry Analysis, Insights and Forecast, 2019-2031
- 14.1. Market Analysis, Insights and Forecast - By Country/Sub-region
- 14.1.1 GCC
- 14.1.2 South Africa
- 14.1.3 Rest of Middle East and Africa
- 15. South America Paracetamol Industry Analysis, Insights and Forecast, 2019-2031
- 15.1. Market Analysis, Insights and Forecast - By Country/Sub-region
- 15.1.1 Brazil
- 15.1.2 Argentina
- 15.1.3 Rest of South America
- 16. Competitive Analysis
- 16.1. Global Market Share Analysis 2024
- 16.2. Company Profiles
- 16.2.1 Genesis Biotec Inc
- 16.2.1.1. Overview
- 16.2.1.2. Products
- 16.2.1.3. SWOT Analysis
- 16.2.1.4. Recent Developments
- 16.2.1.5. Financials (Based on Availability)
- 16.2.2 Sanofi
- 16.2.2.1. Overview
- 16.2.2.2. Products
- 16.2.2.3. SWOT Analysis
- 16.2.2.4. Recent Developments
- 16.2.2.5. Financials (Based on Availability)
- 16.2.3 Dr Reddy's Laboratories
- 16.2.3.1. Overview
- 16.2.3.2. Products
- 16.2.3.3. SWOT Analysis
- 16.2.3.4. Recent Developments
- 16.2.3.5. Financials (Based on Availability)
- 16.2.4 GlaxoSmithKline plc
- 16.2.4.1. Overview
- 16.2.4.2. Products
- 16.2.4.3. SWOT Analysis
- 16.2.4.4. Recent Developments
- 16.2.4.5. Financials (Based on Availability)
- 16.2.5 Granules India*List Not Exhaustive
- 16.2.5.1. Overview
- 16.2.5.2. Products
- 16.2.5.3. SWOT Analysis
- 16.2.5.4. Recent Developments
- 16.2.5.5. Financials (Based on Availability)
- 16.2.6 CFL Pharma
- 16.2.6.1. Overview
- 16.2.6.2. Products
- 16.2.6.3. SWOT Analysis
- 16.2.6.4. Recent Developments
- 16.2.6.5. Financials (Based on Availability)
- 16.2.7 Teva Pharmaceuticals USA Inc
- 16.2.7.1. Overview
- 16.2.7.2. Products
- 16.2.7.3. SWOT Analysis
- 16.2.7.4. Recent Developments
- 16.2.7.5. Financials (Based on Availability)
- 16.2.8 Cipla
- 16.2.8.1. Overview
- 16.2.8.2. Products
- 16.2.8.3. SWOT Analysis
- 16.2.8.4. Recent Developments
- 16.2.8.5. Financials (Based on Availability)
- 16.2.9 Biological E Ltd
- 16.2.9.1. Overview
- 16.2.9.2. Products
- 16.2.9.3. SWOT Analysis
- 16.2.9.4. Recent Developments
- 16.2.9.5. Financials (Based on Availability)
- 16.2.10 Sun Pharmaceuticals Industries ltd
- 16.2.10.1. Overview
- 16.2.10.2. Products
- 16.2.10.3. SWOT Analysis
- 16.2.10.4. Recent Developments
- 16.2.10.5. Financials (Based on Availability)
- 16.2.11 Mallinckrodt Pharmaceuticals
- 16.2.11.1. Overview
- 16.2.11.2. Products
- 16.2.11.3. SWOT Analysis
- 16.2.11.4. Recent Developments
- 16.2.11.5. Financials (Based on Availability)
- 16.2.1 Genesis Biotec Inc
List of Figures
- Figure 1: Global Paracetamol Industry Revenue Breakdown (Million, %) by Region 2024 & 2032
- Figure 2: North America Paracetamol Industry Revenue (Million), by Country 2024 & 2032
- Figure 3: North America Paracetamol Industry Revenue Share (%), by Country 2024 & 2032
- Figure 4: Europe Paracetamol Industry Revenue (Million), by Country 2024 & 2032
- Figure 5: Europe Paracetamol Industry Revenue Share (%), by Country 2024 & 2032
- Figure 6: Asia Pacific Paracetamol Industry Revenue (Million), by Country 2024 & 2032
- Figure 7: Asia Pacific Paracetamol Industry Revenue Share (%), by Country 2024 & 2032
- Figure 8: Middle East and Africa Paracetamol Industry Revenue (Million), by Country 2024 & 2032
- Figure 9: Middle East and Africa Paracetamol Industry Revenue Share (%), by Country 2024 & 2032
- Figure 10: South America Paracetamol Industry Revenue (Million), by Country 2024 & 2032
- Figure 11: South America Paracetamol Industry Revenue Share (%), by Country 2024 & 2032
- Figure 12: North America Paracetamol Industry Revenue (Million), by Dosage Form 2024 & 2032
- Figure 13: North America Paracetamol Industry Revenue Share (%), by Dosage Form 2024 & 2032
- Figure 14: North America Paracetamol Industry Revenue (Million), by Application 2024 & 2032
- Figure 15: North America Paracetamol Industry Revenue Share (%), by Application 2024 & 2032
- Figure 16: North America Paracetamol Industry Revenue (Million), by Country 2024 & 2032
- Figure 17: North America Paracetamol Industry Revenue Share (%), by Country 2024 & 2032
- Figure 18: Europe Paracetamol Industry Revenue (Million), by Dosage Form 2024 & 2032
- Figure 19: Europe Paracetamol Industry Revenue Share (%), by Dosage Form 2024 & 2032
- Figure 20: Europe Paracetamol Industry Revenue (Million), by Application 2024 & 2032
- Figure 21: Europe Paracetamol Industry Revenue Share (%), by Application 2024 & 2032
- Figure 22: Europe Paracetamol Industry Revenue (Million), by Country 2024 & 2032
- Figure 23: Europe Paracetamol Industry Revenue Share (%), by Country 2024 & 2032
- Figure 24: Asia Pacific Paracetamol Industry Revenue (Million), by Dosage Form 2024 & 2032
- Figure 25: Asia Pacific Paracetamol Industry Revenue Share (%), by Dosage Form 2024 & 2032
- Figure 26: Asia Pacific Paracetamol Industry Revenue (Million), by Application 2024 & 2032
- Figure 27: Asia Pacific Paracetamol Industry Revenue Share (%), by Application 2024 & 2032
- Figure 28: Asia Pacific Paracetamol Industry Revenue (Million), by Country 2024 & 2032
- Figure 29: Asia Pacific Paracetamol Industry Revenue Share (%), by Country 2024 & 2032
- Figure 30: Middle East and Africa Paracetamol Industry Revenue (Million), by Dosage Form 2024 & 2032
- Figure 31: Middle East and Africa Paracetamol Industry Revenue Share (%), by Dosage Form 2024 & 2032
- Figure 32: Middle East and Africa Paracetamol Industry Revenue (Million), by Application 2024 & 2032
- Figure 33: Middle East and Africa Paracetamol Industry Revenue Share (%), by Application 2024 & 2032
- Figure 34: Middle East and Africa Paracetamol Industry Revenue (Million), by Country 2024 & 2032
- Figure 35: Middle East and Africa Paracetamol Industry Revenue Share (%), by Country 2024 & 2032
- Figure 36: South America Paracetamol Industry Revenue (Million), by Dosage Form 2024 & 2032
- Figure 37: South America Paracetamol Industry Revenue Share (%), by Dosage Form 2024 & 2032
- Figure 38: South America Paracetamol Industry Revenue (Million), by Application 2024 & 2032
- Figure 39: South America Paracetamol Industry Revenue Share (%), by Application 2024 & 2032
- Figure 40: South America Paracetamol Industry Revenue (Million), by Country 2024 & 2032
- Figure 41: South America Paracetamol Industry Revenue Share (%), by Country 2024 & 2032
List of Tables
- Table 1: Global Paracetamol Industry Revenue Million Forecast, by Region 2019 & 2032
- Table 2: Global Paracetamol Industry Revenue Million Forecast, by Dosage Form 2019 & 2032
- Table 3: Global Paracetamol Industry Revenue Million Forecast, by Application 2019 & 2032
- Table 4: Global Paracetamol Industry Revenue Million Forecast, by Region 2019 & 2032
- Table 5: Global Paracetamol Industry Revenue Million Forecast, by Country 2019 & 2032
- Table 6: United States Paracetamol Industry Revenue (Million) Forecast, by Application 2019 & 2032
- Table 7: Canada Paracetamol Industry Revenue (Million) Forecast, by Application 2019 & 2032
- Table 8: Mexico Paracetamol Industry Revenue (Million) Forecast, by Application 2019 & 2032
- Table 9: Global Paracetamol Industry Revenue Million Forecast, by Country 2019 & 2032
- Table 10: Germany Paracetamol Industry Revenue (Million) Forecast, by Application 2019 & 2032
- Table 11: United Kingdom Paracetamol Industry Revenue (Million) Forecast, by Application 2019 & 2032
- Table 12: France Paracetamol Industry Revenue (Million) Forecast, by Application 2019 & 2032
- Table 13: Italy Paracetamol Industry Revenue (Million) Forecast, by Application 2019 & 2032
- Table 14: Spain Paracetamol Industry Revenue (Million) Forecast, by Application 2019 & 2032
- Table 15: Rest of Europe Paracetamol Industry Revenue (Million) Forecast, by Application 2019 & 2032
- Table 16: Global Paracetamol Industry Revenue Million Forecast, by Country 2019 & 2032
- Table 17: China Paracetamol Industry Revenue (Million) Forecast, by Application 2019 & 2032
- Table 18: Japan Paracetamol Industry Revenue (Million) Forecast, by Application 2019 & 2032
- Table 19: India Paracetamol Industry Revenue (Million) Forecast, by Application 2019 & 2032
- Table 20: Australia Paracetamol Industry Revenue (Million) Forecast, by Application 2019 & 2032
- Table 21: South Korea Paracetamol Industry Revenue (Million) Forecast, by Application 2019 & 2032
- Table 22: Rest of Asia Pacific Paracetamol Industry Revenue (Million) Forecast, by Application 2019 & 2032
- Table 23: Global Paracetamol Industry Revenue Million Forecast, by Country 2019 & 2032
- Table 24: GCC Paracetamol Industry Revenue (Million) Forecast, by Application 2019 & 2032
- Table 25: South Africa Paracetamol Industry Revenue (Million) Forecast, by Application 2019 & 2032
- Table 26: Rest of Middle East and Africa Paracetamol Industry Revenue (Million) Forecast, by Application 2019 & 2032
- Table 27: Global Paracetamol Industry Revenue Million Forecast, by Country 2019 & 2032
- Table 28: Brazil Paracetamol Industry Revenue (Million) Forecast, by Application 2019 & 2032
- Table 29: Argentina Paracetamol Industry Revenue (Million) Forecast, by Application 2019 & 2032
- Table 30: Rest of South America Paracetamol Industry Revenue (Million) Forecast, by Application 2019 & 2032
- Table 31: Global Paracetamol Industry Revenue Million Forecast, by Dosage Form 2019 & 2032
- Table 32: Global Paracetamol Industry Revenue Million Forecast, by Application 2019 & 2032
- Table 33: Global Paracetamol Industry Revenue Million Forecast, by Country 2019 & 2032
- Table 34: United States Paracetamol Industry Revenue (Million) Forecast, by Application 2019 & 2032
- Table 35: Canada Paracetamol Industry Revenue (Million) Forecast, by Application 2019 & 2032
- Table 36: Mexico Paracetamol Industry Revenue (Million) Forecast, by Application 2019 & 2032
- Table 37: Global Paracetamol Industry Revenue Million Forecast, by Dosage Form 2019 & 2032
- Table 38: Global Paracetamol Industry Revenue Million Forecast, by Application 2019 & 2032
- Table 39: Global Paracetamol Industry Revenue Million Forecast, by Country 2019 & 2032
- Table 40: Germany Paracetamol Industry Revenue (Million) Forecast, by Application 2019 & 2032
- Table 41: United Kingdom Paracetamol Industry Revenue (Million) Forecast, by Application 2019 & 2032
- Table 42: France Paracetamol Industry Revenue (Million) Forecast, by Application 2019 & 2032
- Table 43: Italy Paracetamol Industry Revenue (Million) Forecast, by Application 2019 & 2032
- Table 44: Spain Paracetamol Industry Revenue (Million) Forecast, by Application 2019 & 2032
- Table 45: Rest of Europe Paracetamol Industry Revenue (Million) Forecast, by Application 2019 & 2032
- Table 46: Global Paracetamol Industry Revenue Million Forecast, by Dosage Form 2019 & 2032
- Table 47: Global Paracetamol Industry Revenue Million Forecast, by Application 2019 & 2032
- Table 48: Global Paracetamol Industry Revenue Million Forecast, by Country 2019 & 2032
- Table 49: China Paracetamol Industry Revenue (Million) Forecast, by Application 2019 & 2032
- Table 50: Japan Paracetamol Industry Revenue (Million) Forecast, by Application 2019 & 2032
- Table 51: India Paracetamol Industry Revenue (Million) Forecast, by Application 2019 & 2032
- Table 52: Australia Paracetamol Industry Revenue (Million) Forecast, by Application 2019 & 2032
- Table 53: South Korea Paracetamol Industry Revenue (Million) Forecast, by Application 2019 & 2032
- Table 54: Rest of Asia Pacific Paracetamol Industry Revenue (Million) Forecast, by Application 2019 & 2032
- Table 55: Global Paracetamol Industry Revenue Million Forecast, by Dosage Form 2019 & 2032
- Table 56: Global Paracetamol Industry Revenue Million Forecast, by Application 2019 & 2032
- Table 57: Global Paracetamol Industry Revenue Million Forecast, by Country 2019 & 2032
- Table 58: GCC Paracetamol Industry Revenue (Million) Forecast, by Application 2019 & 2032
- Table 59: South Africa Paracetamol Industry Revenue (Million) Forecast, by Application 2019 & 2032
- Table 60: Rest of Middle East and Africa Paracetamol Industry Revenue (Million) Forecast, by Application 2019 & 2032
- Table 61: Global Paracetamol Industry Revenue Million Forecast, by Dosage Form 2019 & 2032
- Table 62: Global Paracetamol Industry Revenue Million Forecast, by Application 2019 & 2032
- Table 63: Global Paracetamol Industry Revenue Million Forecast, by Country 2019 & 2032
- Table 64: Brazil Paracetamol Industry Revenue (Million) Forecast, by Application 2019 & 2032
- Table 65: Argentina Paracetamol Industry Revenue (Million) Forecast, by Application 2019 & 2032
- Table 66: Rest of South America Paracetamol Industry Revenue (Million) Forecast, by Application 2019 & 2032
Frequently Asked Questions
1. What is the projected Compound Annual Growth Rate (CAGR) of the Paracetamol Industry?
The projected CAGR is approximately 4.30%.
2. Which companies are prominent players in the Paracetamol Industry?
Key companies in the market include Genesis Biotec Inc, Sanofi, Dr Reddy's Laboratories, GlaxoSmithKline plc, Granules India*List Not Exhaustive, CFL Pharma, Teva Pharmaceuticals USA Inc, Cipla, Biological E Ltd, Sun Pharmaceuticals Industries ltd, Mallinckrodt Pharmaceuticals.
3. What are the main segments of the Paracetamol Industry?
The market segments include Dosage Form, Application.
4. Can you provide details about the market size?
The market size is estimated to be USD XX Million as of 2022.
5. What are some drivers contributing to market growth?
Rising Prevalence of Conditions like Headaches. Flu etc.; Increasing Demand for Pain Management Drugs.
6. What are the notable trends driving market growth?
Cold and Cough Segment is Dominating the Paracetamol Market.
7. Are there any restraints impacting market growth?
Side Effects of Overdosage of Paracetamol.
8. Can you provide examples of recent developments in the market?
April 2022: IOL Chemicals and Pharmaceuticals started commercial production of paracetamol with an installed capacity of 1800 MTPA and backward integration of Para Amino Phenol (PAP).
9. What pricing options are available for accessing the report?
Pricing options include single-user, multi-user, and enterprise licenses priced at USD 4750, USD 5250, and USD 8750 respectively.
10. Is the market size provided in terms of value or volume?
The market size is provided in terms of value, measured in Million.
11. Are there any specific market keywords associated with the report?
Yes, the market keyword associated with the report is "Paracetamol Industry," which aids in identifying and referencing the specific market segment covered.
12. How do I determine which pricing option suits my needs best?
The pricing options vary based on user requirements and access needs. Individual users may opt for single-user licenses, while businesses requiring broader access may choose multi-user or enterprise licenses for cost-effective access to the report.
13. Are there any additional resources or data provided in the Paracetamol Industry report?
While the report offers comprehensive insights, it's advisable to review the specific contents or supplementary materials provided to ascertain if additional resources or data are available.
14. How can I stay updated on further developments or reports in the Paracetamol Industry?
To stay informed about further developments, trends, and reports in the Paracetamol Industry, consider subscribing to industry newsletters, following relevant companies and organizations, or regularly checking reputable industry news sources and publications.
Methodology
Step 1 - Identification of Relevant Samples Size from Population Database


Step 2 - Approaches for Defining Global Market Size (Value, Volume* & Price*)

Note*: In applicable scenarios
Step 3 - Data Sources
Primary Research
- Web Analytics
- Survey Reports
- Research Institute
- Latest Research Reports
- Opinion Leaders
Secondary Research
- Annual Reports
- White Paper
- Latest Press Release
- Industry Association
- Paid Database
- Investor Presentations

Step 4 - Data Triangulation
Involves using different sources of information in order to increase the validity of a study
These sources are likely to be stakeholders in a program - participants, other researchers, program staff, other community members, and so on.
Then we put all data in single framework & apply various statistical tools to find out the dynamic on the market.
During the analysis stage, feedback from the stakeholder groups would be compared to determine areas of agreement as well as areas of divergence


