
Key Insights
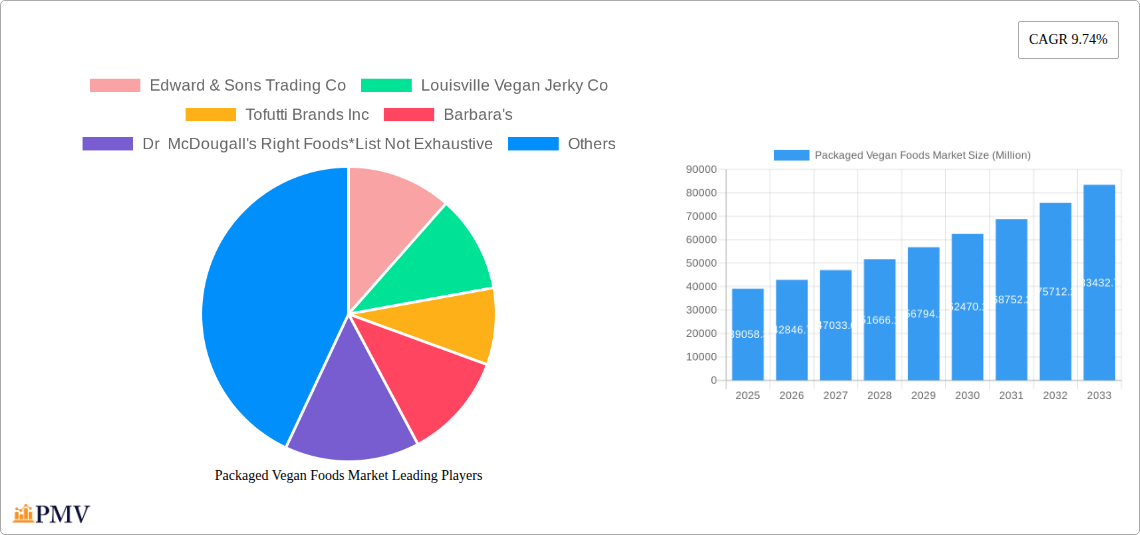
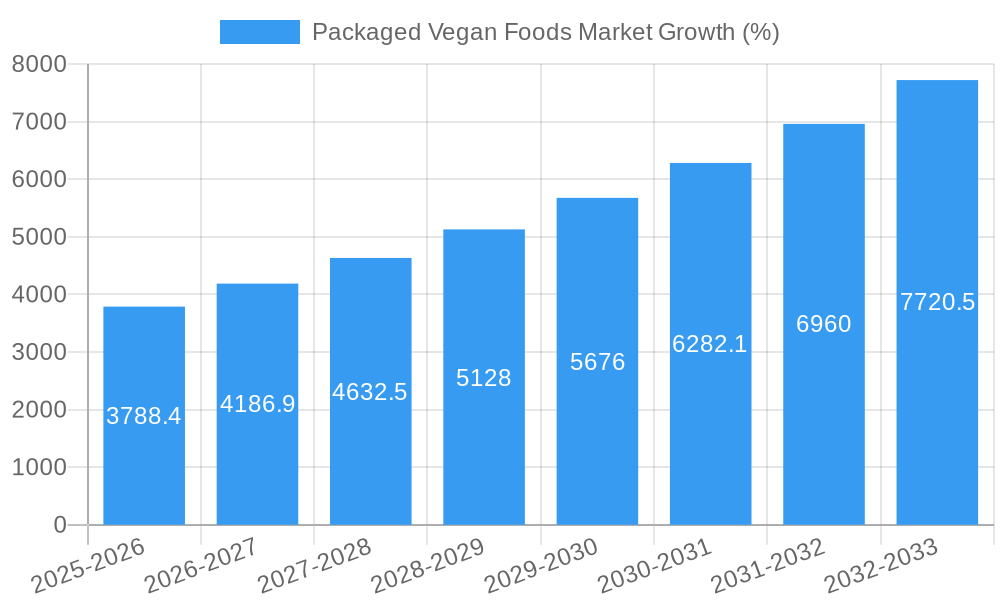
The global packaged vegan foods market, valued at $39,058.3 million in 2025, is experiencing robust growth, projected to expand at a Compound Annual Growth Rate (CAGR) of 9.74% from 2025 to 2033. This surge is driven by several key factors. Increasing consumer awareness of health benefits associated with plant-based diets, including reduced risk of heart disease and improved digestive health, is a primary driver. Growing environmental concerns, particularly regarding the carbon footprint of animal agriculture, are also fueling demand for sustainable alternatives. Furthermore, the rising popularity of veganism and vegetarianism, driven by ethical considerations and concerns about animal welfare, significantly contributes to market expansion. The increasing availability of diverse and palatable vegan products that mimic the taste and texture of traditional meat and dairy items is another significant factor. Supermarkets and hypermarkets currently dominate the distribution channels, but online sales are expected to see substantial growth, reflecting the broader e-commerce trend within the food industry.
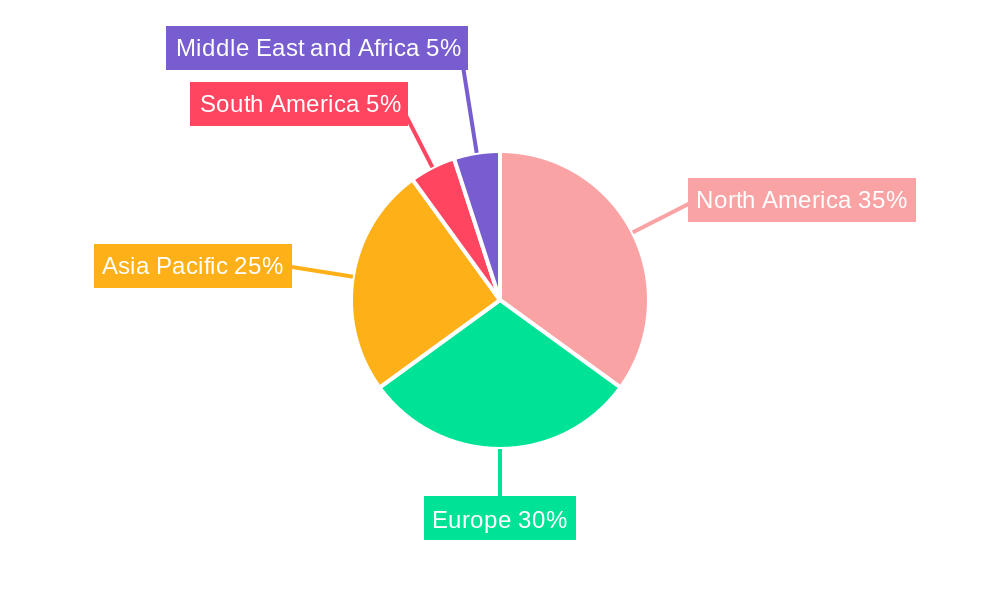
Market segmentation reveals strong performance across various product categories. Dairy alternatives, such as plant-based milks and yogurts, are currently a major segment, but meat alternatives and packaged vegan meals are exhibiting exceptionally high growth rates, driven by the increasing demand for convenient and protein-rich options. Vegan bakery and confectionery products are also contributing to the market's expansion, as consumers seek plant-based versions of their favorite treats. Geographical analysis indicates strong growth across all regions, with North America and Europe currently leading the market, but the Asia-Pacific region shows significant potential for future expansion due to its large and rapidly growing population and increasing adoption of Western dietary trends. Key players in this dynamic market include established food companies and innovative startups, continuously striving to improve product quality, expand product lines, and enhance distribution networks to meet the rising global demand for packaged vegan foods.
Packaged Vegan Foods Market: A Comprehensive Market Analysis (2019-2033)
This in-depth report provides a comprehensive analysis of the Packaged Vegan Foods market, offering invaluable insights for industry stakeholders, investors, and strategic decision-makers. Covering the period 2019-2033, with a base year of 2025 and a forecast period of 2025-2033, this report meticulously examines market trends, competitive dynamics, and growth drivers to provide a clear understanding of this rapidly expanding sector. The market value in 2025 is estimated at xx Million.
Packaged Vegan Foods Market Market Structure & Competitive Dynamics
This section analyzes the competitive landscape of the packaged vegan foods market, exploring market concentration, innovation, regulatory frameworks, and key industry dynamics. We examine the market share held by leading players like Edward & Sons Trading Co, Louisville Vegan Jerky Co, Tofutti Brands Inc, Barbara's, Dr McDougall's Right Foods, Follow Your Heart, Danone S.A., Annie's Homegrown Inc, Beyond Meat, and Amy's Kitchen Inc, noting that this list is not exhaustive. The report delves into the impact of mergers and acquisitions (M&A) activity, quantifying deal values where possible, and assessing their influence on market consolidation and innovation. The analysis also considers the impact of product substitutes, end-user trends, and evolving regulatory frameworks on market structure. Market concentration is assessed through metrics like the Herfindahl-Hirschman Index (HHI), while innovation is evaluated based on new product launches, R&D investments, and patent filings. The analysis of regulatory frameworks considers factors such as labeling regulations and food safety standards, highlighting their influence on market access and competitive advantage. The report also details the impact of consumer trends, such as increased health consciousness and environmental concerns, on the growth trajectory of this sector.
Packaged Vegan Foods Market Industry Trends & Insights
This section provides a detailed analysis of the key industry trends shaping the packaged vegan foods market. We explore the market's Compound Annual Growth Rate (CAGR) during the historical period (2019-2024) and project the CAGR for the forecast period (2025-2033). Key growth drivers are identified, including rising consumer demand for plant-based alternatives, increasing awareness of health and environmental benefits, and technological advancements in food processing. The report analyzes the impact of technological disruptions, such as advancements in plant-based protein production and improved food preservation techniques, on market dynamics. Furthermore, the analysis will consider shifts in consumer preferences, such as increasing demand for convenience and premium products, as well as their impact on product innovation and market segmentation. The competitive landscape, including pricing strategies, brand positioning, and marketing campaigns, is meticulously analyzed to understand its role in shaping industry trends. The report further examines market penetration rates across various product categories and geographic regions, providing a nuanced perspective on market growth dynamics.
Dominant Markets & Segments in Packaged Vegan Foods Market
This section identifies the dominant regions, countries, and segments within the packaged vegan foods market. The analysis considers both product type (dairy alternatives, meat alternatives & packaged vegan meals, vegan bakery & confectionery products, others) and distribution channel (supermarket/hypermarkets, convenience stores, online stores, others).
By Product Type: The report identifies the leading product category based on market share and growth rate. Detailed analysis will examine the key drivers for the dominant segment's success, including consumer preferences, technological advancements, and pricing strategies.
By Distribution Channel: This section pinpoints the most successful distribution channel for packaged vegan foods, supported by data on market share and sales growth. Key drivers for channel dominance, such as consumer shopping habits, logistics efficiency, and retailer strategies, will be comprehensively explored.
Dominance Analysis: Paragraphs will provide in-depth analysis of the dominant segments, exploring the underlying economic policies, infrastructure developments, and other factors contributing to their market leadership. Regional variations in consumer preferences, regulatory environments, and economic conditions will also be considered.
Packaged Vegan Foods Market Product Innovations
This section highlights recent product developments, outlining key innovations in packaged vegan foods, such as the introduction of new plant-based proteins, improved textures and flavors, and sustainable packaging solutions. The analysis will assess the competitive advantages offered by these innovations, and how they are enhancing the appeal of vegan products to a wider consumer base. Furthermore, the section will discuss the technological trends driving product development, such as advancements in biotechnology and food science, and how these are influencing the market fit of newly introduced products.
Report Segmentation & Scope
This report segments the packaged vegan foods market across two key dimensions: product type and distribution channel.
Product Type: Dairy alternatives, meat alternatives & packaged vegan meals, vegan bakery & confectionery products, and others. Each segment's market size, growth projections, and competitive landscape will be detailed, along with an analysis of specific trends within each category.
Distribution Channel: Supermarket/hypermarkets, convenience stores, online stores, and others. This section will analyze the performance of each distribution channel, identifying key growth drivers and challenges for each. Competitive dynamics within each channel, including retailer strategies and consumer behavior, will be thoroughly investigated.
Each segment's description includes growth projections, market sizes (in Millions), and competitive dynamics.
Key Drivers of Packaged Vegan Foods Market Growth
The growth of the packaged vegan foods market is driven by several factors, including the rising adoption of vegan and vegetarian lifestyles due to increasing awareness of health and environmental benefits. Technological advancements in plant-based protein production and flavor enhancement have also significantly contributed to market expansion. Favorable government policies and regulations promoting sustainable and plant-based diets further support the market's growth. The increasing availability of vegan products in mainstream retail channels also fuels market growth.
Challenges in the Packaged Vegan Foods Market Sector
Several challenges hinder the growth of the packaged vegan foods market. These include maintaining product quality and shelf life, managing supply chain complexities, and overcoming consumer perceptions regarding taste and texture compared to traditional food products. Competition from established food companies and the need for continuous product innovation to meet evolving consumer demands also pose significant challenges. Regulatory hurdles and varying food safety standards across different regions can also create barriers to market entry and expansion. The impact of these challenges on market growth is quantified where possible.
Leading Players in the Packaged Vegan Foods Market Market
- Edward & Sons Trading Co
- Louisville Vegan Jerky Co
- Tofutti Brands Inc
- Barbara's
- Dr McDougall's Right Foods
- Follow Your Heart
- Danone S.A.
- Annie's Homegrown Inc
- Beyond Meat
- Amy's Kitchen Inc
Key Developments in Packaged Vegan Foods Market Sector
- January 2023: Beyond Meat launches new plant-based burger with improved texture and taste.
- March 2022: Danone acquires a significant stake in a leading vegan yogurt producer.
- June 2021: Amy's Kitchen expands its vegan product line with ready-to-eat meals.
- September 2020: New regulations regarding vegan food labeling are introduced in the EU. (Further specific developments with dates and impact will be included in the full report).
Strategic Packaged Vegan Foods Market Market Outlook
The future of the packaged vegan foods market appears bright, with continued growth driven by increasing consumer demand and ongoing innovation. Strategic opportunities exist for companies focusing on product differentiation, sustainability, and expanding into new geographic markets. Investment in research and development, coupled with effective marketing strategies targeting health-conscious and environmentally aware consumers, will be crucial for success in this dynamic market. The market is projected to reach xx Million by 2033, presenting significant potential for both established players and new entrants.
Packaged Vegan Foods Market Segmentation
-
1. Product Type
- 1.1. Dairy alternatives
- 1.2. Meat alternatives & packaged vegan meals
- 1.3. Vegan bakery & confectionery products
- 1.4. Others
-
2. Distribution Channel
- 2.1. Supermarket/ Hypermarkets
- 2.2. Convenience Stores
- 2.3. Online Stores
- 2.4. Others
Packaged Vegan Foods Market Segmentation By Geography
-
1. North America
- 1.1. United States
- 1.2. Canada
- 1.3. Mexico
- 1.4. Rest of North America
-
2. Europe
- 2.1. Spain
- 2.2. United Kingdom
- 2.3. Germany
- 2.4. France
- 2.5. Italy
- 2.6. Russia
- 2.7. Rest of Europe
-
3. Asia Pacific
- 3.1. China
- 3.2. Japan
- 3.3. India
- 3.4. Australia
- 3.5. Rest of Asia Pacific
-
4. South America
- 4.1. Brazil
- 4.2. Argentina
- 4.3. Rest of South America
-
5. Middle East and Africa
- 5.1. South Africa
- 5.2. Saudi Arabia
- 5.3. Rest of Middle East and Africa
Packaged Vegan Foods Market REPORT HIGHLIGHTS
| Aspects | Details |
|---|---|
| Study Period | 2019-2033 |
| Base Year | 2024 |
| Estimated Year | 2025 |
| Forecast Period | 2025-2033 |
| Historical Period | 2019-2024 |
| Growth Rate | CAGR of 9.74% from 2019-2033 |
| Segmentation |
|
Table of Contents
- 1. Introduction
- 1.1. Research Scope
- 1.2. Market Segmentation
- 1.3. Research Methodology
- 1.4. Definitions and Assumptions
- 2. Executive Summary
- 2.1. Introduction
- 3. Market Dynamics
- 3.1. Introduction
- 3.2. Market Drivers
- 3.2.1. Growing Demand for Nutricosmetics Among Millennials; Growing Beauty and Wellness Trend
- 3.3. Market Restrains
- 3.3.1. Stringent Government Regulations and Product Guidelines
- 3.4. Market Trends
- 3.4.1. Plant-based Meat Substitutes are Gaining Significance
- 4. Market Factor Analysis
- 4.1. Porters Five Forces
- 4.2. Supply/Value Chain
- 4.3. PESTEL analysis
- 4.4. Market Entropy
- 4.5. Patent/Trademark Analysis
- 5. Global Packaged Vegan Foods Market Analysis, Insights and Forecast, 2019-2031
- 5.1. Market Analysis, Insights and Forecast - by Product Type
- 5.1.1. Dairy alternatives
- 5.1.2. Meat alternatives & packaged vegan meals
- 5.1.3. Vegan bakery & confectionery products
- 5.1.4. Others
- 5.2. Market Analysis, Insights and Forecast - by Distribution Channel
- 5.2.1. Supermarket/ Hypermarkets
- 5.2.2. Convenience Stores
- 5.2.3. Online Stores
- 5.2.4. Others
- 5.3. Market Analysis, Insights and Forecast - by Region
- 5.3.1. North America
- 5.3.2. Europe
- 5.3.3. Asia Pacific
- 5.3.4. South America
- 5.3.5. Middle East and Africa
- 5.1. Market Analysis, Insights and Forecast - by Product Type
- 6. North America Packaged Vegan Foods Market Analysis, Insights and Forecast, 2019-2031
- 6.1. Market Analysis, Insights and Forecast - by Product Type
- 6.1.1. Dairy alternatives
- 6.1.2. Meat alternatives & packaged vegan meals
- 6.1.3. Vegan bakery & confectionery products
- 6.1.4. Others
- 6.2. Market Analysis, Insights and Forecast - by Distribution Channel
- 6.2.1. Supermarket/ Hypermarkets
- 6.2.2. Convenience Stores
- 6.2.3. Online Stores
- 6.2.4. Others
- 6.1. Market Analysis, Insights and Forecast - by Product Type
- 7. Europe Packaged Vegan Foods Market Analysis, Insights and Forecast, 2019-2031
- 7.1. Market Analysis, Insights and Forecast - by Product Type
- 7.1.1. Dairy alternatives
- 7.1.2. Meat alternatives & packaged vegan meals
- 7.1.3. Vegan bakery & confectionery products
- 7.1.4. Others
- 7.2. Market Analysis, Insights and Forecast - by Distribution Channel
- 7.2.1. Supermarket/ Hypermarkets
- 7.2.2. Convenience Stores
- 7.2.3. Online Stores
- 7.2.4. Others
- 7.1. Market Analysis, Insights and Forecast - by Product Type
- 8. Asia Pacific Packaged Vegan Foods Market Analysis, Insights and Forecast, 2019-2031
- 8.1. Market Analysis, Insights and Forecast - by Product Type
- 8.1.1. Dairy alternatives
- 8.1.2. Meat alternatives & packaged vegan meals
- 8.1.3. Vegan bakery & confectionery products
- 8.1.4. Others
- 8.2. Market Analysis, Insights and Forecast - by Distribution Channel
- 8.2.1. Supermarket/ Hypermarkets
- 8.2.2. Convenience Stores
- 8.2.3. Online Stores
- 8.2.4. Others
- 8.1. Market Analysis, Insights and Forecast - by Product Type
- 9. South America Packaged Vegan Foods Market Analysis, Insights and Forecast, 2019-2031
- 9.1. Market Analysis, Insights and Forecast - by Product Type
- 9.1.1. Dairy alternatives
- 9.1.2. Meat alternatives & packaged vegan meals
- 9.1.3. Vegan bakery & confectionery products
- 9.1.4. Others
- 9.2. Market Analysis, Insights and Forecast - by Distribution Channel
- 9.2.1. Supermarket/ Hypermarkets
- 9.2.2. Convenience Stores
- 9.2.3. Online Stores
- 9.2.4. Others
- 9.1. Market Analysis, Insights and Forecast - by Product Type
- 10. Middle East and Africa Packaged Vegan Foods Market Analysis, Insights and Forecast, 2019-2031
- 10.1. Market Analysis, Insights and Forecast - by Product Type
- 10.1.1. Dairy alternatives
- 10.1.2. Meat alternatives & packaged vegan meals
- 10.1.3. Vegan bakery & confectionery products
- 10.1.4. Others
- 10.2. Market Analysis, Insights and Forecast - by Distribution Channel
- 10.2.1. Supermarket/ Hypermarkets
- 10.2.2. Convenience Stores
- 10.2.3. Online Stores
- 10.2.4. Others
- 10.1. Market Analysis, Insights and Forecast - by Product Type
- 11. North America Packaged Vegan Foods Market Analysis, Insights and Forecast, 2019-2031
- 11.1. Market Analysis, Insights and Forecast - By Country/Sub-region
- 11.1.1 United States
- 11.1.2 Canada
- 11.1.3 Mexico
- 11.1.4 Rest of North America
- 12. Europe Packaged Vegan Foods Market Analysis, Insights and Forecast, 2019-2031
- 12.1. Market Analysis, Insights and Forecast - By Country/Sub-region
- 12.1.1 Spain
- 12.1.2 United Kingdom
- 12.1.3 Germany
- 12.1.4 France
- 12.1.5 Italy
- 12.1.6 Russia
- 12.1.7 Rest of Europe
- 13. Asia Pacific Packaged Vegan Foods Market Analysis, Insights and Forecast, 2019-2031
- 13.1. Market Analysis, Insights and Forecast - By Country/Sub-region
- 13.1.1 China
- 13.1.2 Japan
- 13.1.3 India
- 13.1.4 Australia
- 13.1.5 Rest of Asia Pacific
- 14. South America Packaged Vegan Foods Market Analysis, Insights and Forecast, 2019-2031
- 14.1. Market Analysis, Insights and Forecast - By Country/Sub-region
- 14.1.1 Brazil
- 14.1.2 Argentina
- 14.1.3 Rest of South America
- 15. Middle East and Africa Packaged Vegan Foods Market Analysis, Insights and Forecast, 2019-2031
- 15.1. Market Analysis, Insights and Forecast - By Country/Sub-region
- 15.1.1 South Africa
- 15.1.2 Saudi Arabia
- 15.1.3 Rest of Middle East and Africa
- 16. Competitive Analysis
- 16.1. Global Market Share Analysis 2024
- 16.2. Company Profiles
- 16.2.1 Edward & Sons Trading Co
- 16.2.1.1. Overview
- 16.2.1.2. Products
- 16.2.1.3. SWOT Analysis
- 16.2.1.4. Recent Developments
- 16.2.1.5. Financials (Based on Availability)
- 16.2.2 Louisville Vegan Jerky Co
- 16.2.2.1. Overview
- 16.2.2.2. Products
- 16.2.2.3. SWOT Analysis
- 16.2.2.4. Recent Developments
- 16.2.2.5. Financials (Based on Availability)
- 16.2.3 Tofutti Brands Inc
- 16.2.3.1. Overview
- 16.2.3.2. Products
- 16.2.3.3. SWOT Analysis
- 16.2.3.4. Recent Developments
- 16.2.3.5. Financials (Based on Availability)
- 16.2.4 Barbara's
- 16.2.4.1. Overview
- 16.2.4.2. Products
- 16.2.4.3. SWOT Analysis
- 16.2.4.4. Recent Developments
- 16.2.4.5. Financials (Based on Availability)
- 16.2.5 Dr McDougall's Right Foods*List Not Exhaustive
- 16.2.5.1. Overview
- 16.2.5.2. Products
- 16.2.5.3. SWOT Analysis
- 16.2.5.4. Recent Developments
- 16.2.5.5. Financials (Based on Availability)
- 16.2.6 Follow Your Heart
- 16.2.6.1. Overview
- 16.2.6.2. Products
- 16.2.6.3. SWOT Analysis
- 16.2.6.4. Recent Developments
- 16.2.6.5. Financials (Based on Availability)
- 16.2.7 Danone S A
- 16.2.7.1. Overview
- 16.2.7.2. Products
- 16.2.7.3. SWOT Analysis
- 16.2.7.4. Recent Developments
- 16.2.7.5. Financials (Based on Availability)
- 16.2.8 Annie's Homegrown Inc
- 16.2.8.1. Overview
- 16.2.8.2. Products
- 16.2.8.3. SWOT Analysis
- 16.2.8.4. Recent Developments
- 16.2.8.5. Financials (Based on Availability)
- 16.2.9 Beyond Meat
- 16.2.9.1. Overview
- 16.2.9.2. Products
- 16.2.9.3. SWOT Analysis
- 16.2.9.4. Recent Developments
- 16.2.9.5. Financials (Based on Availability)
- 16.2.10 Amy's Kitchen Inc
- 16.2.10.1. Overview
- 16.2.10.2. Products
- 16.2.10.3. SWOT Analysis
- 16.2.10.4. Recent Developments
- 16.2.10.5. Financials (Based on Availability)
- 16.2.1 Edward & Sons Trading Co
List of Figures
- Figure 1: Global Packaged Vegan Foods Market Revenue Breakdown (Million, %) by Region 2024 & 2032
- Figure 2: Global Packaged Vegan Foods Market Volume Breakdown (K Units, %) by Region 2024 & 2032
- Figure 3: North America Packaged Vegan Foods Market Revenue (Million), by Country 2024 & 2032
- Figure 4: North America Packaged Vegan Foods Market Volume (K Units), by Country 2024 & 2032
- Figure 5: North America Packaged Vegan Foods Market Revenue Share (%), by Country 2024 & 2032
- Figure 6: North America Packaged Vegan Foods Market Volume Share (%), by Country 2024 & 2032
- Figure 7: Europe Packaged Vegan Foods Market Revenue (Million), by Country 2024 & 2032
- Figure 8: Europe Packaged Vegan Foods Market Volume (K Units), by Country 2024 & 2032
- Figure 9: Europe Packaged Vegan Foods Market Revenue Share (%), by Country 2024 & 2032
- Figure 10: Europe Packaged Vegan Foods Market Volume Share (%), by Country 2024 & 2032
- Figure 11: Asia Pacific Packaged Vegan Foods Market Revenue (Million), by Country 2024 & 2032
- Figure 12: Asia Pacific Packaged Vegan Foods Market Volume (K Units), by Country 2024 & 2032
- Figure 13: Asia Pacific Packaged Vegan Foods Market Revenue Share (%), by Country 2024 & 2032
- Figure 14: Asia Pacific Packaged Vegan Foods Market Volume Share (%), by Country 2024 & 2032
- Figure 15: South America Packaged Vegan Foods Market Revenue (Million), by Country 2024 & 2032
- Figure 16: South America Packaged Vegan Foods Market Volume (K Units), by Country 2024 & 2032
- Figure 17: South America Packaged Vegan Foods Market Revenue Share (%), by Country 2024 & 2032
- Figure 18: South America Packaged Vegan Foods Market Volume Share (%), by Country 2024 & 2032
- Figure 19: Middle East and Africa Packaged Vegan Foods Market Revenue (Million), by Country 2024 & 2032
- Figure 20: Middle East and Africa Packaged Vegan Foods Market Volume (K Units), by Country 2024 & 2032
- Figure 21: Middle East and Africa Packaged Vegan Foods Market Revenue Share (%), by Country 2024 & 2032
- Figure 22: Middle East and Africa Packaged Vegan Foods Market Volume Share (%), by Country 2024 & 2032
- Figure 23: North America Packaged Vegan Foods Market Revenue (Million), by Product Type 2024 & 2032
- Figure 24: North America Packaged Vegan Foods Market Volume (K Units), by Product Type 2024 & 2032
- Figure 25: North America Packaged Vegan Foods Market Revenue Share (%), by Product Type 2024 & 2032
- Figure 26: North America Packaged Vegan Foods Market Volume Share (%), by Product Type 2024 & 2032
- Figure 27: North America Packaged Vegan Foods Market Revenue (Million), by Distribution Channel 2024 & 2032
- Figure 28: North America Packaged Vegan Foods Market Volume (K Units), by Distribution Channel 2024 & 2032
- Figure 29: North America Packaged Vegan Foods Market Revenue Share (%), by Distribution Channel 2024 & 2032
- Figure 30: North America Packaged Vegan Foods Market Volume Share (%), by Distribution Channel 2024 & 2032
- Figure 31: North America Packaged Vegan Foods Market Revenue (Million), by Country 2024 & 2032
- Figure 32: North America Packaged Vegan Foods Market Volume (K Units), by Country 2024 & 2032
- Figure 33: North America Packaged Vegan Foods Market Revenue Share (%), by Country 2024 & 2032
- Figure 34: North America Packaged Vegan Foods Market Volume Share (%), by Country 2024 & 2032
- Figure 35: Europe Packaged Vegan Foods Market Revenue (Million), by Product Type 2024 & 2032
- Figure 36: Europe Packaged Vegan Foods Market Volume (K Units), by Product Type 2024 & 2032
- Figure 37: Europe Packaged Vegan Foods Market Revenue Share (%), by Product Type 2024 & 2032
- Figure 38: Europe Packaged Vegan Foods Market Volume Share (%), by Product Type 2024 & 2032
- Figure 39: Europe Packaged Vegan Foods Market Revenue (Million), by Distribution Channel 2024 & 2032
- Figure 40: Europe Packaged Vegan Foods Market Volume (K Units), by Distribution Channel 2024 & 2032
- Figure 41: Europe Packaged Vegan Foods Market Revenue Share (%), by Distribution Channel 2024 & 2032
- Figure 42: Europe Packaged Vegan Foods Market Volume Share (%), by Distribution Channel 2024 & 2032
- Figure 43: Europe Packaged Vegan Foods Market Revenue (Million), by Country 2024 & 2032
- Figure 44: Europe Packaged Vegan Foods Market Volume (K Units), by Country 2024 & 2032
- Figure 45: Europe Packaged Vegan Foods Market Revenue Share (%), by Country 2024 & 2032
- Figure 46: Europe Packaged Vegan Foods Market Volume Share (%), by Country 2024 & 2032
- Figure 47: Asia Pacific Packaged Vegan Foods Market Revenue (Million), by Product Type 2024 & 2032
- Figure 48: Asia Pacific Packaged Vegan Foods Market Volume (K Units), by Product Type 2024 & 2032
- Figure 49: Asia Pacific Packaged Vegan Foods Market Revenue Share (%), by Product Type 2024 & 2032
- Figure 50: Asia Pacific Packaged Vegan Foods Market Volume Share (%), by Product Type 2024 & 2032
- Figure 51: Asia Pacific Packaged Vegan Foods Market Revenue (Million), by Distribution Channel 2024 & 2032
- Figure 52: Asia Pacific Packaged Vegan Foods Market Volume (K Units), by Distribution Channel 2024 & 2032
- Figure 53: Asia Pacific Packaged Vegan Foods Market Revenue Share (%), by Distribution Channel 2024 & 2032
- Figure 54: Asia Pacific Packaged Vegan Foods Market Volume Share (%), by Distribution Channel 2024 & 2032
- Figure 55: Asia Pacific Packaged Vegan Foods Market Revenue (Million), by Country 2024 & 2032
- Figure 56: Asia Pacific Packaged Vegan Foods Market Volume (K Units), by Country 2024 & 2032
- Figure 57: Asia Pacific Packaged Vegan Foods Market Revenue Share (%), by Country 2024 & 2032
- Figure 58: Asia Pacific Packaged Vegan Foods Market Volume Share (%), by Country 2024 & 2032
- Figure 59: South America Packaged Vegan Foods Market Revenue (Million), by Product Type 2024 & 2032
- Figure 60: South America Packaged Vegan Foods Market Volume (K Units), by Product Type 2024 & 2032
- Figure 61: South America Packaged Vegan Foods Market Revenue Share (%), by Product Type 2024 & 2032
- Figure 62: South America Packaged Vegan Foods Market Volume Share (%), by Product Type 2024 & 2032
- Figure 63: South America Packaged Vegan Foods Market Revenue (Million), by Distribution Channel 2024 & 2032
- Figure 64: South America Packaged Vegan Foods Market Volume (K Units), by Distribution Channel 2024 & 2032
- Figure 65: South America Packaged Vegan Foods Market Revenue Share (%), by Distribution Channel 2024 & 2032
- Figure 66: South America Packaged Vegan Foods Market Volume Share (%), by Distribution Channel 2024 & 2032
- Figure 67: South America Packaged Vegan Foods Market Revenue (Million), by Country 2024 & 2032
- Figure 68: South America Packaged Vegan Foods Market Volume (K Units), by Country 2024 & 2032
- Figure 69: South America Packaged Vegan Foods Market Revenue Share (%), by Country 2024 & 2032
- Figure 70: South America Packaged Vegan Foods Market Volume Share (%), by Country 2024 & 2032
- Figure 71: Middle East and Africa Packaged Vegan Foods Market Revenue (Million), by Product Type 2024 & 2032
- Figure 72: Middle East and Africa Packaged Vegan Foods Market Volume (K Units), by Product Type 2024 & 2032
- Figure 73: Middle East and Africa Packaged Vegan Foods Market Revenue Share (%), by Product Type 2024 & 2032
- Figure 74: Middle East and Africa Packaged Vegan Foods Market Volume Share (%), by Product Type 2024 & 2032
- Figure 75: Middle East and Africa Packaged Vegan Foods Market Revenue (Million), by Distribution Channel 2024 & 2032
- Figure 76: Middle East and Africa Packaged Vegan Foods Market Volume (K Units), by Distribution Channel 2024 & 2032
- Figure 77: Middle East and Africa Packaged Vegan Foods Market Revenue Share (%), by Distribution Channel 2024 & 2032
- Figure 78: Middle East and Africa Packaged Vegan Foods Market Volume Share (%), by Distribution Channel 2024 & 2032
- Figure 79: Middle East and Africa Packaged Vegan Foods Market Revenue (Million), by Country 2024 & 2032
- Figure 80: Middle East and Africa Packaged Vegan Foods Market Volume (K Units), by Country 2024 & 2032
- Figure 81: Middle East and Africa Packaged Vegan Foods Market Revenue Share (%), by Country 2024 & 2032
- Figure 82: Middle East and Africa Packaged Vegan Foods Market Volume Share (%), by Country 2024 & 2032
List of Tables
- Table 1: Global Packaged Vegan Foods Market Revenue Million Forecast, by Region 2019 & 2032
- Table 2: Global Packaged Vegan Foods Market Volume K Units Forecast, by Region 2019 & 2032
- Table 3: Global Packaged Vegan Foods Market Revenue Million Forecast, by Product Type 2019 & 2032
- Table 4: Global Packaged Vegan Foods Market Volume K Units Forecast, by Product Type 2019 & 2032
- Table 5: Global Packaged Vegan Foods Market Revenue Million Forecast, by Distribution Channel 2019 & 2032
- Table 6: Global Packaged Vegan Foods Market Volume K Units Forecast, by Distribution Channel 2019 & 2032
- Table 7: Global Packaged Vegan Foods Market Revenue Million Forecast, by Region 2019 & 2032
- Table 8: Global Packaged Vegan Foods Market Volume K Units Forecast, by Region 2019 & 2032
- Table 9: Global Packaged Vegan Foods Market Revenue Million Forecast, by Country 2019 & 2032
- Table 10: Global Packaged Vegan Foods Market Volume K Units Forecast, by Country 2019 & 2032
- Table 11: United States Packaged Vegan Foods Market Revenue (Million) Forecast, by Application 2019 & 2032
- Table 12: United States Packaged Vegan Foods Market Volume (K Units) Forecast, by Application 2019 & 2032
- Table 13: Canada Packaged Vegan Foods Market Revenue (Million) Forecast, by Application 2019 & 2032
- Table 14: Canada Packaged Vegan Foods Market Volume (K Units) Forecast, by Application 2019 & 2032
- Table 15: Mexico Packaged Vegan Foods Market Revenue (Million) Forecast, by Application 2019 & 2032
- Table 16: Mexico Packaged Vegan Foods Market Volume (K Units) Forecast, by Application 2019 & 2032
- Table 17: Rest of North America Packaged Vegan Foods Market Revenue (Million) Forecast, by Application 2019 & 2032
- Table 18: Rest of North America Packaged Vegan Foods Market Volume (K Units) Forecast, by Application 2019 & 2032
- Table 19: Global Packaged Vegan Foods Market Revenue Million Forecast, by Country 2019 & 2032
- Table 20: Global Packaged Vegan Foods Market Volume K Units Forecast, by Country 2019 & 2032
- Table 21: Spain Packaged Vegan Foods Market Revenue (Million) Forecast, by Application 2019 & 2032
- Table 22: Spain Packaged Vegan Foods Market Volume (K Units) Forecast, by Application 2019 & 2032
- Table 23: United Kingdom Packaged Vegan Foods Market Revenue (Million) Forecast, by Application 2019 & 2032
- Table 24: United Kingdom Packaged Vegan Foods Market Volume (K Units) Forecast, by Application 2019 & 2032
- Table 25: Germany Packaged Vegan Foods Market Revenue (Million) Forecast, by Application 2019 & 2032
- Table 26: Germany Packaged Vegan Foods Market Volume (K Units) Forecast, by Application 2019 & 2032
- Table 27: France Packaged Vegan Foods Market Revenue (Million) Forecast, by Application 2019 & 2032
- Table 28: France Packaged Vegan Foods Market Volume (K Units) Forecast, by Application 2019 & 2032
- Table 29: Italy Packaged Vegan Foods Market Revenue (Million) Forecast, by Application 2019 & 2032
- Table 30: Italy Packaged Vegan Foods Market Volume (K Units) Forecast, by Application 2019 & 2032
- Table 31: Russia Packaged Vegan Foods Market Revenue (Million) Forecast, by Application 2019 & 2032
- Table 32: Russia Packaged Vegan Foods Market Volume (K Units) Forecast, by Application 2019 & 2032
- Table 33: Rest of Europe Packaged Vegan Foods Market Revenue (Million) Forecast, by Application 2019 & 2032
- Table 34: Rest of Europe Packaged Vegan Foods Market Volume (K Units) Forecast, by Application 2019 & 2032
- Table 35: Global Packaged Vegan Foods Market Revenue Million Forecast, by Country 2019 & 2032
- Table 36: Global Packaged Vegan Foods Market Volume K Units Forecast, by Country 2019 & 2032
- Table 37: China Packaged Vegan Foods Market Revenue (Million) Forecast, by Application 2019 & 2032
- Table 38: China Packaged Vegan Foods Market Volume (K Units) Forecast, by Application 2019 & 2032
- Table 39: Japan Packaged Vegan Foods Market Revenue (Million) Forecast, by Application 2019 & 2032
- Table 40: Japan Packaged Vegan Foods Market Volume (K Units) Forecast, by Application 2019 & 2032
- Table 41: India Packaged Vegan Foods Market Revenue (Million) Forecast, by Application 2019 & 2032
- Table 42: India Packaged Vegan Foods Market Volume (K Units) Forecast, by Application 2019 & 2032
- Table 43: Australia Packaged Vegan Foods Market Revenue (Million) Forecast, by Application 2019 & 2032
- Table 44: Australia Packaged Vegan Foods Market Volume (K Units) Forecast, by Application 2019 & 2032
- Table 45: Rest of Asia Pacific Packaged Vegan Foods Market Revenue (Million) Forecast, by Application 2019 & 2032
- Table 46: Rest of Asia Pacific Packaged Vegan Foods Market Volume (K Units) Forecast, by Application 2019 & 2032
- Table 47: Global Packaged Vegan Foods Market Revenue Million Forecast, by Country 2019 & 2032
- Table 48: Global Packaged Vegan Foods Market Volume K Units Forecast, by Country 2019 & 2032
- Table 49: Brazil Packaged Vegan Foods Market Revenue (Million) Forecast, by Application 2019 & 2032
- Table 50: Brazil Packaged Vegan Foods Market Volume (K Units) Forecast, by Application 2019 & 2032
- Table 51: Argentina Packaged Vegan Foods Market Revenue (Million) Forecast, by Application 2019 & 2032
- Table 52: Argentina Packaged Vegan Foods Market Volume (K Units) Forecast, by Application 2019 & 2032
- Table 53: Rest of South America Packaged Vegan Foods Market Revenue (Million) Forecast, by Application 2019 & 2032
- Table 54: Rest of South America Packaged Vegan Foods Market Volume (K Units) Forecast, by Application 2019 & 2032
- Table 55: Global Packaged Vegan Foods Market Revenue Million Forecast, by Country 2019 & 2032
- Table 56: Global Packaged Vegan Foods Market Volume K Units Forecast, by Country 2019 & 2032
- Table 57: South Africa Packaged Vegan Foods Market Revenue (Million) Forecast, by Application 2019 & 2032
- Table 58: South Africa Packaged Vegan Foods Market Volume (K Units) Forecast, by Application 2019 & 2032
- Table 59: Saudi Arabia Packaged Vegan Foods Market Revenue (Million) Forecast, by Application 2019 & 2032
- Table 60: Saudi Arabia Packaged Vegan Foods Market Volume (K Units) Forecast, by Application 2019 & 2032
- Table 61: Rest of Middle East and Africa Packaged Vegan Foods Market Revenue (Million) Forecast, by Application 2019 & 2032
- Table 62: Rest of Middle East and Africa Packaged Vegan Foods Market Volume (K Units) Forecast, by Application 2019 & 2032
- Table 63: Global Packaged Vegan Foods Market Revenue Million Forecast, by Product Type 2019 & 2032
- Table 64: Global Packaged Vegan Foods Market Volume K Units Forecast, by Product Type 2019 & 2032
- Table 65: Global Packaged Vegan Foods Market Revenue Million Forecast, by Distribution Channel 2019 & 2032
- Table 66: Global Packaged Vegan Foods Market Volume K Units Forecast, by Distribution Channel 2019 & 2032
- Table 67: Global Packaged Vegan Foods Market Revenue Million Forecast, by Country 2019 & 2032
- Table 68: Global Packaged Vegan Foods Market Volume K Units Forecast, by Country 2019 & 2032
- Table 69: United States Packaged Vegan Foods Market Revenue (Million) Forecast, by Application 2019 & 2032
- Table 70: United States Packaged Vegan Foods Market Volume (K Units) Forecast, by Application 2019 & 2032
- Table 71: Canada Packaged Vegan Foods Market Revenue (Million) Forecast, by Application 2019 & 2032
- Table 72: Canada Packaged Vegan Foods Market Volume (K Units) Forecast, by Application 2019 & 2032
- Table 73: Mexico Packaged Vegan Foods Market Revenue (Million) Forecast, by Application 2019 & 2032
- Table 74: Mexico Packaged Vegan Foods Market Volume (K Units) Forecast, by Application 2019 & 2032
- Table 75: Rest of North America Packaged Vegan Foods Market Revenue (Million) Forecast, by Application 2019 & 2032
- Table 76: Rest of North America Packaged Vegan Foods Market Volume (K Units) Forecast, by Application 2019 & 2032
- Table 77: Global Packaged Vegan Foods Market Revenue Million Forecast, by Product Type 2019 & 2032
- Table 78: Global Packaged Vegan Foods Market Volume K Units Forecast, by Product Type 2019 & 2032
- Table 79: Global Packaged Vegan Foods Market Revenue Million Forecast, by Distribution Channel 2019 & 2032
- Table 80: Global Packaged Vegan Foods Market Volume K Units Forecast, by Distribution Channel 2019 & 2032
- Table 81: Global Packaged Vegan Foods Market Revenue Million Forecast, by Country 2019 & 2032
- Table 82: Global Packaged Vegan Foods Market Volume K Units Forecast, by Country 2019 & 2032
- Table 83: Spain Packaged Vegan Foods Market Revenue (Million) Forecast, by Application 2019 & 2032
- Table 84: Spain Packaged Vegan Foods Market Volume (K Units) Forecast, by Application 2019 & 2032
- Table 85: United Kingdom Packaged Vegan Foods Market Revenue (Million) Forecast, by Application 2019 & 2032
- Table 86: United Kingdom Packaged Vegan Foods Market Volume (K Units) Forecast, by Application 2019 & 2032
- Table 87: Germany Packaged Vegan Foods Market Revenue (Million) Forecast, by Application 2019 & 2032
- Table 88: Germany Packaged Vegan Foods Market Volume (K Units) Forecast, by Application 2019 & 2032
- Table 89: France Packaged Vegan Foods Market Revenue (Million) Forecast, by Application 2019 & 2032
- Table 90: France Packaged Vegan Foods Market Volume (K Units) Forecast, by Application 2019 & 2032
- Table 91: Italy Packaged Vegan Foods Market Revenue (Million) Forecast, by Application 2019 & 2032
- Table 92: Italy Packaged Vegan Foods Market Volume (K Units) Forecast, by Application 2019 & 2032
- Table 93: Russia Packaged Vegan Foods Market Revenue (Million) Forecast, by Application 2019 & 2032
- Table 94: Russia Packaged Vegan Foods Market Volume (K Units) Forecast, by Application 2019 & 2032
- Table 95: Rest of Europe Packaged Vegan Foods Market Revenue (Million) Forecast, by Application 2019 & 2032
- Table 96: Rest of Europe Packaged Vegan Foods Market Volume (K Units) Forecast, by Application 2019 & 2032
- Table 97: Global Packaged Vegan Foods Market Revenue Million Forecast, by Product Type 2019 & 2032
- Table 98: Global Packaged Vegan Foods Market Volume K Units Forecast, by Product Type 2019 & 2032
- Table 99: Global Packaged Vegan Foods Market Revenue Million Forecast, by Distribution Channel 2019 & 2032
- Table 100: Global Packaged Vegan Foods Market Volume K Units Forecast, by Distribution Channel 2019 & 2032
- Table 101: Global Packaged Vegan Foods Market Revenue Million Forecast, by Country 2019 & 2032
- Table 102: Global Packaged Vegan Foods Market Volume K Units Forecast, by Country 2019 & 2032
- Table 103: China Packaged Vegan Foods Market Revenue (Million) Forecast, by Application 2019 & 2032
- Table 104: China Packaged Vegan Foods Market Volume (K Units) Forecast, by Application 2019 & 2032
- Table 105: Japan Packaged Vegan Foods Market Revenue (Million) Forecast, by Application 2019 & 2032
- Table 106: Japan Packaged Vegan Foods Market Volume (K Units) Forecast, by Application 2019 & 2032
- Table 107: India Packaged Vegan Foods Market Revenue (Million) Forecast, by Application 2019 & 2032
- Table 108: India Packaged Vegan Foods Market Volume (K Units) Forecast, by Application 2019 & 2032
- Table 109: Australia Packaged Vegan Foods Market Revenue (Million) Forecast, by Application 2019 & 2032
- Table 110: Australia Packaged Vegan Foods Market Volume (K Units) Forecast, by Application 2019 & 2032
- Table 111: Rest of Asia Pacific Packaged Vegan Foods Market Revenue (Million) Forecast, by Application 2019 & 2032
- Table 112: Rest of Asia Pacific Packaged Vegan Foods Market Volume (K Units) Forecast, by Application 2019 & 2032
- Table 113: Global Packaged Vegan Foods Market Revenue Million Forecast, by Product Type 2019 & 2032
- Table 114: Global Packaged Vegan Foods Market Volume K Units Forecast, by Product Type 2019 & 2032
- Table 115: Global Packaged Vegan Foods Market Revenue Million Forecast, by Distribution Channel 2019 & 2032
- Table 116: Global Packaged Vegan Foods Market Volume K Units Forecast, by Distribution Channel 2019 & 2032
- Table 117: Global Packaged Vegan Foods Market Revenue Million Forecast, by Country 2019 & 2032
- Table 118: Global Packaged Vegan Foods Market Volume K Units Forecast, by Country 2019 & 2032
- Table 119: Brazil Packaged Vegan Foods Market Revenue (Million) Forecast, by Application 2019 & 2032
- Table 120: Brazil Packaged Vegan Foods Market Volume (K Units) Forecast, by Application 2019 & 2032
- Table 121: Argentina Packaged Vegan Foods Market Revenue (Million) Forecast, by Application 2019 & 2032
- Table 122: Argentina Packaged Vegan Foods Market Volume (K Units) Forecast, by Application 2019 & 2032
- Table 123: Rest of South America Packaged Vegan Foods Market Revenue (Million) Forecast, by Application 2019 & 2032
- Table 124: Rest of South America Packaged Vegan Foods Market Volume (K Units) Forecast, by Application 2019 & 2032
- Table 125: Global Packaged Vegan Foods Market Revenue Million Forecast, by Product Type 2019 & 2032
- Table 126: Global Packaged Vegan Foods Market Volume K Units Forecast, by Product Type 2019 & 2032
- Table 127: Global Packaged Vegan Foods Market Revenue Million Forecast, by Distribution Channel 2019 & 2032
- Table 128: Global Packaged Vegan Foods Market Volume K Units Forecast, by Distribution Channel 2019 & 2032
- Table 129: Global Packaged Vegan Foods Market Revenue Million Forecast, by Country 2019 & 2032
- Table 130: Global Packaged Vegan Foods Market Volume K Units Forecast, by Country 2019 & 2032
- Table 131: South Africa Packaged Vegan Foods Market Revenue (Million) Forecast, by Application 2019 & 2032
- Table 132: South Africa Packaged Vegan Foods Market Volume (K Units) Forecast, by Application 2019 & 2032
- Table 133: Saudi Arabia Packaged Vegan Foods Market Revenue (Million) Forecast, by Application 2019 & 2032
- Table 134: Saudi Arabia Packaged Vegan Foods Market Volume (K Units) Forecast, by Application 2019 & 2032
- Table 135: Rest of Middle East and Africa Packaged Vegan Foods Market Revenue (Million) Forecast, by Application 2019 & 2032
- Table 136: Rest of Middle East and Africa Packaged Vegan Foods Market Volume (K Units) Forecast, by Application 2019 & 2032
Frequently Asked Questions
1. What is the projected Compound Annual Growth Rate (CAGR) of the Packaged Vegan Foods Market?
The projected CAGR is approximately 9.74%.
2. Which companies are prominent players in the Packaged Vegan Foods Market?
Key companies in the market include Edward & Sons Trading Co, Louisville Vegan Jerky Co, Tofutti Brands Inc, Barbara's, Dr McDougall's Right Foods*List Not Exhaustive, Follow Your Heart, Danone S A, Annie's Homegrown Inc, Beyond Meat, Amy's Kitchen Inc.
3. What are the main segments of the Packaged Vegan Foods Market?
The market segments include Product Type, Distribution Channel.
4. Can you provide details about the market size?
The market size is estimated to be USD 39058.3 Million as of 2022.
5. What are some drivers contributing to market growth?
Growing Demand for Nutricosmetics Among Millennials; Growing Beauty and Wellness Trend.
6. What are the notable trends driving market growth?
Plant-based Meat Substitutes are Gaining Significance.
7. Are there any restraints impacting market growth?
Stringent Government Regulations and Product Guidelines.
8. Can you provide examples of recent developments in the market?
N/A
9. What pricing options are available for accessing the report?
Pricing options include single-user, multi-user, and enterprise licenses priced at USD 4750, USD 5250, and USD 8750 respectively.
10. Is the market size provided in terms of value or volume?
The market size is provided in terms of value, measured in Million and volume, measured in K Units.
11. Are there any specific market keywords associated with the report?
Yes, the market keyword associated with the report is "Packaged Vegan Foods Market," which aids in identifying and referencing the specific market segment covered.
12. How do I determine which pricing option suits my needs best?
The pricing options vary based on user requirements and access needs. Individual users may opt for single-user licenses, while businesses requiring broader access may choose multi-user or enterprise licenses for cost-effective access to the report.
13. Are there any additional resources or data provided in the Packaged Vegan Foods Market report?
While the report offers comprehensive insights, it's advisable to review the specific contents or supplementary materials provided to ascertain if additional resources or data are available.
14. How can I stay updated on further developments or reports in the Packaged Vegan Foods Market?
To stay informed about further developments, trends, and reports in the Packaged Vegan Foods Market, consider subscribing to industry newsletters, following relevant companies and organizations, or regularly checking reputable industry news sources and publications.
Methodology
Step 1 - Identification of Relevant Samples Size from Population Database


Step 2 - Approaches for Defining Global Market Size (Value, Volume* & Price*)

Note*: In applicable scenarios
Step 3 - Data Sources
Primary Research
- Web Analytics
- Survey Reports
- Research Institute
- Latest Research Reports
- Opinion Leaders
Secondary Research
- Annual Reports
- White Paper
- Latest Press Release
- Industry Association
- Paid Database
- Investor Presentations

Step 4 - Data Triangulation
Involves using different sources of information in order to increase the validity of a study
These sources are likely to be stakeholders in a program - participants, other researchers, program staff, other community members, and so on.
Then we put all data in single framework & apply various statistical tools to find out the dynamic on the market.
During the analysis stage, feedback from the stakeholder groups would be compared to determine areas of agreement as well as areas of divergence


