
Key Insights
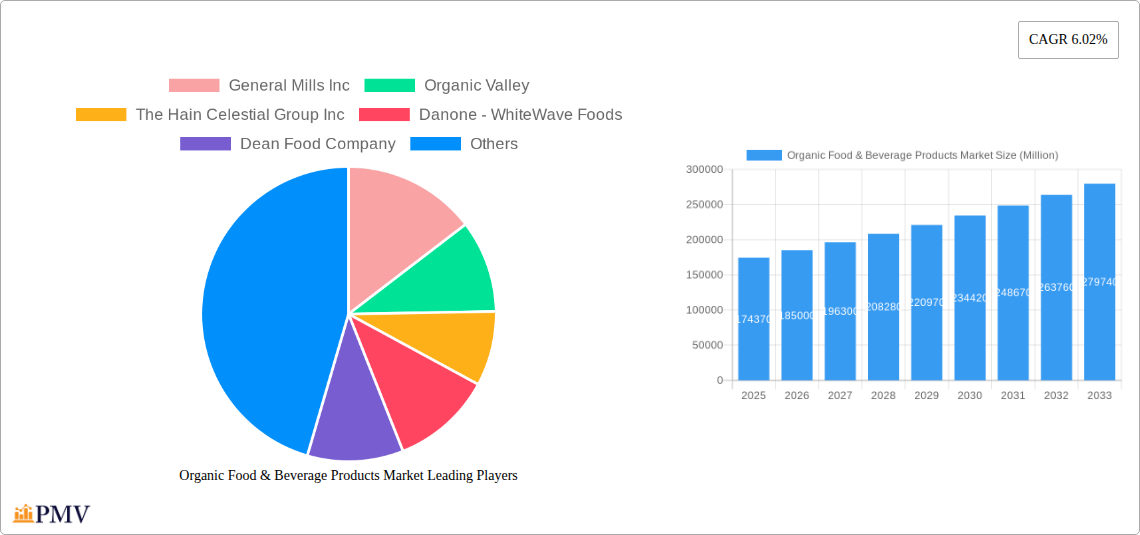
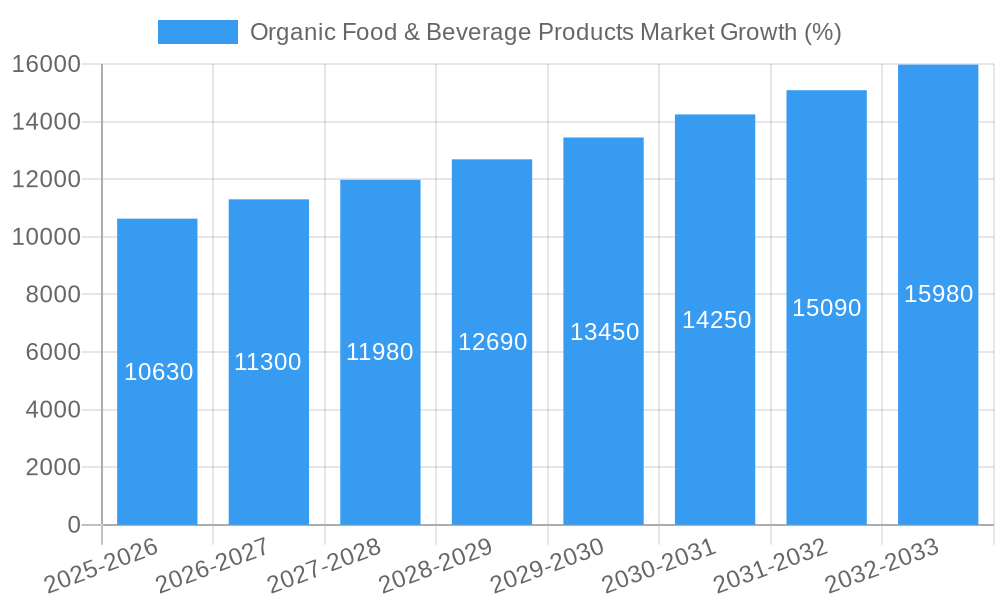
The global organic food and beverage market, valued at $174.37 billion in 2025, is projected to experience robust growth, driven by increasing consumer awareness of health and wellness, a rising preference for natural and sustainable products, and stricter regulations promoting organic farming practices. The market's Compound Annual Growth Rate (CAGR) of 6.02% from 2025 to 2033 signifies a substantial expansion, with significant contributions from various product segments and distribution channels. Organic beverages, including juices, teas, and dairy alternatives, are anticipated to witness particularly strong growth, mirroring the broader trend towards healthier beverage options. Supermarkets and hypermarkets remain the dominant distribution channel, but online stores are rapidly gaining traction, fueled by e-commerce expansion and convenient home delivery options. Key players such as General Mills, Organic Valley, and Hain Celestial are actively investing in product innovation and expansion into new markets to capitalize on this growth trajectory. Geographic expansion is also expected, with Asia Pacific and South America presenting significant growth opportunities due to increasing disposable incomes and evolving consumer preferences. However, factors such as higher production costs compared to conventional foods and potential supply chain challenges could act as restraints on market growth.
The competitive landscape is characterized by both large multinational corporations and smaller, specialized organic food producers. Successful companies are focusing on building strong brands associated with quality, transparency, and ethical sourcing. Furthermore, collaborations and mergers and acquisitions are common strategies employed to expand market reach and product portfolios. The market's future success hinges on continuous innovation in product development, sustainable farming practices, and robust supply chains that can meet the escalating demand for organic food and beverages globally. Further research into specific regional nuances and consumer preferences will provide crucial insights for companies looking to invest and gain market share in this dynamic sector.
Organic Food & Beverage Products Market: A Comprehensive Report (2019-2033)
This detailed report provides a comprehensive analysis of the global Organic Food & Beverage Products Market, offering invaluable insights for businesses, investors, and stakeholders. Covering the period 2019-2033, with a focus on 2025, this report analyzes market size, growth drivers, competitive dynamics, and future trends. The study period is 2019–2033, the base year is 2025, the estimated year is 2025, and the forecast period is 2025–2033, with the historical period covering 2019–2024.
Organic Food & Beverage Products Market Market Structure & Competitive Dynamics
This section delves into the competitive landscape of the organic food and beverage market, examining market concentration, innovation, regulatory frameworks, product substitutes, end-user trends, and mergers and acquisitions (M&A) activities. The market is characterized by a mix of large multinational corporations and smaller, specialized producers. Market share is highly dynamic, with leading players constantly vying for position through product innovation and strategic acquisitions.
The regulatory landscape plays a significant role, influencing production standards and consumer trust. The increasing demand for organic products has led to the emergence of numerous substitutes, both organic and conventional. Understanding end-user trends, particularly the growing preference for healthy and sustainable food options, is crucial for success in this market. M&A activity is significant, with larger companies acquiring smaller organic food producers to expand their product portfolios and market share. For example, Danone's acquisition of Happy Family in 2022 demonstrates this trend. The total value of M&A deals in the organic food and beverage sector in 2024 reached approximately xx Million. Key metrics such as market share for top players are included in detailed tables and charts within the full report.
- Market Concentration: Moderately concentrated with a few dominant players and a large number of smaller niche players.
- Innovation Ecosystems: Active with continuous development of new organic products and processing technologies.
- Regulatory Frameworks: Stringent regulations on organic certification and labeling vary by region.
- Product Substitutes: Conventional food and beverages, as well as other health-conscious options.
- End-User Trends: Increasing demand for healthier, sustainable, and ethically sourced food and beverages.
- M&A Activity: Significant activity driven by expansion strategies and market consolidation.
Organic Food & Beverage Products Market Industry Trends & Insights
The organic food and beverage market exhibits strong growth, driven by several key factors. Increasing consumer awareness of health and wellness, coupled with growing concerns about the environmental impact of conventional agriculture, fuels demand. The market has witnessed significant technological advancements, including improved farming techniques and processing methods, leading to higher yields and enhanced product quality. Consumer preferences are shifting towards natural, minimally processed products, impacting the demand for organic options. This growth is further amplified by favorable government policies promoting organic farming and consumption. The market is witnessing a substantial shift in consumer preference, with higher penetration rates among millennials and Gen Z. The CAGR for the forecast period (2025-2033) is estimated to be xx%. Market penetration for organic products varies across regions, with mature markets showing higher penetration rates than emerging markets. Competitive dynamics are intense, with both established and emerging players vying for market share through innovation, marketing, and distribution strategies.
Dominant Markets & Segments in Organic Food & Beverage Products Market
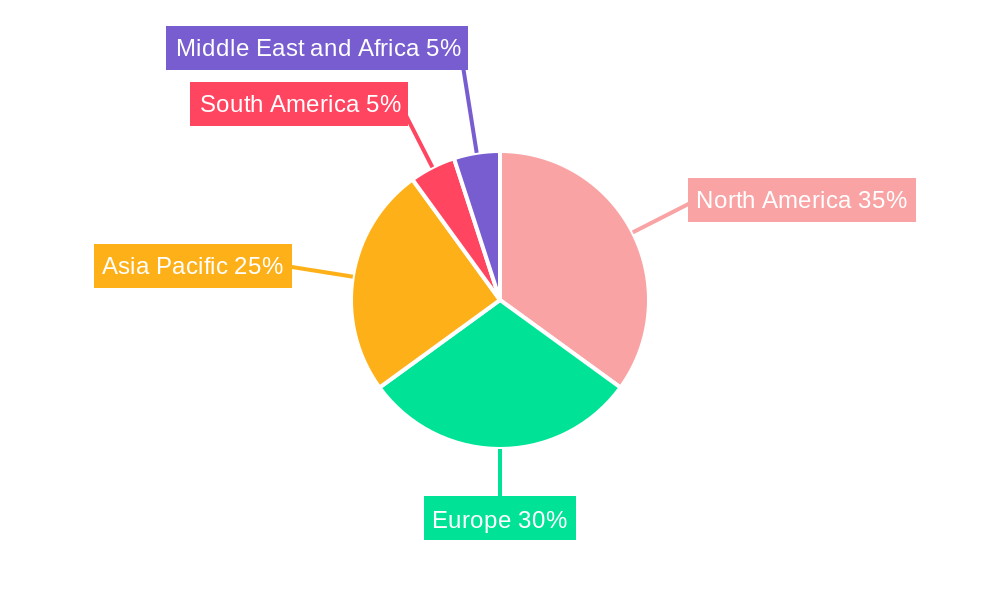
The organic food and beverage market displays regional variations in growth and dominance. North America and Europe currently hold significant market shares due to high consumer awareness and established organic farming practices. However, Asia-Pacific is anticipated to experience substantial growth due to increasing disposable incomes and rising health consciousness among consumers. Within the product type segment, organic foods currently dominate, but the organic beverages segment shows robust growth potential.
By Product Type:
- Organic Foods: This segment holds the largest market share due to broad consumer appeal and diverse product offerings. Key drivers include growing health concerns, rising disposable incomes, and increased awareness of the benefits of organic foods.
- Organic Beverages: This segment is experiencing faster growth compared to organic foods due to increasing demand for healthier alternatives to sugary drinks and growing consumer preference for functional beverages.
By Distribution Channel:
- Supermarkets/Hypermarkets: This channel dominates due to widespread accessibility and established distribution networks. Key drivers include the increasing availability of organic products in mainstream retail stores and the growing popularity of organic private labels.
- Specialty Stores: These stores cater to a niche market seeking high-quality organic products. Key drivers include specialized product offerings, strong brand reputation, and a highly engaged customer base.
- Online Stores: This channel is experiencing rapid growth due to increasing internet penetration, consumer convenience, and the ability to reach wider customer bases. Key drivers include ease of access, wider product selection, and targeted marketing campaigns.
Organic Food & Beverage Products Market Product Innovations
Product innovation is a crucial driver of growth in the organic food and beverage market. Companies are focusing on developing novel products that cater to specific dietary needs and preferences, such as gluten-free, vegan, and keto-friendly options. Technological advancements in food processing and packaging are enhancing product quality, shelf life, and sustainability. Companies are also leveraging innovative marketing and branding strategies to highlight the health benefits and sustainability aspects of their products. The market is seeing an influx of new products targeting niche consumer segments and preferences, ensuring continued market growth and differentiation.
Report Segmentation & Scope
This report segments the organic food and beverage market by product type (Organic Foods and Organic Beverages) and distribution channel (Supermarkets/Hypermarkets, Convenience Stores, Specialty Stores, Online Stores, and Other Distribution Channels). Each segment's market size, growth projections, and competitive dynamics are comprehensively analyzed. The report also explores regional variations and identifies key players within each segment. For instance, the organic food segment is further categorized by product type (fruits and vegetables, dairy, grains, and others) while the organic beverages segment encompasses categories such as juices, milk, and others. Similarly, each distribution channel's characteristics, growth trends, and key players are extensively analyzed.
Key Drivers of Organic Food & Beverage Products Market Growth
Several factors contribute to the growth of the organic food and beverage market. Rising consumer awareness of health and wellness is a primary driver, with consumers increasingly seeking nutritious and sustainably produced food. Government regulations and incentives promoting organic farming have also stimulated market growth. Technological advancements in agricultural practices and processing techniques are enhancing efficiency and sustainability, leading to higher yields and lower costs. The increasing availability of organic products across various distribution channels also contributes significantly.
Challenges in the Organic Food & Beverage Products Market Sector
Despite the growth potential, the organic food and beverage market faces challenges. Maintaining consistent supply chains for organic produce can be difficult, particularly in the face of fluctuating weather patterns. The higher cost of organic products compared to conventional alternatives can limit market penetration, especially in price-sensitive markets. Strict regulations and certification standards can increase production costs for organic food producers.
Leading Players in the Organic Food & Beverage Products Market Market
- General Mills Inc
- Organic Valley
- The Hain Celestial Group Inc
- Danone - WhiteWave Foods
- Dean Food Company
- Belvoir Fruit Farms Ltd
- Amy's Kitchen Inc
- ConAgra Brands*List Not Exhaustive
- United Natural Foods Inc
- Horizon Organic
Key Developments in Organic Food & Beverage Products Market Sector
- August 2022: Danone acquired Happy Family, a significant player in the organic baby food market. This acquisition significantly bolstered Danone's presence in the organic food sector.
- July 2022: Grain Forests launched new organic products targeting various health segments, reflecting innovation and market expansion efforts.
- February 2021: Danone's acquisition of Your Heart, a plant-based food company, showcased the strategic importance of expanding into diverse organic product categories to meet consumer demand.
Strategic Organic Food & Beverage Products Market Market Outlook
The organic food and beverage market presents significant opportunities for growth and innovation. Expanding into emerging markets, particularly in Asia-Pacific, offers considerable potential. Focusing on product diversification, sustainability, and ethical sourcing will be crucial for achieving long-term success. Companies that can effectively leverage technological advancements and cater to evolving consumer preferences will gain a competitive advantage. The market is poised for continued expansion driven by a growing preference for health-conscious and sustainably-produced food.
Organic Food & Beverage Products Market Segmentation
-
1. Product Type
-
1.1. Organic Foods
- 1.1.1. Organic Fruit & Vegetables
- 1.1.2. Organic Meat, Fish & Poultry
- 1.1.3. Organic Dairy Products
- 1.1.4. Organic Frozen & Processed Foods
- 1.1.5. Other Organic Foods
-
1.2. Organic Beverages
- 1.2.1. Fruit and Vegetable Juices
- 1.2.2. Coffee
- 1.2.3. Tea
- 1.2.4. Other Organic Beverages
-
1.1. Organic Foods
-
2. Distribution Channel
- 2.1. Supermarkets/Hypermarkets
- 2.2. Convenience Stores
- 2.3. Specialty Stores
- 2.4. Online Stores
- 2.5. Other Distribution Channels
Organic Food & Beverage Products Market Segmentation By Geography
-
1. North America
- 1.1. United States
- 1.2. Canada
- 1.3. Mexico
- 1.4. Rest of North America
-
2. Europe
- 2.1. United Kingdom
- 2.2. Germany
- 2.3. France
- 2.4. Russia
- 2.5. Italy
- 2.6. Spain
- 2.7. Rest of Europe
-
3. Asia Pacific
- 3.1. India
- 3.2. China
- 3.3. Japan
- 3.4. Australia
- 3.5. Rest of Asia Pacific
-
4. South America
- 4.1. Brazil
- 4.2. Argentina
- 4.3. Rest of South America
-
5. Middle East and Africa
- 5.1. South Africa
- 5.2. Saudi Arabia
- 5.3. Rest of Middle East and Africa
Organic Food & Beverage Products Market REPORT HIGHLIGHTS
| Aspects | Details |
|---|---|
| Study Period | 2019-2033 |
| Base Year | 2024 |
| Estimated Year | 2025 |
| Forecast Period | 2025-2033 |
| Historical Period | 2019-2024 |
| Growth Rate | CAGR of 6.02% from 2019-2033 |
| Segmentation |
|
Table of Contents
- 1. Introduction
- 1.1. Research Scope
- 1.2. Market Segmentation
- 1.3. Research Methodology
- 1.4. Definitions and Assumptions
- 2. Executive Summary
- 2.1. Introduction
- 3. Market Dynamics
- 3.1. Introduction
- 3.2. Market Drivers
- 3.2.1. Growing Demand for Nutricosmetics Among Millennials; Growing Beauty and Wellness Trend
- 3.3. Market Restrains
- 3.3.1. Stringent Government Regulations and Product Guidelines
- 3.4. Market Trends
- 3.4.1. Increasing Demand for Clean Label Products
- 4. Market Factor Analysis
- 4.1. Porters Five Forces
- 4.2. Supply/Value Chain
- 4.3. PESTEL analysis
- 4.4. Market Entropy
- 4.5. Patent/Trademark Analysis
- 5. Global Organic Food & Beverage Products Market Analysis, Insights and Forecast, 2019-2031
- 5.1. Market Analysis, Insights and Forecast - by Product Type
- 5.1.1. Organic Foods
- 5.1.1.1. Organic Fruit & Vegetables
- 5.1.1.2. Organic Meat, Fish & Poultry
- 5.1.1.3. Organic Dairy Products
- 5.1.1.4. Organic Frozen & Processed Foods
- 5.1.1.5. Other Organic Foods
- 5.1.2. Organic Beverages
- 5.1.2.1. Fruit and Vegetable Juices
- 5.1.2.2. Coffee
- 5.1.2.3. Tea
- 5.1.2.4. Other Organic Beverages
- 5.1.1. Organic Foods
- 5.2. Market Analysis, Insights and Forecast - by Distribution Channel
- 5.2.1. Supermarkets/Hypermarkets
- 5.2.2. Convenience Stores
- 5.2.3. Specialty Stores
- 5.2.4. Online Stores
- 5.2.5. Other Distribution Channels
- 5.3. Market Analysis, Insights and Forecast - by Region
- 5.3.1. North America
- 5.3.2. Europe
- 5.3.3. Asia Pacific
- 5.3.4. South America
- 5.3.5. Middle East and Africa
- 5.1. Market Analysis, Insights and Forecast - by Product Type
- 6. North America Organic Food & Beverage Products Market Analysis, Insights and Forecast, 2019-2031
- 6.1. Market Analysis, Insights and Forecast - by Product Type
- 6.1.1. Organic Foods
- 6.1.1.1. Organic Fruit & Vegetables
- 6.1.1.2. Organic Meat, Fish & Poultry
- 6.1.1.3. Organic Dairy Products
- 6.1.1.4. Organic Frozen & Processed Foods
- 6.1.1.5. Other Organic Foods
- 6.1.2. Organic Beverages
- 6.1.2.1. Fruit and Vegetable Juices
- 6.1.2.2. Coffee
- 6.1.2.3. Tea
- 6.1.2.4. Other Organic Beverages
- 6.1.1. Organic Foods
- 6.2. Market Analysis, Insights and Forecast - by Distribution Channel
- 6.2.1. Supermarkets/Hypermarkets
- 6.2.2. Convenience Stores
- 6.2.3. Specialty Stores
- 6.2.4. Online Stores
- 6.2.5. Other Distribution Channels
- 6.1. Market Analysis, Insights and Forecast - by Product Type
- 7. Europe Organic Food & Beverage Products Market Analysis, Insights and Forecast, 2019-2031
- 7.1. Market Analysis, Insights and Forecast - by Product Type
- 7.1.1. Organic Foods
- 7.1.1.1. Organic Fruit & Vegetables
- 7.1.1.2. Organic Meat, Fish & Poultry
- 7.1.1.3. Organic Dairy Products
- 7.1.1.4. Organic Frozen & Processed Foods
- 7.1.1.5. Other Organic Foods
- 7.1.2. Organic Beverages
- 7.1.2.1. Fruit and Vegetable Juices
- 7.1.2.2. Coffee
- 7.1.2.3. Tea
- 7.1.2.4. Other Organic Beverages
- 7.1.1. Organic Foods
- 7.2. Market Analysis, Insights and Forecast - by Distribution Channel
- 7.2.1. Supermarkets/Hypermarkets
- 7.2.2. Convenience Stores
- 7.2.3. Specialty Stores
- 7.2.4. Online Stores
- 7.2.5. Other Distribution Channels
- 7.1. Market Analysis, Insights and Forecast - by Product Type
- 8. Asia Pacific Organic Food & Beverage Products Market Analysis, Insights and Forecast, 2019-2031
- 8.1. Market Analysis, Insights and Forecast - by Product Type
- 8.1.1. Organic Foods
- 8.1.1.1. Organic Fruit & Vegetables
- 8.1.1.2. Organic Meat, Fish & Poultry
- 8.1.1.3. Organic Dairy Products
- 8.1.1.4. Organic Frozen & Processed Foods
- 8.1.1.5. Other Organic Foods
- 8.1.2. Organic Beverages
- 8.1.2.1. Fruit and Vegetable Juices
- 8.1.2.2. Coffee
- 8.1.2.3. Tea
- 8.1.2.4. Other Organic Beverages
- 8.1.1. Organic Foods
- 8.2. Market Analysis, Insights and Forecast - by Distribution Channel
- 8.2.1. Supermarkets/Hypermarkets
- 8.2.2. Convenience Stores
- 8.2.3. Specialty Stores
- 8.2.4. Online Stores
- 8.2.5. Other Distribution Channels
- 8.1. Market Analysis, Insights and Forecast - by Product Type
- 9. South America Organic Food & Beverage Products Market Analysis, Insights and Forecast, 2019-2031
- 9.1. Market Analysis, Insights and Forecast - by Product Type
- 9.1.1. Organic Foods
- 9.1.1.1. Organic Fruit & Vegetables
- 9.1.1.2. Organic Meat, Fish & Poultry
- 9.1.1.3. Organic Dairy Products
- 9.1.1.4. Organic Frozen & Processed Foods
- 9.1.1.5. Other Organic Foods
- 9.1.2. Organic Beverages
- 9.1.2.1. Fruit and Vegetable Juices
- 9.1.2.2. Coffee
- 9.1.2.3. Tea
- 9.1.2.4. Other Organic Beverages
- 9.1.1. Organic Foods
- 9.2. Market Analysis, Insights and Forecast - by Distribution Channel
- 9.2.1. Supermarkets/Hypermarkets
- 9.2.2. Convenience Stores
- 9.2.3. Specialty Stores
- 9.2.4. Online Stores
- 9.2.5. Other Distribution Channels
- 9.1. Market Analysis, Insights and Forecast - by Product Type
- 10. Middle East and Africa Organic Food & Beverage Products Market Analysis, Insights and Forecast, 2019-2031
- 10.1. Market Analysis, Insights and Forecast - by Product Type
- 10.1.1. Organic Foods
- 10.1.1.1. Organic Fruit & Vegetables
- 10.1.1.2. Organic Meat, Fish & Poultry
- 10.1.1.3. Organic Dairy Products
- 10.1.1.4. Organic Frozen & Processed Foods
- 10.1.1.5. Other Organic Foods
- 10.1.2. Organic Beverages
- 10.1.2.1. Fruit and Vegetable Juices
- 10.1.2.2. Coffee
- 10.1.2.3. Tea
- 10.1.2.4. Other Organic Beverages
- 10.1.1. Organic Foods
- 10.2. Market Analysis, Insights and Forecast - by Distribution Channel
- 10.2.1. Supermarkets/Hypermarkets
- 10.2.2. Convenience Stores
- 10.2.3. Specialty Stores
- 10.2.4. Online Stores
- 10.2.5. Other Distribution Channels
- 10.1. Market Analysis, Insights and Forecast - by Product Type
- 11. North America Organic Food & Beverage Products Market Analysis, Insights and Forecast, 2019-2031
- 11.1. Market Analysis, Insights and Forecast - By Country/Sub-region
- 11.1.1 United States
- 11.1.2 Canada
- 11.1.3 Mexico
- 11.1.4 Rest of North America
- 12. Europe Organic Food & Beverage Products Market Analysis, Insights and Forecast, 2019-2031
- 12.1. Market Analysis, Insights and Forecast - By Country/Sub-region
- 12.1.1 United Kingdom
- 12.1.2 Germany
- 12.1.3 France
- 12.1.4 Russia
- 12.1.5 Italy
- 12.1.6 Spain
- 12.1.7 Rest of Europe
- 13. Asia Pacific Organic Food & Beverage Products Market Analysis, Insights and Forecast, 2019-2031
- 13.1. Market Analysis, Insights and Forecast - By Country/Sub-region
- 13.1.1 India
- 13.1.2 China
- 13.1.3 Japan
- 13.1.4 Australia
- 13.1.5 Rest of Asia Pacific
- 14. South America Organic Food & Beverage Products Market Analysis, Insights and Forecast, 2019-2031
- 14.1. Market Analysis, Insights and Forecast - By Country/Sub-region
- 14.1.1 Brazil
- 14.1.2 Argentina
- 14.1.3 Rest of South America
- 15. Middle East and Africa Organic Food & Beverage Products Market Analysis, Insights and Forecast, 2019-2031
- 15.1. Market Analysis, Insights and Forecast - By Country/Sub-region
- 15.1.1 South Africa
- 15.1.2 Saudi Arabia
- 15.1.3 Rest of Middle East and Africa
- 16. Competitive Analysis
- 16.1. Global Market Share Analysis 2024
- 16.2. Company Profiles
- 16.2.1 General Mills Inc
- 16.2.1.1. Overview
- 16.2.1.2. Products
- 16.2.1.3. SWOT Analysis
- 16.2.1.4. Recent Developments
- 16.2.1.5. Financials (Based on Availability)
- 16.2.2 Organic Valley
- 16.2.2.1. Overview
- 16.2.2.2. Products
- 16.2.2.3. SWOT Analysis
- 16.2.2.4. Recent Developments
- 16.2.2.5. Financials (Based on Availability)
- 16.2.3 The Hain Celestial Group Inc
- 16.2.3.1. Overview
- 16.2.3.2. Products
- 16.2.3.3. SWOT Analysis
- 16.2.3.4. Recent Developments
- 16.2.3.5. Financials (Based on Availability)
- 16.2.4 Danone - WhiteWave Foods
- 16.2.4.1. Overview
- 16.2.4.2. Products
- 16.2.4.3. SWOT Analysis
- 16.2.4.4. Recent Developments
- 16.2.4.5. Financials (Based on Availability)
- 16.2.5 Dean Food Company
- 16.2.5.1. Overview
- 16.2.5.2. Products
- 16.2.5.3. SWOT Analysis
- 16.2.5.4. Recent Developments
- 16.2.5.5. Financials (Based on Availability)
- 16.2.6 Belvoir Fruit Farms Ltd
- 16.2.6.1. Overview
- 16.2.6.2. Products
- 16.2.6.3. SWOT Analysis
- 16.2.6.4. Recent Developments
- 16.2.6.5. Financials (Based on Availability)
- 16.2.7 Amy's Kitchen Inc
- 16.2.7.1. Overview
- 16.2.7.2. Products
- 16.2.7.3. SWOT Analysis
- 16.2.7.4. Recent Developments
- 16.2.7.5. Financials (Based on Availability)
- 16.2.8 ConAgra Brand*List Not Exhaustive
- 16.2.8.1. Overview
- 16.2.8.2. Products
- 16.2.8.3. SWOT Analysis
- 16.2.8.4. Recent Developments
- 16.2.8.5. Financials (Based on Availability)
- 16.2.9 United Natural Foods Inc
- 16.2.9.1. Overview
- 16.2.9.2. Products
- 16.2.9.3. SWOT Analysis
- 16.2.9.4. Recent Developments
- 16.2.9.5. Financials (Based on Availability)
- 16.2.10 Horizon Organic
- 16.2.10.1. Overview
- 16.2.10.2. Products
- 16.2.10.3. SWOT Analysis
- 16.2.10.4. Recent Developments
- 16.2.10.5. Financials (Based on Availability)
- 16.2.1 General Mills Inc
List of Figures
- Figure 1: Global Organic Food & Beverage Products Market Revenue Breakdown (Million, %) by Region 2024 & 2032
- Figure 2: Global Organic Food & Beverage Products Market Volume Breakdown (K Units, %) by Region 2024 & 2032
- Figure 3: North America Organic Food & Beverage Products Market Revenue (Million), by Country 2024 & 2032
- Figure 4: North America Organic Food & Beverage Products Market Volume (K Units), by Country 2024 & 2032
- Figure 5: North America Organic Food & Beverage Products Market Revenue Share (%), by Country 2024 & 2032
- Figure 6: North America Organic Food & Beverage Products Market Volume Share (%), by Country 2024 & 2032
- Figure 7: Europe Organic Food & Beverage Products Market Revenue (Million), by Country 2024 & 2032
- Figure 8: Europe Organic Food & Beverage Products Market Volume (K Units), by Country 2024 & 2032
- Figure 9: Europe Organic Food & Beverage Products Market Revenue Share (%), by Country 2024 & 2032
- Figure 10: Europe Organic Food & Beverage Products Market Volume Share (%), by Country 2024 & 2032
- Figure 11: Asia Pacific Organic Food & Beverage Products Market Revenue (Million), by Country 2024 & 2032
- Figure 12: Asia Pacific Organic Food & Beverage Products Market Volume (K Units), by Country 2024 & 2032
- Figure 13: Asia Pacific Organic Food & Beverage Products Market Revenue Share (%), by Country 2024 & 2032
- Figure 14: Asia Pacific Organic Food & Beverage Products Market Volume Share (%), by Country 2024 & 2032
- Figure 15: South America Organic Food & Beverage Products Market Revenue (Million), by Country 2024 & 2032
- Figure 16: South America Organic Food & Beverage Products Market Volume (K Units), by Country 2024 & 2032
- Figure 17: South America Organic Food & Beverage Products Market Revenue Share (%), by Country 2024 & 2032
- Figure 18: South America Organic Food & Beverage Products Market Volume Share (%), by Country 2024 & 2032
- Figure 19: Middle East and Africa Organic Food & Beverage Products Market Revenue (Million), by Country 2024 & 2032
- Figure 20: Middle East and Africa Organic Food & Beverage Products Market Volume (K Units), by Country 2024 & 2032
- Figure 21: Middle East and Africa Organic Food & Beverage Products Market Revenue Share (%), by Country 2024 & 2032
- Figure 22: Middle East and Africa Organic Food & Beverage Products Market Volume Share (%), by Country 2024 & 2032
- Figure 23: North America Organic Food & Beverage Products Market Revenue (Million), by Product Type 2024 & 2032
- Figure 24: North America Organic Food & Beverage Products Market Volume (K Units), by Product Type 2024 & 2032
- Figure 25: North America Organic Food & Beverage Products Market Revenue Share (%), by Product Type 2024 & 2032
- Figure 26: North America Organic Food & Beverage Products Market Volume Share (%), by Product Type 2024 & 2032
- Figure 27: North America Organic Food & Beverage Products Market Revenue (Million), by Distribution Channel 2024 & 2032
- Figure 28: North America Organic Food & Beverage Products Market Volume (K Units), by Distribution Channel 2024 & 2032
- Figure 29: North America Organic Food & Beverage Products Market Revenue Share (%), by Distribution Channel 2024 & 2032
- Figure 30: North America Organic Food & Beverage Products Market Volume Share (%), by Distribution Channel 2024 & 2032
- Figure 31: North America Organic Food & Beverage Products Market Revenue (Million), by Country 2024 & 2032
- Figure 32: North America Organic Food & Beverage Products Market Volume (K Units), by Country 2024 & 2032
- Figure 33: North America Organic Food & Beverage Products Market Revenue Share (%), by Country 2024 & 2032
- Figure 34: North America Organic Food & Beverage Products Market Volume Share (%), by Country 2024 & 2032
- Figure 35: Europe Organic Food & Beverage Products Market Revenue (Million), by Product Type 2024 & 2032
- Figure 36: Europe Organic Food & Beverage Products Market Volume (K Units), by Product Type 2024 & 2032
- Figure 37: Europe Organic Food & Beverage Products Market Revenue Share (%), by Product Type 2024 & 2032
- Figure 38: Europe Organic Food & Beverage Products Market Volume Share (%), by Product Type 2024 & 2032
- Figure 39: Europe Organic Food & Beverage Products Market Revenue (Million), by Distribution Channel 2024 & 2032
- Figure 40: Europe Organic Food & Beverage Products Market Volume (K Units), by Distribution Channel 2024 & 2032
- Figure 41: Europe Organic Food & Beverage Products Market Revenue Share (%), by Distribution Channel 2024 & 2032
- Figure 42: Europe Organic Food & Beverage Products Market Volume Share (%), by Distribution Channel 2024 & 2032
- Figure 43: Europe Organic Food & Beverage Products Market Revenue (Million), by Country 2024 & 2032
- Figure 44: Europe Organic Food & Beverage Products Market Volume (K Units), by Country 2024 & 2032
- Figure 45: Europe Organic Food & Beverage Products Market Revenue Share (%), by Country 2024 & 2032
- Figure 46: Europe Organic Food & Beverage Products Market Volume Share (%), by Country 2024 & 2032
- Figure 47: Asia Pacific Organic Food & Beverage Products Market Revenue (Million), by Product Type 2024 & 2032
- Figure 48: Asia Pacific Organic Food & Beverage Products Market Volume (K Units), by Product Type 2024 & 2032
- Figure 49: Asia Pacific Organic Food & Beverage Products Market Revenue Share (%), by Product Type 2024 & 2032
- Figure 50: Asia Pacific Organic Food & Beverage Products Market Volume Share (%), by Product Type 2024 & 2032
- Figure 51: Asia Pacific Organic Food & Beverage Products Market Revenue (Million), by Distribution Channel 2024 & 2032
- Figure 52: Asia Pacific Organic Food & Beverage Products Market Volume (K Units), by Distribution Channel 2024 & 2032
- Figure 53: Asia Pacific Organic Food & Beverage Products Market Revenue Share (%), by Distribution Channel 2024 & 2032
- Figure 54: Asia Pacific Organic Food & Beverage Products Market Volume Share (%), by Distribution Channel 2024 & 2032
- Figure 55: Asia Pacific Organic Food & Beverage Products Market Revenue (Million), by Country 2024 & 2032
- Figure 56: Asia Pacific Organic Food & Beverage Products Market Volume (K Units), by Country 2024 & 2032
- Figure 57: Asia Pacific Organic Food & Beverage Products Market Revenue Share (%), by Country 2024 & 2032
- Figure 58: Asia Pacific Organic Food & Beverage Products Market Volume Share (%), by Country 2024 & 2032
- Figure 59: South America Organic Food & Beverage Products Market Revenue (Million), by Product Type 2024 & 2032
- Figure 60: South America Organic Food & Beverage Products Market Volume (K Units), by Product Type 2024 & 2032
- Figure 61: South America Organic Food & Beverage Products Market Revenue Share (%), by Product Type 2024 & 2032
- Figure 62: South America Organic Food & Beverage Products Market Volume Share (%), by Product Type 2024 & 2032
- Figure 63: South America Organic Food & Beverage Products Market Revenue (Million), by Distribution Channel 2024 & 2032
- Figure 64: South America Organic Food & Beverage Products Market Volume (K Units), by Distribution Channel 2024 & 2032
- Figure 65: South America Organic Food & Beverage Products Market Revenue Share (%), by Distribution Channel 2024 & 2032
- Figure 66: South America Organic Food & Beverage Products Market Volume Share (%), by Distribution Channel 2024 & 2032
- Figure 67: South America Organic Food & Beverage Products Market Revenue (Million), by Country 2024 & 2032
- Figure 68: South America Organic Food & Beverage Products Market Volume (K Units), by Country 2024 & 2032
- Figure 69: South America Organic Food & Beverage Products Market Revenue Share (%), by Country 2024 & 2032
- Figure 70: South America Organic Food & Beverage Products Market Volume Share (%), by Country 2024 & 2032
- Figure 71: Middle East and Africa Organic Food & Beverage Products Market Revenue (Million), by Product Type 2024 & 2032
- Figure 72: Middle East and Africa Organic Food & Beverage Products Market Volume (K Units), by Product Type 2024 & 2032
- Figure 73: Middle East and Africa Organic Food & Beverage Products Market Revenue Share (%), by Product Type 2024 & 2032
- Figure 74: Middle East and Africa Organic Food & Beverage Products Market Volume Share (%), by Product Type 2024 & 2032
- Figure 75: Middle East and Africa Organic Food & Beverage Products Market Revenue (Million), by Distribution Channel 2024 & 2032
- Figure 76: Middle East and Africa Organic Food & Beverage Products Market Volume (K Units), by Distribution Channel 2024 & 2032
- Figure 77: Middle East and Africa Organic Food & Beverage Products Market Revenue Share (%), by Distribution Channel 2024 & 2032
- Figure 78: Middle East and Africa Organic Food & Beverage Products Market Volume Share (%), by Distribution Channel 2024 & 2032
- Figure 79: Middle East and Africa Organic Food & Beverage Products Market Revenue (Million), by Country 2024 & 2032
- Figure 80: Middle East and Africa Organic Food & Beverage Products Market Volume (K Units), by Country 2024 & 2032
- Figure 81: Middle East and Africa Organic Food & Beverage Products Market Revenue Share (%), by Country 2024 & 2032
- Figure 82: Middle East and Africa Organic Food & Beverage Products Market Volume Share (%), by Country 2024 & 2032
List of Tables
- Table 1: Global Organic Food & Beverage Products Market Revenue Million Forecast, by Region 2019 & 2032
- Table 2: Global Organic Food & Beverage Products Market Volume K Units Forecast, by Region 2019 & 2032
- Table 3: Global Organic Food & Beverage Products Market Revenue Million Forecast, by Product Type 2019 & 2032
- Table 4: Global Organic Food & Beverage Products Market Volume K Units Forecast, by Product Type 2019 & 2032
- Table 5: Global Organic Food & Beverage Products Market Revenue Million Forecast, by Distribution Channel 2019 & 2032
- Table 6: Global Organic Food & Beverage Products Market Volume K Units Forecast, by Distribution Channel 2019 & 2032
- Table 7: Global Organic Food & Beverage Products Market Revenue Million Forecast, by Region 2019 & 2032
- Table 8: Global Organic Food & Beverage Products Market Volume K Units Forecast, by Region 2019 & 2032
- Table 9: Global Organic Food & Beverage Products Market Revenue Million Forecast, by Country 2019 & 2032
- Table 10: Global Organic Food & Beverage Products Market Volume K Units Forecast, by Country 2019 & 2032
- Table 11: United States Organic Food & Beverage Products Market Revenue (Million) Forecast, by Application 2019 & 2032
- Table 12: United States Organic Food & Beverage Products Market Volume (K Units) Forecast, by Application 2019 & 2032
- Table 13: Canada Organic Food & Beverage Products Market Revenue (Million) Forecast, by Application 2019 & 2032
- Table 14: Canada Organic Food & Beverage Products Market Volume (K Units) Forecast, by Application 2019 & 2032
- Table 15: Mexico Organic Food & Beverage Products Market Revenue (Million) Forecast, by Application 2019 & 2032
- Table 16: Mexico Organic Food & Beverage Products Market Volume (K Units) Forecast, by Application 2019 & 2032
- Table 17: Rest of North America Organic Food & Beverage Products Market Revenue (Million) Forecast, by Application 2019 & 2032
- Table 18: Rest of North America Organic Food & Beverage Products Market Volume (K Units) Forecast, by Application 2019 & 2032
- Table 19: Global Organic Food & Beverage Products Market Revenue Million Forecast, by Country 2019 & 2032
- Table 20: Global Organic Food & Beverage Products Market Volume K Units Forecast, by Country 2019 & 2032
- Table 21: United Kingdom Organic Food & Beverage Products Market Revenue (Million) Forecast, by Application 2019 & 2032
- Table 22: United Kingdom Organic Food & Beverage Products Market Volume (K Units) Forecast, by Application 2019 & 2032
- Table 23: Germany Organic Food & Beverage Products Market Revenue (Million) Forecast, by Application 2019 & 2032
- Table 24: Germany Organic Food & Beverage Products Market Volume (K Units) Forecast, by Application 2019 & 2032
- Table 25: France Organic Food & Beverage Products Market Revenue (Million) Forecast, by Application 2019 & 2032
- Table 26: France Organic Food & Beverage Products Market Volume (K Units) Forecast, by Application 2019 & 2032
- Table 27: Russia Organic Food & Beverage Products Market Revenue (Million) Forecast, by Application 2019 & 2032
- Table 28: Russia Organic Food & Beverage Products Market Volume (K Units) Forecast, by Application 2019 & 2032
- Table 29: Italy Organic Food & Beverage Products Market Revenue (Million) Forecast, by Application 2019 & 2032
- Table 30: Italy Organic Food & Beverage Products Market Volume (K Units) Forecast, by Application 2019 & 2032
- Table 31: Spain Organic Food & Beverage Products Market Revenue (Million) Forecast, by Application 2019 & 2032
- Table 32: Spain Organic Food & Beverage Products Market Volume (K Units) Forecast, by Application 2019 & 2032
- Table 33: Rest of Europe Organic Food & Beverage Products Market Revenue (Million) Forecast, by Application 2019 & 2032
- Table 34: Rest of Europe Organic Food & Beverage Products Market Volume (K Units) Forecast, by Application 2019 & 2032
- Table 35: Global Organic Food & Beverage Products Market Revenue Million Forecast, by Country 2019 & 2032
- Table 36: Global Organic Food & Beverage Products Market Volume K Units Forecast, by Country 2019 & 2032
- Table 37: India Organic Food & Beverage Products Market Revenue (Million) Forecast, by Application 2019 & 2032
- Table 38: India Organic Food & Beverage Products Market Volume (K Units) Forecast, by Application 2019 & 2032
- Table 39: China Organic Food & Beverage Products Market Revenue (Million) Forecast, by Application 2019 & 2032
- Table 40: China Organic Food & Beverage Products Market Volume (K Units) Forecast, by Application 2019 & 2032
- Table 41: Japan Organic Food & Beverage Products Market Revenue (Million) Forecast, by Application 2019 & 2032
- Table 42: Japan Organic Food & Beverage Products Market Volume (K Units) Forecast, by Application 2019 & 2032
- Table 43: Australia Organic Food & Beverage Products Market Revenue (Million) Forecast, by Application 2019 & 2032
- Table 44: Australia Organic Food & Beverage Products Market Volume (K Units) Forecast, by Application 2019 & 2032
- Table 45: Rest of Asia Pacific Organic Food & Beverage Products Market Revenue (Million) Forecast, by Application 2019 & 2032
- Table 46: Rest of Asia Pacific Organic Food & Beverage Products Market Volume (K Units) Forecast, by Application 2019 & 2032
- Table 47: Global Organic Food & Beverage Products Market Revenue Million Forecast, by Country 2019 & 2032
- Table 48: Global Organic Food & Beverage Products Market Volume K Units Forecast, by Country 2019 & 2032
- Table 49: Brazil Organic Food & Beverage Products Market Revenue (Million) Forecast, by Application 2019 & 2032
- Table 50: Brazil Organic Food & Beverage Products Market Volume (K Units) Forecast, by Application 2019 & 2032
- Table 51: Argentina Organic Food & Beverage Products Market Revenue (Million) Forecast, by Application 2019 & 2032
- Table 52: Argentina Organic Food & Beverage Products Market Volume (K Units) Forecast, by Application 2019 & 2032
- Table 53: Rest of South America Organic Food & Beverage Products Market Revenue (Million) Forecast, by Application 2019 & 2032
- Table 54: Rest of South America Organic Food & Beverage Products Market Volume (K Units) Forecast, by Application 2019 & 2032
- Table 55: Global Organic Food & Beverage Products Market Revenue Million Forecast, by Country 2019 & 2032
- Table 56: Global Organic Food & Beverage Products Market Volume K Units Forecast, by Country 2019 & 2032
- Table 57: South Africa Organic Food & Beverage Products Market Revenue (Million) Forecast, by Application 2019 & 2032
- Table 58: South Africa Organic Food & Beverage Products Market Volume (K Units) Forecast, by Application 2019 & 2032
- Table 59: Saudi Arabia Organic Food & Beverage Products Market Revenue (Million) Forecast, by Application 2019 & 2032
- Table 60: Saudi Arabia Organic Food & Beverage Products Market Volume (K Units) Forecast, by Application 2019 & 2032
- Table 61: Rest of Middle East and Africa Organic Food & Beverage Products Market Revenue (Million) Forecast, by Application 2019 & 2032
- Table 62: Rest of Middle East and Africa Organic Food & Beverage Products Market Volume (K Units) Forecast, by Application 2019 & 2032
- Table 63: Global Organic Food & Beverage Products Market Revenue Million Forecast, by Product Type 2019 & 2032
- Table 64: Global Organic Food & Beverage Products Market Volume K Units Forecast, by Product Type 2019 & 2032
- Table 65: Global Organic Food & Beverage Products Market Revenue Million Forecast, by Distribution Channel 2019 & 2032
- Table 66: Global Organic Food & Beverage Products Market Volume K Units Forecast, by Distribution Channel 2019 & 2032
- Table 67: Global Organic Food & Beverage Products Market Revenue Million Forecast, by Country 2019 & 2032
- Table 68: Global Organic Food & Beverage Products Market Volume K Units Forecast, by Country 2019 & 2032
- Table 69: United States Organic Food & Beverage Products Market Revenue (Million) Forecast, by Application 2019 & 2032
- Table 70: United States Organic Food & Beverage Products Market Volume (K Units) Forecast, by Application 2019 & 2032
- Table 71: Canada Organic Food & Beverage Products Market Revenue (Million) Forecast, by Application 2019 & 2032
- Table 72: Canada Organic Food & Beverage Products Market Volume (K Units) Forecast, by Application 2019 & 2032
- Table 73: Mexico Organic Food & Beverage Products Market Revenue (Million) Forecast, by Application 2019 & 2032
- Table 74: Mexico Organic Food & Beverage Products Market Volume (K Units) Forecast, by Application 2019 & 2032
- Table 75: Rest of North America Organic Food & Beverage Products Market Revenue (Million) Forecast, by Application 2019 & 2032
- Table 76: Rest of North America Organic Food & Beverage Products Market Volume (K Units) Forecast, by Application 2019 & 2032
- Table 77: Global Organic Food & Beverage Products Market Revenue Million Forecast, by Product Type 2019 & 2032
- Table 78: Global Organic Food & Beverage Products Market Volume K Units Forecast, by Product Type 2019 & 2032
- Table 79: Global Organic Food & Beverage Products Market Revenue Million Forecast, by Distribution Channel 2019 & 2032
- Table 80: Global Organic Food & Beverage Products Market Volume K Units Forecast, by Distribution Channel 2019 & 2032
- Table 81: Global Organic Food & Beverage Products Market Revenue Million Forecast, by Country 2019 & 2032
- Table 82: Global Organic Food & Beverage Products Market Volume K Units Forecast, by Country 2019 & 2032
- Table 83: United Kingdom Organic Food & Beverage Products Market Revenue (Million) Forecast, by Application 2019 & 2032
- Table 84: United Kingdom Organic Food & Beverage Products Market Volume (K Units) Forecast, by Application 2019 & 2032
- Table 85: Germany Organic Food & Beverage Products Market Revenue (Million) Forecast, by Application 2019 & 2032
- Table 86: Germany Organic Food & Beverage Products Market Volume (K Units) Forecast, by Application 2019 & 2032
- Table 87: France Organic Food & Beverage Products Market Revenue (Million) Forecast, by Application 2019 & 2032
- Table 88: France Organic Food & Beverage Products Market Volume (K Units) Forecast, by Application 2019 & 2032
- Table 89: Russia Organic Food & Beverage Products Market Revenue (Million) Forecast, by Application 2019 & 2032
- Table 90: Russia Organic Food & Beverage Products Market Volume (K Units) Forecast, by Application 2019 & 2032
- Table 91: Italy Organic Food & Beverage Products Market Revenue (Million) Forecast, by Application 2019 & 2032
- Table 92: Italy Organic Food & Beverage Products Market Volume (K Units) Forecast, by Application 2019 & 2032
- Table 93: Spain Organic Food & Beverage Products Market Revenue (Million) Forecast, by Application 2019 & 2032
- Table 94: Spain Organic Food & Beverage Products Market Volume (K Units) Forecast, by Application 2019 & 2032
- Table 95: Rest of Europe Organic Food & Beverage Products Market Revenue (Million) Forecast, by Application 2019 & 2032
- Table 96: Rest of Europe Organic Food & Beverage Products Market Volume (K Units) Forecast, by Application 2019 & 2032
- Table 97: Global Organic Food & Beverage Products Market Revenue Million Forecast, by Product Type 2019 & 2032
- Table 98: Global Organic Food & Beverage Products Market Volume K Units Forecast, by Product Type 2019 & 2032
- Table 99: Global Organic Food & Beverage Products Market Revenue Million Forecast, by Distribution Channel 2019 & 2032
- Table 100: Global Organic Food & Beverage Products Market Volume K Units Forecast, by Distribution Channel 2019 & 2032
- Table 101: Global Organic Food & Beverage Products Market Revenue Million Forecast, by Country 2019 & 2032
- Table 102: Global Organic Food & Beverage Products Market Volume K Units Forecast, by Country 2019 & 2032
- Table 103: India Organic Food & Beverage Products Market Revenue (Million) Forecast, by Application 2019 & 2032
- Table 104: India Organic Food & Beverage Products Market Volume (K Units) Forecast, by Application 2019 & 2032
- Table 105: China Organic Food & Beverage Products Market Revenue (Million) Forecast, by Application 2019 & 2032
- Table 106: China Organic Food & Beverage Products Market Volume (K Units) Forecast, by Application 2019 & 2032
- Table 107: Japan Organic Food & Beverage Products Market Revenue (Million) Forecast, by Application 2019 & 2032
- Table 108: Japan Organic Food & Beverage Products Market Volume (K Units) Forecast, by Application 2019 & 2032
- Table 109: Australia Organic Food & Beverage Products Market Revenue (Million) Forecast, by Application 2019 & 2032
- Table 110: Australia Organic Food & Beverage Products Market Volume (K Units) Forecast, by Application 2019 & 2032
- Table 111: Rest of Asia Pacific Organic Food & Beverage Products Market Revenue (Million) Forecast, by Application 2019 & 2032
- Table 112: Rest of Asia Pacific Organic Food & Beverage Products Market Volume (K Units) Forecast, by Application 2019 & 2032
- Table 113: Global Organic Food & Beverage Products Market Revenue Million Forecast, by Product Type 2019 & 2032
- Table 114: Global Organic Food & Beverage Products Market Volume K Units Forecast, by Product Type 2019 & 2032
- Table 115: Global Organic Food & Beverage Products Market Revenue Million Forecast, by Distribution Channel 2019 & 2032
- Table 116: Global Organic Food & Beverage Products Market Volume K Units Forecast, by Distribution Channel 2019 & 2032
- Table 117: Global Organic Food & Beverage Products Market Revenue Million Forecast, by Country 2019 & 2032
- Table 118: Global Organic Food & Beverage Products Market Volume K Units Forecast, by Country 2019 & 2032
- Table 119: Brazil Organic Food & Beverage Products Market Revenue (Million) Forecast, by Application 2019 & 2032
- Table 120: Brazil Organic Food & Beverage Products Market Volume (K Units) Forecast, by Application 2019 & 2032
- Table 121: Argentina Organic Food & Beverage Products Market Revenue (Million) Forecast, by Application 2019 & 2032
- Table 122: Argentina Organic Food & Beverage Products Market Volume (K Units) Forecast, by Application 2019 & 2032
- Table 123: Rest of South America Organic Food & Beverage Products Market Revenue (Million) Forecast, by Application 2019 & 2032
- Table 124: Rest of South America Organic Food & Beverage Products Market Volume (K Units) Forecast, by Application 2019 & 2032
- Table 125: Global Organic Food & Beverage Products Market Revenue Million Forecast, by Product Type 2019 & 2032
- Table 126: Global Organic Food & Beverage Products Market Volume K Units Forecast, by Product Type 2019 & 2032
- Table 127: Global Organic Food & Beverage Products Market Revenue Million Forecast, by Distribution Channel 2019 & 2032
- Table 128: Global Organic Food & Beverage Products Market Volume K Units Forecast, by Distribution Channel 2019 & 2032
- Table 129: Global Organic Food & Beverage Products Market Revenue Million Forecast, by Country 2019 & 2032
- Table 130: Global Organic Food & Beverage Products Market Volume K Units Forecast, by Country 2019 & 2032
- Table 131: South Africa Organic Food & Beverage Products Market Revenue (Million) Forecast, by Application 2019 & 2032
- Table 132: South Africa Organic Food & Beverage Products Market Volume (K Units) Forecast, by Application 2019 & 2032
- Table 133: Saudi Arabia Organic Food & Beverage Products Market Revenue (Million) Forecast, by Application 2019 & 2032
- Table 134: Saudi Arabia Organic Food & Beverage Products Market Volume (K Units) Forecast, by Application 2019 & 2032
- Table 135: Rest of Middle East and Africa Organic Food & Beverage Products Market Revenue (Million) Forecast, by Application 2019 & 2032
- Table 136: Rest of Middle East and Africa Organic Food & Beverage Products Market Volume (K Units) Forecast, by Application 2019 & 2032
Frequently Asked Questions
1. What is the projected Compound Annual Growth Rate (CAGR) of the Organic Food & Beverage Products Market?
The projected CAGR is approximately 6.02%.
2. Which companies are prominent players in the Organic Food & Beverage Products Market?
Key companies in the market include General Mills Inc, Organic Valley, The Hain Celestial Group Inc, Danone - WhiteWave Foods, Dean Food Company, Belvoir Fruit Farms Ltd, Amy's Kitchen Inc, ConAgra Brand*List Not Exhaustive, United Natural Foods Inc, Horizon Organic.
3. What are the main segments of the Organic Food & Beverage Products Market?
The market segments include Product Type, Distribution Channel.
4. Can you provide details about the market size?
The market size is estimated to be USD 174.37 Million as of 2022.
5. What are some drivers contributing to market growth?
Growing Demand for Nutricosmetics Among Millennials; Growing Beauty and Wellness Trend.
6. What are the notable trends driving market growth?
Increasing Demand for Clean Label Products.
7. Are there any restraints impacting market growth?
Stringent Government Regulations and Product Guidelines.
8. Can you provide examples of recent developments in the market?
In August 2022, Danone acquired organic food producer Happy Family. Happy Family produces a variety of organic products. The management of Danone revealed that the company has agreed to purchase 92% of the organic baby and baby food manufacturer Happy Family.
9. What pricing options are available for accessing the report?
Pricing options include single-user, multi-user, and enterprise licenses priced at USD 4750, USD 5250, and USD 8750 respectively.
10. Is the market size provided in terms of value or volume?
The market size is provided in terms of value, measured in Million and volume, measured in K Units.
11. Are there any specific market keywords associated with the report?
Yes, the market keyword associated with the report is "Organic Food & Beverage Products Market," which aids in identifying and referencing the specific market segment covered.
12. How do I determine which pricing option suits my needs best?
The pricing options vary based on user requirements and access needs. Individual users may opt for single-user licenses, while businesses requiring broader access may choose multi-user or enterprise licenses for cost-effective access to the report.
13. Are there any additional resources or data provided in the Organic Food & Beverage Products Market report?
While the report offers comprehensive insights, it's advisable to review the specific contents or supplementary materials provided to ascertain if additional resources or data are available.
14. How can I stay updated on further developments or reports in the Organic Food & Beverage Products Market?
To stay informed about further developments, trends, and reports in the Organic Food & Beverage Products Market, consider subscribing to industry newsletters, following relevant companies and organizations, or regularly checking reputable industry news sources and publications.
Methodology
Step 1 - Identification of Relevant Samples Size from Population Database


Step 2 - Approaches for Defining Global Market Size (Value, Volume* & Price*)

Note*: In applicable scenarios
Step 3 - Data Sources
Primary Research
- Web Analytics
- Survey Reports
- Research Institute
- Latest Research Reports
- Opinion Leaders
Secondary Research
- Annual Reports
- White Paper
- Latest Press Release
- Industry Association
- Paid Database
- Investor Presentations

Step 4 - Data Triangulation
Involves using different sources of information in order to increase the validity of a study
These sources are likely to be stakeholders in a program - participants, other researchers, program staff, other community members, and so on.
Then we put all data in single framework & apply various statistical tools to find out the dynamic on the market.
During the analysis stage, feedback from the stakeholder groups would be compared to determine areas of agreement as well as areas of divergence


