
Key Insights
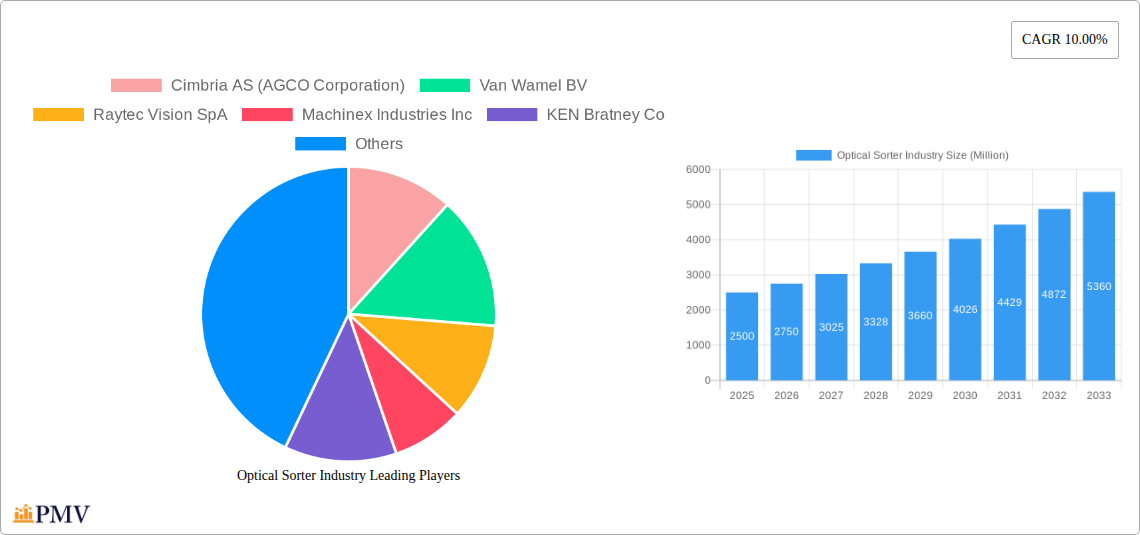
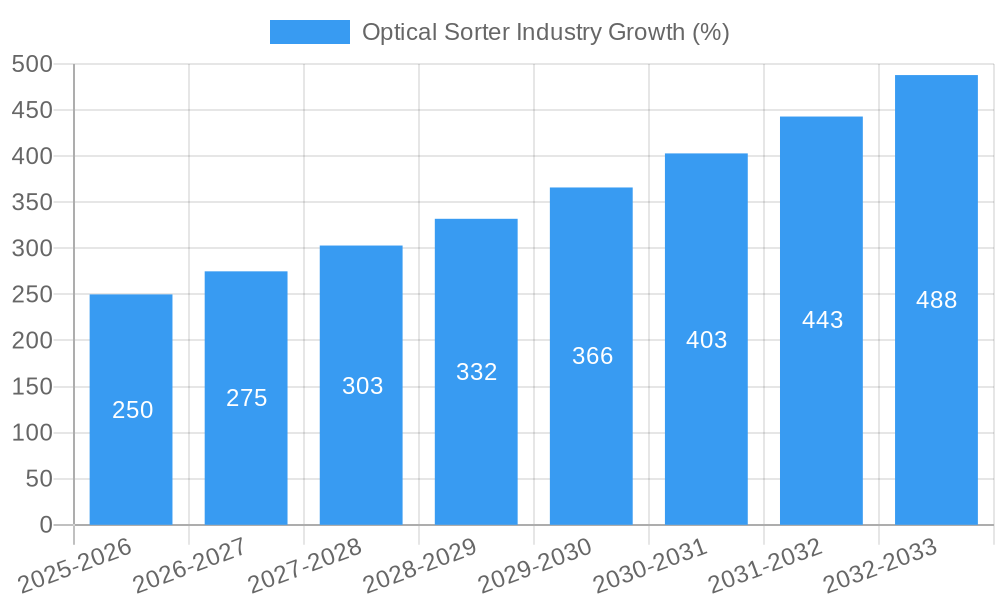
The optical sorter industry is experiencing robust growth, driven by increasing demand for efficient and precise material sorting across diverse sectors. The industry's Compound Annual Growth Rate (CAGR) of 10% from 2019 to 2024 indicates a significant upward trajectory, projected to continue through 2033. Key drivers include the rising need for improved product quality in the food and recycling industries, alongside the growing adoption of automation in mining and other resource-intensive sectors. Technological advancements, such as improved sensor technology and AI-powered sorting algorithms, are further propelling market expansion. While initial investment costs can present a restraint for some businesses, the long-term cost savings and efficiency gains associated with optical sorters are proving increasingly compelling. Segmentation reveals a strong performance in both hardware and software components, with hardware commanding a larger share due to the capital-intensive nature of equipment purchase. Among end-user industries, food processing currently dominates the market due to stringent quality control requirements and the need to minimize waste. However, substantial growth is expected in the recycling sector, fueled by increasing environmental regulations and the imperative for sustainable waste management practices. Major players, including Cimbria AS, TOMRA Systems ASA, and Key Technology Inc., are actively shaping the market through innovation and strategic partnerships, while regional dominance is expected to be shared among North America, Europe, and the Asia-Pacific region, reflecting varying levels of technological adoption and industrial development across these geographical areas.
The forecast period (2025-2033) anticipates continued growth, fueled by emerging applications in new industries and ongoing technological refinement. Increased investment in research and development, along with strategic mergers and acquisitions within the industry, suggest a highly competitive landscape with ongoing innovation driving improvements in sorting accuracy, speed, and versatility. The development of more sustainable and energy-efficient optical sorters will further contribute to market growth. While challenges remain, including the need for skilled workforce and addressing potential regulatory hurdles, the overall outlook for the optical sorter industry remains positive, promising substantial market expansion over the coming decade.
Optical Sorter Industry Market Report: 2019-2033
This comprehensive report provides a detailed analysis of the global optical sorter industry, offering invaluable insights for stakeholders, investors, and industry professionals. Covering the period from 2019 to 2033, with a focus on 2025, this report examines market dynamics, competitive landscapes, and future growth potential. The global optical sorter market is projected to reach xx Million by 2033, exhibiting a CAGR of xx% during the forecast period (2025-2033).
Optical Sorter Industry Market Structure & Competitive Dynamics
The optical sorter market is characterized by a moderately concentrated landscape with several key players holding significant market share. While a few dominant companies lead, numerous smaller, specialized firms also contribute significantly. The industry features a dynamic innovation ecosystem, driven by continuous advancements in sensor technology, machine learning algorithms, and automation capabilities. Regulatory frameworks concerning food safety and environmental standards influence market practices and product development. The existence of alternative sorting technologies, such as manual sorting and air-based sorters, presents some level of substitutability but optical sorters generally offer superior accuracy and efficiency. End-user trends towards automation and improved quality control drive adoption. M&A activity has been moderate, with deal values ranging from xx Million to xx Million in recent years, primarily focused on expanding product portfolios and geographical reach.
- Market Concentration: Moderately concentrated, with top 5 players holding approximately xx% market share.
- Innovation: Continuous advancements in sensor technology, AI, and automation.
- Regulatory: Stringent food safety and environmental regulations impact operations.
- M&A Activity: Moderate activity with deal values averaging xx Million.
Optical Sorter Industry Industry Trends & Insights
The optical sorter market is experiencing robust growth, propelled by several key factors. Increasing demand for high-quality food products, coupled with rising labor costs, fuels adoption across the food processing industry. The recycling sector is also a significant driver, as optical sorters facilitate efficient waste management and resource recovery. Technological advancements, such as the integration of AI and machine learning, are enhancing sorting accuracy and efficiency. The market is also witnessing increased adoption of advanced features, such as multi-spectral imaging and improved software analytics. Consumer preferences for high-quality and sustainably sourced products are indirectly driving market growth. Competitive dynamics are intense, with companies focusing on product differentiation, innovation, and strategic partnerships to gain market share. The market is expected to achieve a CAGR of xx% between 2025 and 2033, driven by sustained growth in end-user industries and technological advancements. Market penetration is expected to reach xx% by 2033.
Dominant Markets & Segments in Optical Sorter Industry
The food processing industry dominates the optical sorter market, accounting for the largest share, followed by recycling and mining sectors. Geographically, North America and Europe currently hold substantial market share, driven by high adoption rates in the food and recycling industries. However, Asia-Pacific is expected to experience the fastest growth in the coming years due to expanding food processing and infrastructure development.
Key Drivers:
- Food: Growing demand for high-quality food products, increasing labor costs, automation needs.
- Recycling: Stringent waste management regulations, rising environmental awareness, resource recovery.
- Mining: Need for efficient ore sorting, improving resource extraction efficiency.
- North America/Europe: High adoption in food and recycling industries, advanced technological infrastructure.
- Asia-Pacific: Rapid industrialization, expanding food processing capacity, infrastructure growth.
Dominance Analysis: The food processing segment's dominance is primarily due to its high volume of processed foods and the stringent quality control demanded. North America and Europe are dominant due to earlier adoption and established technological infrastructure. However, the Asia-Pacific region demonstrates a high growth trajectory based on its rapid industrialization and significant investment in food processing.
Optical Sorter Industry Product Innovations
Recent product innovations focus on enhanced accuracy, speed, and efficiency through AI and machine learning integration. New sorters offer multi-spectral imaging capabilities, enabling the detection of subtle defects invisible to traditional systems. These advancements improve yield, reduce waste, and increase overall operational efficiency. Moreover, advanced software packages enable better data analysis, process optimization, and remote monitoring, improving overall system performance and maintenance. This focus on innovation reflects the growing market demand for improved efficiency and cost reduction.
Report Segmentation & Scope
The report segments the optical sorter market by type (hardware and software) and end-user industries (food, recycling, mining, and other).
By Type:
Hardware: This segment is the largest, focusing on the mechanical and optical components. The market is characterized by intense competition among established players and emerging technology providers. It is expected to see steady growth due to technological advancements and ongoing demand for automated solutions.
Software: This segment is growing rapidly, driven by the increasing adoption of AI and machine learning algorithms. The software component enhances sorter performance, improving accuracy and efficiency. The segment exhibits a high degree of competition due to the specialized nature of the software.
By End-user Industry:
Food: This is the largest segment, with continued growth fueled by the rising demand for high-quality food products and increased automation in the food processing sector.
Recycling: This segment is experiencing significant growth due to stricter environmental regulations and the need for efficient waste management.
Mining: This segment shows moderate growth, as optical sorters are employed in the precise sorting of valuable minerals and ores.
Other: This segment includes various industries using optical sorting technology such as pharmaceuticals and agriculture. Growth is projected to remain steady.
Key Drivers of Optical Sorter Industry Growth
The optical sorter industry's growth is driven by several factors. Firstly, the increasing demand for higher quality products and reduced waste across various industries (food, recycling, and mining) is a primary driver. Secondly, technological advancements, such as AI and machine learning integration, are continuously enhancing sorter performance, accuracy, and efficiency. Finally, stringent environmental regulations and sustainability initiatives in several regions are promoting the adoption of optical sorters for efficient resource recovery and waste management.
Challenges in the Optical Sorter Industry Sector
The optical sorter industry faces challenges such as the high initial investment costs associated with advanced systems. Supply chain disruptions impacting component availability can also cause delays and increase costs. Furthermore, intense competition among existing players and the entry of new companies create price pressures and demand for continuous innovation. Finally, achieving seamless integration of the systems into existing production lines presents an operational challenge.
Leading Players in the Optical Sorter Industry Market
- Cimbria AS (AGCO Corporation)
- Van Wamel BV
- Raytec Vision SpA
- Machinex Industries Inc
- KEN Bratney Co
- TOMRA Systems ASA
- Eagle Vizion Inc
- Satake Corporation
- Key Technology Inc ( Duravant LLC)
- Bhler Holding AG
- National Recovery Technologies LLC
- Hefei Meyer Optoelectronic Technology Inc
- MSS Inc (CP Manufacturing Inc )
- Sesotec GmbH
Key Developments in Optical Sorter Industry Sector
- November 2022: Key Technology Inc. launched its Herbert OCULUS whole potato optical sorter, showcasing advancements in potato and vegetable sorting. This launch significantly impacted the market by introducing advanced technology for defect detection and size sorting.
- June 2022: Inaba peanuts co ltd implemented the TOMRA 5B sorter, highlighting the increasing adoption of high-volume optical sorting solutions in the food industry for consistent and efficient production. This demonstrates the growing preference for efficient sorting in large-scale food processing.
Strategic Optical Sorter Industry Market Outlook
The optical sorter market is poised for significant growth driven by ongoing technological advancements and increasing demand from key sectors. Strategic opportunities exist for companies to focus on developing AI-powered solutions, expanding into emerging markets, and offering customized solutions to meet specific industry needs. Companies focusing on innovation, strong partnerships, and efficient supply chain management are well-positioned to capitalize on the market's potential. The increasing emphasis on sustainability and resource efficiency further strengthens the long-term growth outlook for the optical sorter industry.
Optical Sorter Industry Segmentation
-
1. Technology
- 1.1. X-ray Transmission
- 1.2. Camera Solutions
- 1.3. NIR-Sensors
- 1.4. Other Technologies (Hyperspectral, Laser, etc.)
-
2. End-user Industries
- 2.1. Food Processing
- 2.2. Recycling
- 2.3. Mining
- 2.4. Other End-user Industries
Optical Sorter Industry Segmentation By Geography
- 1. North America
- 2. Europe
- 3. Asia
- 4. Australia and New Zealand
- 5. Latin America
- 6. Middle East and Africa

Optical Sorter Industry REPORT HIGHLIGHTS
| Aspects | Details |
|---|---|
| Study Period | 2019-2033 |
| Base Year | 2024 |
| Estimated Year | 2025 |
| Forecast Period | 2025-2033 |
| Historical Period | 2019-2024 |
| Growth Rate | CAGR of 10.00% from 2019-2033 |
| Segmentation |
|
Table of Contents
- 1. Introduction
- 1.1. Research Scope
- 1.2. Market Segmentation
- 1.3. Research Methodology
- 1.4. Definitions and Assumptions
- 2. Executive Summary
- 2.1. Introduction
- 3. Market Dynamics
- 3.1. Introduction
- 3.2. Market Drivers
- 3.2.1. Increasing Demand for Reducing the Delivery and Processing Time; Stringent Regulations Regarding the Food Quality and Labor Costs
- 3.3. Market Restrains
- 3.3.1. High Deployment and Maintenance Costs; Real-time Technical Challenges and the Need for Skilled Workforce
- 3.4. Market Trends
- 3.4.1. Food Industry is Expected to Gain Demand Momentum Owing to Evolving Regulations
- 4. Market Factor Analysis
- 4.1. Porters Five Forces
- 4.2. Supply/Value Chain
- 4.3. PESTEL analysis
- 4.4. Market Entropy
- 4.5. Patent/Trademark Analysis
- 5. Global Optical Sorter Industry Analysis, Insights and Forecast, 2019-2031
- 5.1. Market Analysis, Insights and Forecast - by Technology
- 5.1.1. X-ray Transmission
- 5.1.2. Camera Solutions
- 5.1.3. NIR-Sensors
- 5.1.4. Other Technologies (Hyperspectral, Laser, etc.)
- 5.2. Market Analysis, Insights and Forecast - by End-user Industries
- 5.2.1. Food Processing
- 5.2.2. Recycling
- 5.2.3. Mining
- 5.2.4. Other End-user Industries
- 5.3. Market Analysis, Insights and Forecast - by Region
- 5.3.1. North America
- 5.3.2. Europe
- 5.3.3. Asia
- 5.3.4. Australia and New Zealand
- 5.3.5. Latin America
- 5.3.6. Middle East and Africa
- 5.1. Market Analysis, Insights and Forecast - by Technology
- 6. North America Optical Sorter Industry Analysis, Insights and Forecast, 2019-2031
- 6.1. Market Analysis, Insights and Forecast - by Technology
- 6.1.1. X-ray Transmission
- 6.1.2. Camera Solutions
- 6.1.3. NIR-Sensors
- 6.1.4. Other Technologies (Hyperspectral, Laser, etc.)
- 6.2. Market Analysis, Insights and Forecast - by End-user Industries
- 6.2.1. Food Processing
- 6.2.2. Recycling
- 6.2.3. Mining
- 6.2.4. Other End-user Industries
- 6.1. Market Analysis, Insights and Forecast - by Technology
- 7. Europe Optical Sorter Industry Analysis, Insights and Forecast, 2019-2031
- 7.1. Market Analysis, Insights and Forecast - by Technology
- 7.1.1. X-ray Transmission
- 7.1.2. Camera Solutions
- 7.1.3. NIR-Sensors
- 7.1.4. Other Technologies (Hyperspectral, Laser, etc.)
- 7.2. Market Analysis, Insights and Forecast - by End-user Industries
- 7.2.1. Food Processing
- 7.2.2. Recycling
- 7.2.3. Mining
- 7.2.4. Other End-user Industries
- 7.1. Market Analysis, Insights and Forecast - by Technology
- 8. Asia Optical Sorter Industry Analysis, Insights and Forecast, 2019-2031
- 8.1. Market Analysis, Insights and Forecast - by Technology
- 8.1.1. X-ray Transmission
- 8.1.2. Camera Solutions
- 8.1.3. NIR-Sensors
- 8.1.4. Other Technologies (Hyperspectral, Laser, etc.)
- 8.2. Market Analysis, Insights and Forecast - by End-user Industries
- 8.2.1. Food Processing
- 8.2.2. Recycling
- 8.2.3. Mining
- 8.2.4. Other End-user Industries
- 8.1. Market Analysis, Insights and Forecast - by Technology
- 9. Australia and New Zealand Optical Sorter Industry Analysis, Insights and Forecast, 2019-2031
- 9.1. Market Analysis, Insights and Forecast - by Technology
- 9.1.1. X-ray Transmission
- 9.1.2. Camera Solutions
- 9.1.3. NIR-Sensors
- 9.1.4. Other Technologies (Hyperspectral, Laser, etc.)
- 9.2. Market Analysis, Insights and Forecast - by End-user Industries
- 9.2.1. Food Processing
- 9.2.2. Recycling
- 9.2.3. Mining
- 9.2.4. Other End-user Industries
- 9.1. Market Analysis, Insights and Forecast - by Technology
- 10. Latin America Optical Sorter Industry Analysis, Insights and Forecast, 2019-2031
- 10.1. Market Analysis, Insights and Forecast - by Technology
- 10.1.1. X-ray Transmission
- 10.1.2. Camera Solutions
- 10.1.3. NIR-Sensors
- 10.1.4. Other Technologies (Hyperspectral, Laser, etc.)
- 10.2. Market Analysis, Insights and Forecast - by End-user Industries
- 10.2.1. Food Processing
- 10.2.2. Recycling
- 10.2.3. Mining
- 10.2.4. Other End-user Industries
- 10.1. Market Analysis, Insights and Forecast - by Technology
- 11. Middle East and Africa Optical Sorter Industry Analysis, Insights and Forecast, 2019-2031
- 11.1. Market Analysis, Insights and Forecast - by Technology
- 11.1.1. X-ray Transmission
- 11.1.2. Camera Solutions
- 11.1.3. NIR-Sensors
- 11.1.4. Other Technologies (Hyperspectral, Laser, etc.)
- 11.2. Market Analysis, Insights and Forecast - by End-user Industries
- 11.2.1. Food Processing
- 11.2.2. Recycling
- 11.2.3. Mining
- 11.2.4. Other End-user Industries
- 11.1. Market Analysis, Insights and Forecast - by Technology
- 12. North America Optical Sorter Industry Analysis, Insights and Forecast, 2019-2031
- 12.1. Market Analysis, Insights and Forecast - By Country/Sub-region
- 12.1.1.
- 13. Europe Optical Sorter Industry Analysis, Insights and Forecast, 2019-2031
- 13.1. Market Analysis, Insights and Forecast - By Country/Sub-region
- 13.1.1.
- 14. Asia Pacific Optical Sorter Industry Analysis, Insights and Forecast, 2019-2031
- 14.1. Market Analysis, Insights and Forecast - By Country/Sub-region
- 14.1.1.
- 15. Rest of the World Optical Sorter Industry Analysis, Insights and Forecast, 2019-2031
- 15.1. Market Analysis, Insights and Forecast - By Country/Sub-region
- 15.1.1.
- 16. Competitive Analysis
- 16.1. Global Market Share Analysis 2024
- 16.2. Company Profiles
- 16.2.1 Cimbria AS (AGCO Corporation)
- 16.2.1.1. Overview
- 16.2.1.2. Products
- 16.2.1.3. SWOT Analysis
- 16.2.1.4. Recent Developments
- 16.2.1.5. Financials (Based on Availability)
- 16.2.2 Van Wamel BV
- 16.2.2.1. Overview
- 16.2.2.2. Products
- 16.2.2.3. SWOT Analysis
- 16.2.2.4. Recent Developments
- 16.2.2.5. Financials (Based on Availability)
- 16.2.3 Raytec Vision SpA
- 16.2.3.1. Overview
- 16.2.3.2. Products
- 16.2.3.3. SWOT Analysis
- 16.2.3.4. Recent Developments
- 16.2.3.5. Financials (Based on Availability)
- 16.2.4 Machinex Industries Inc
- 16.2.4.1. Overview
- 16.2.4.2. Products
- 16.2.4.3. SWOT Analysis
- 16.2.4.4. Recent Developments
- 16.2.4.5. Financials (Based on Availability)
- 16.2.5 KEN Bratney Co
- 16.2.5.1. Overview
- 16.2.5.2. Products
- 16.2.5.3. SWOT Analysis
- 16.2.5.4. Recent Developments
- 16.2.5.5. Financials (Based on Availability)
- 16.2.6 TOMRA Systems ASA
- 16.2.6.1. Overview
- 16.2.6.2. Products
- 16.2.6.3. SWOT Analysis
- 16.2.6.4. Recent Developments
- 16.2.6.5. Financials (Based on Availability)
- 16.2.7 Eagle Vizion Inc
- 16.2.7.1. Overview
- 16.2.7.2. Products
- 16.2.7.3. SWOT Analysis
- 16.2.7.4. Recent Developments
- 16.2.7.5. Financials (Based on Availability)
- 16.2.8 Satake Corporation
- 16.2.8.1. Overview
- 16.2.8.2. Products
- 16.2.8.3. SWOT Analysis
- 16.2.8.4. Recent Developments
- 16.2.8.5. Financials (Based on Availability)
- 16.2.9 Key Technology Inc ( Duravant LLC)
- 16.2.9.1. Overview
- 16.2.9.2. Products
- 16.2.9.3. SWOT Analysis
- 16.2.9.4. Recent Developments
- 16.2.9.5. Financials (Based on Availability)
- 16.2.10 Bhler Holding AG
- 16.2.10.1. Overview
- 16.2.10.2. Products
- 16.2.10.3. SWOT Analysis
- 16.2.10.4. Recent Developments
- 16.2.10.5. Financials (Based on Availability)
- 16.2.11 National Recovery Technologies LLC
- 16.2.11.1. Overview
- 16.2.11.2. Products
- 16.2.11.3. SWOT Analysis
- 16.2.11.4. Recent Developments
- 16.2.11.5. Financials (Based on Availability)
- 16.2.12 Hefei Meyer Optoelectronic Technology Inc
- 16.2.12.1. Overview
- 16.2.12.2. Products
- 16.2.12.3. SWOT Analysis
- 16.2.12.4. Recent Developments
- 16.2.12.5. Financials (Based on Availability)
- 16.2.13 MSS Inc (CP Manufacturing Inc )
- 16.2.13.1. Overview
- 16.2.13.2. Products
- 16.2.13.3. SWOT Analysis
- 16.2.13.4. Recent Developments
- 16.2.13.5. Financials (Based on Availability)
- 16.2.14 Sesotec GmbH*List Not Exhaustive
- 16.2.14.1. Overview
- 16.2.14.2. Products
- 16.2.14.3. SWOT Analysis
- 16.2.14.4. Recent Developments
- 16.2.14.5. Financials (Based on Availability)
- 16.2.1 Cimbria AS (AGCO Corporation)
List of Figures
- Figure 1: Global Optical Sorter Industry Revenue Breakdown (Million, %) by Region 2024 & 2032
- Figure 2: North America Optical Sorter Industry Revenue (Million), by Country 2024 & 2032
- Figure 3: North America Optical Sorter Industry Revenue Share (%), by Country 2024 & 2032
- Figure 4: Europe Optical Sorter Industry Revenue (Million), by Country 2024 & 2032
- Figure 5: Europe Optical Sorter Industry Revenue Share (%), by Country 2024 & 2032
- Figure 6: Asia Pacific Optical Sorter Industry Revenue (Million), by Country 2024 & 2032
- Figure 7: Asia Pacific Optical Sorter Industry Revenue Share (%), by Country 2024 & 2032
- Figure 8: Rest of the World Optical Sorter Industry Revenue (Million), by Country 2024 & 2032
- Figure 9: Rest of the World Optical Sorter Industry Revenue Share (%), by Country 2024 & 2032
- Figure 10: North America Optical Sorter Industry Revenue (Million), by Technology 2024 & 2032
- Figure 11: North America Optical Sorter Industry Revenue Share (%), by Technology 2024 & 2032
- Figure 12: North America Optical Sorter Industry Revenue (Million), by End-user Industries 2024 & 2032
- Figure 13: North America Optical Sorter Industry Revenue Share (%), by End-user Industries 2024 & 2032
- Figure 14: North America Optical Sorter Industry Revenue (Million), by Country 2024 & 2032
- Figure 15: North America Optical Sorter Industry Revenue Share (%), by Country 2024 & 2032
- Figure 16: Europe Optical Sorter Industry Revenue (Million), by Technology 2024 & 2032
- Figure 17: Europe Optical Sorter Industry Revenue Share (%), by Technology 2024 & 2032
- Figure 18: Europe Optical Sorter Industry Revenue (Million), by End-user Industries 2024 & 2032
- Figure 19: Europe Optical Sorter Industry Revenue Share (%), by End-user Industries 2024 & 2032
- Figure 20: Europe Optical Sorter Industry Revenue (Million), by Country 2024 & 2032
- Figure 21: Europe Optical Sorter Industry Revenue Share (%), by Country 2024 & 2032
- Figure 22: Asia Optical Sorter Industry Revenue (Million), by Technology 2024 & 2032
- Figure 23: Asia Optical Sorter Industry Revenue Share (%), by Technology 2024 & 2032
- Figure 24: Asia Optical Sorter Industry Revenue (Million), by End-user Industries 2024 & 2032
- Figure 25: Asia Optical Sorter Industry Revenue Share (%), by End-user Industries 2024 & 2032
- Figure 26: Asia Optical Sorter Industry Revenue (Million), by Country 2024 & 2032
- Figure 27: Asia Optical Sorter Industry Revenue Share (%), by Country 2024 & 2032
- Figure 28: Australia and New Zealand Optical Sorter Industry Revenue (Million), by Technology 2024 & 2032
- Figure 29: Australia and New Zealand Optical Sorter Industry Revenue Share (%), by Technology 2024 & 2032
- Figure 30: Australia and New Zealand Optical Sorter Industry Revenue (Million), by End-user Industries 2024 & 2032
- Figure 31: Australia and New Zealand Optical Sorter Industry Revenue Share (%), by End-user Industries 2024 & 2032
- Figure 32: Australia and New Zealand Optical Sorter Industry Revenue (Million), by Country 2024 & 2032
- Figure 33: Australia and New Zealand Optical Sorter Industry Revenue Share (%), by Country 2024 & 2032
- Figure 34: Latin America Optical Sorter Industry Revenue (Million), by Technology 2024 & 2032
- Figure 35: Latin America Optical Sorter Industry Revenue Share (%), by Technology 2024 & 2032
- Figure 36: Latin America Optical Sorter Industry Revenue (Million), by End-user Industries 2024 & 2032
- Figure 37: Latin America Optical Sorter Industry Revenue Share (%), by End-user Industries 2024 & 2032
- Figure 38: Latin America Optical Sorter Industry Revenue (Million), by Country 2024 & 2032
- Figure 39: Latin America Optical Sorter Industry Revenue Share (%), by Country 2024 & 2032
- Figure 40: Middle East and Africa Optical Sorter Industry Revenue (Million), by Technology 2024 & 2032
- Figure 41: Middle East and Africa Optical Sorter Industry Revenue Share (%), by Technology 2024 & 2032
- Figure 42: Middle East and Africa Optical Sorter Industry Revenue (Million), by End-user Industries 2024 & 2032
- Figure 43: Middle East and Africa Optical Sorter Industry Revenue Share (%), by End-user Industries 2024 & 2032
- Figure 44: Middle East and Africa Optical Sorter Industry Revenue (Million), by Country 2024 & 2032
- Figure 45: Middle East and Africa Optical Sorter Industry Revenue Share (%), by Country 2024 & 2032
List of Tables
- Table 1: Global Optical Sorter Industry Revenue Million Forecast, by Region 2019 & 2032
- Table 2: Global Optical Sorter Industry Revenue Million Forecast, by Technology 2019 & 2032
- Table 3: Global Optical Sorter Industry Revenue Million Forecast, by End-user Industries 2019 & 2032
- Table 4: Global Optical Sorter Industry Revenue Million Forecast, by Region 2019 & 2032
- Table 5: Global Optical Sorter Industry Revenue Million Forecast, by Country 2019 & 2032
- Table 6: Optical Sorter Industry Revenue (Million) Forecast, by Application 2019 & 2032
- Table 7: Global Optical Sorter Industry Revenue Million Forecast, by Country 2019 & 2032
- Table 8: Optical Sorter Industry Revenue (Million) Forecast, by Application 2019 & 2032
- Table 9: Global Optical Sorter Industry Revenue Million Forecast, by Country 2019 & 2032
- Table 10: Optical Sorter Industry Revenue (Million) Forecast, by Application 2019 & 2032
- Table 11: Global Optical Sorter Industry Revenue Million Forecast, by Country 2019 & 2032
- Table 12: Optical Sorter Industry Revenue (Million) Forecast, by Application 2019 & 2032
- Table 13: Global Optical Sorter Industry Revenue Million Forecast, by Technology 2019 & 2032
- Table 14: Global Optical Sorter Industry Revenue Million Forecast, by End-user Industries 2019 & 2032
- Table 15: Global Optical Sorter Industry Revenue Million Forecast, by Country 2019 & 2032
- Table 16: Global Optical Sorter Industry Revenue Million Forecast, by Technology 2019 & 2032
- Table 17: Global Optical Sorter Industry Revenue Million Forecast, by End-user Industries 2019 & 2032
- Table 18: Global Optical Sorter Industry Revenue Million Forecast, by Country 2019 & 2032
- Table 19: Global Optical Sorter Industry Revenue Million Forecast, by Technology 2019 & 2032
- Table 20: Global Optical Sorter Industry Revenue Million Forecast, by End-user Industries 2019 & 2032
- Table 21: Global Optical Sorter Industry Revenue Million Forecast, by Country 2019 & 2032
- Table 22: Global Optical Sorter Industry Revenue Million Forecast, by Technology 2019 & 2032
- Table 23: Global Optical Sorter Industry Revenue Million Forecast, by End-user Industries 2019 & 2032
- Table 24: Global Optical Sorter Industry Revenue Million Forecast, by Country 2019 & 2032
- Table 25: Global Optical Sorter Industry Revenue Million Forecast, by Technology 2019 & 2032
- Table 26: Global Optical Sorter Industry Revenue Million Forecast, by End-user Industries 2019 & 2032
- Table 27: Global Optical Sorter Industry Revenue Million Forecast, by Country 2019 & 2032
- Table 28: Global Optical Sorter Industry Revenue Million Forecast, by Technology 2019 & 2032
- Table 29: Global Optical Sorter Industry Revenue Million Forecast, by End-user Industries 2019 & 2032
- Table 30: Global Optical Sorter Industry Revenue Million Forecast, by Country 2019 & 2032
Frequently Asked Questions
1. What is the projected Compound Annual Growth Rate (CAGR) of the Optical Sorter Industry?
The projected CAGR is approximately 10.00%.
2. Which companies are prominent players in the Optical Sorter Industry?
Key companies in the market include Cimbria AS (AGCO Corporation), Van Wamel BV, Raytec Vision SpA, Machinex Industries Inc, KEN Bratney Co, TOMRA Systems ASA, Eagle Vizion Inc, Satake Corporation, Key Technology Inc ( Duravant LLC), Bhler Holding AG, National Recovery Technologies LLC, Hefei Meyer Optoelectronic Technology Inc, MSS Inc (CP Manufacturing Inc ), Sesotec GmbH*List Not Exhaustive.
3. What are the main segments of the Optical Sorter Industry?
The market segments include Technology, End-user Industries.
4. Can you provide details about the market size?
The market size is estimated to be USD XX Million as of 2022.
5. What are some drivers contributing to market growth?
Increasing Demand for Reducing the Delivery and Processing Time; Stringent Regulations Regarding the Food Quality and Labor Costs.
6. What are the notable trends driving market growth?
Food Industry is Expected to Gain Demand Momentum Owing to Evolving Regulations.
7. Are there any restraints impacting market growth?
High Deployment and Maintenance Costs; Real-time Technical Challenges and the Need for Skilled Workforce.
8. Can you provide examples of recent developments in the market?
November 2022: Key Technology Inc. launched its Herbert OCULUS whole potato optical sorter and showcased its range of other high-performance solutions for fresh and processed potatoes and vegetables. These sorters identify and remove potatoes with defects and diseases, as well as potatoes outside the specified length and width profile if desired.
9. What pricing options are available for accessing the report?
Pricing options include single-user, multi-user, and enterprise licenses priced at USD 4750, USD 5250, and USD 8750 respectively.
10. Is the market size provided in terms of value or volume?
The market size is provided in terms of value, measured in Million.
11. Are there any specific market keywords associated with the report?
Yes, the market keyword associated with the report is "Optical Sorter Industry," which aids in identifying and referencing the specific market segment covered.
12. How do I determine which pricing option suits my needs best?
The pricing options vary based on user requirements and access needs. Individual users may opt for single-user licenses, while businesses requiring broader access may choose multi-user or enterprise licenses for cost-effective access to the report.
13. Are there any additional resources or data provided in the Optical Sorter Industry report?
While the report offers comprehensive insights, it's advisable to review the specific contents or supplementary materials provided to ascertain if additional resources or data are available.
14. How can I stay updated on further developments or reports in the Optical Sorter Industry?
To stay informed about further developments, trends, and reports in the Optical Sorter Industry, consider subscribing to industry newsletters, following relevant companies and organizations, or regularly checking reputable industry news sources and publications.
Methodology
Step 1 - Identification of Relevant Samples Size from Population Database


Step 2 - Approaches for Defining Global Market Size (Value, Volume* & Price*)

Note*: In applicable scenarios
Step 3 - Data Sources
Primary Research
- Web Analytics
- Survey Reports
- Research Institute
- Latest Research Reports
- Opinion Leaders
Secondary Research
- Annual Reports
- White Paper
- Latest Press Release
- Industry Association
- Paid Database
- Investor Presentations

Step 4 - Data Triangulation
Involves using different sources of information in order to increase the validity of a study
These sources are likely to be stakeholders in a program - participants, other researchers, program staff, other community members, and so on.
Then we put all data in single framework & apply various statistical tools to find out the dynamic on the market.
During the analysis stage, feedback from the stakeholder groups would be compared to determine areas of agreement as well as areas of divergence


