
Key Insights
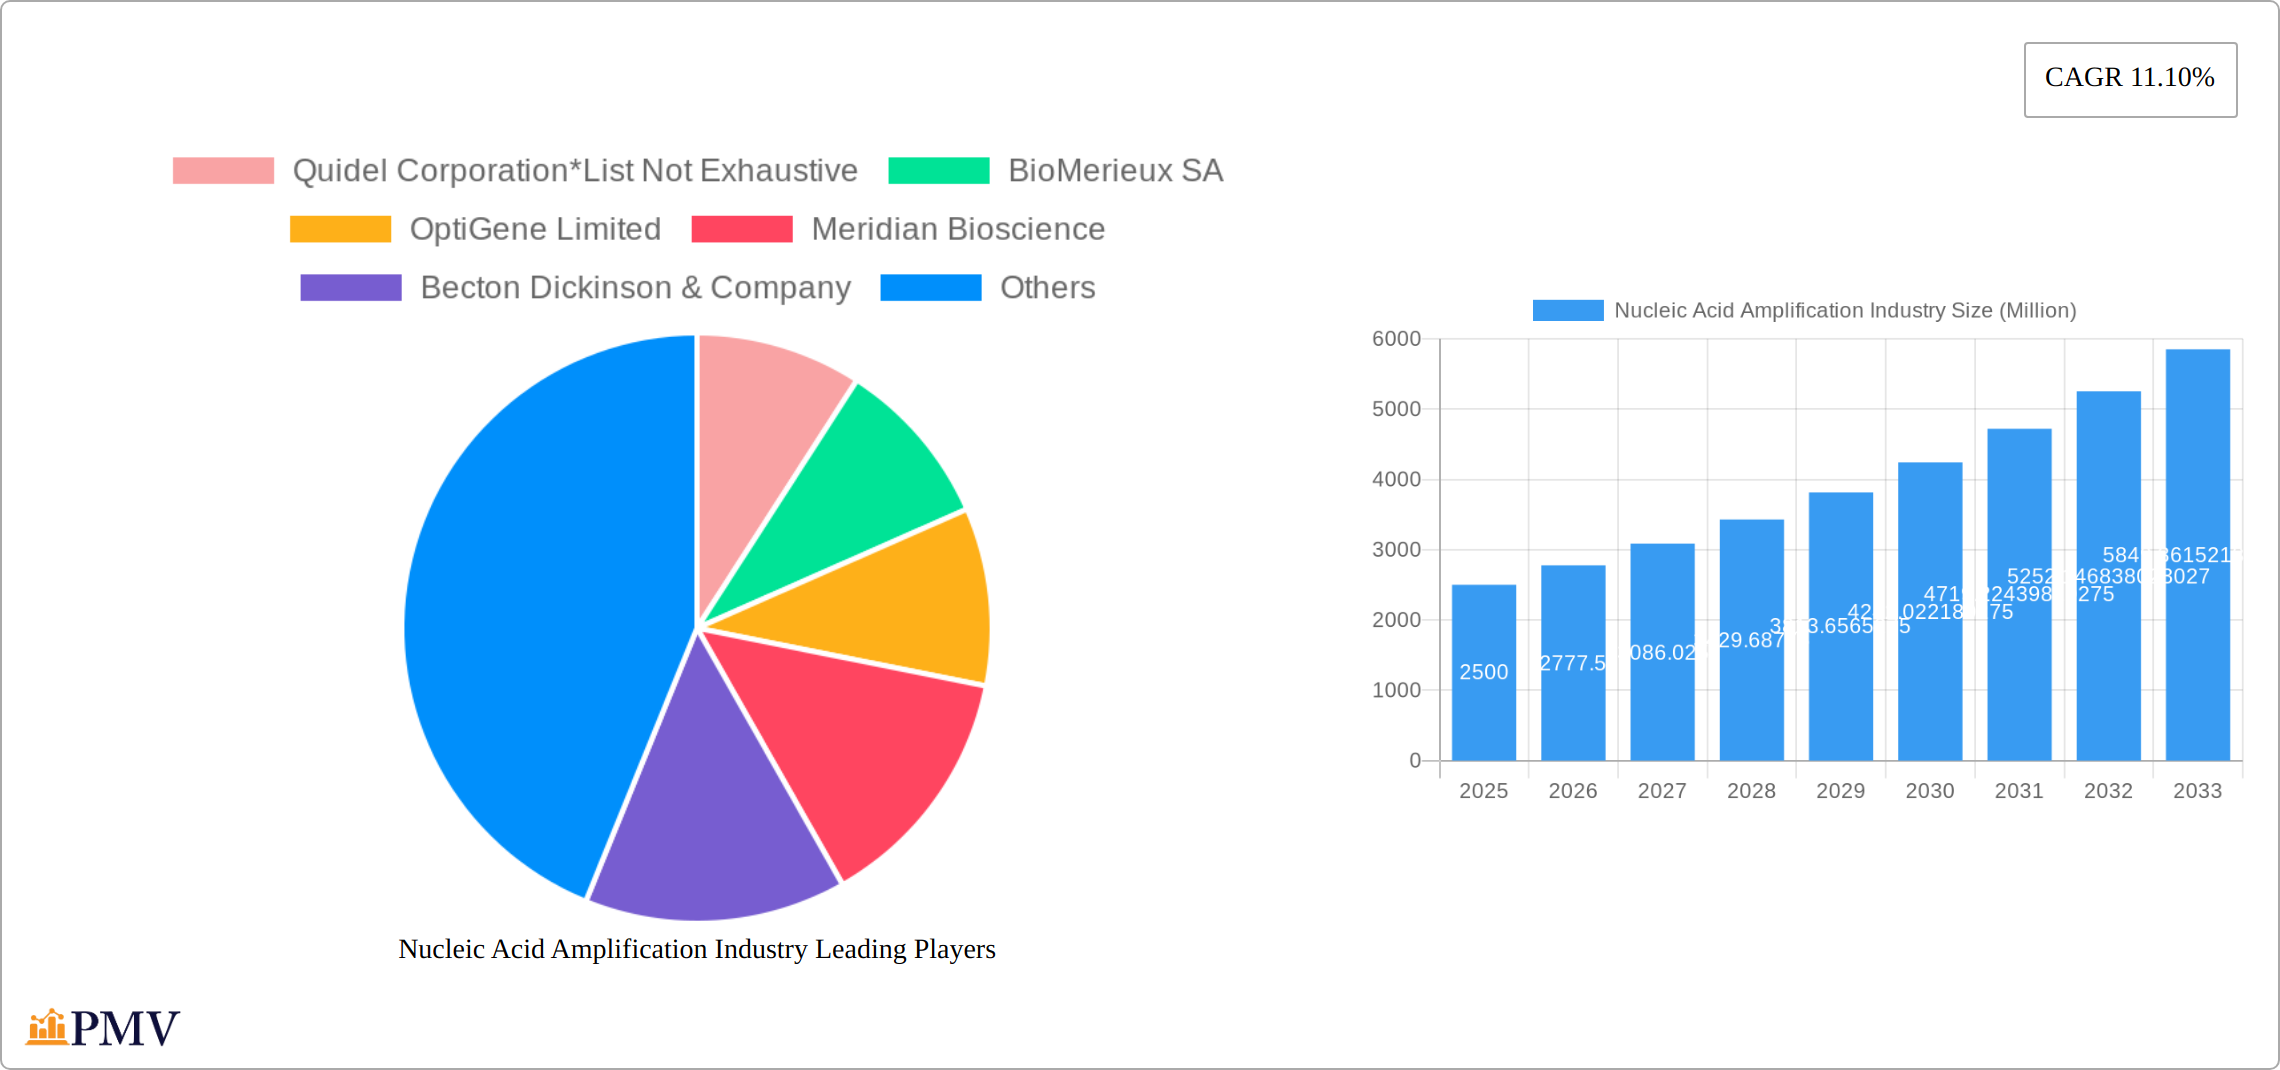
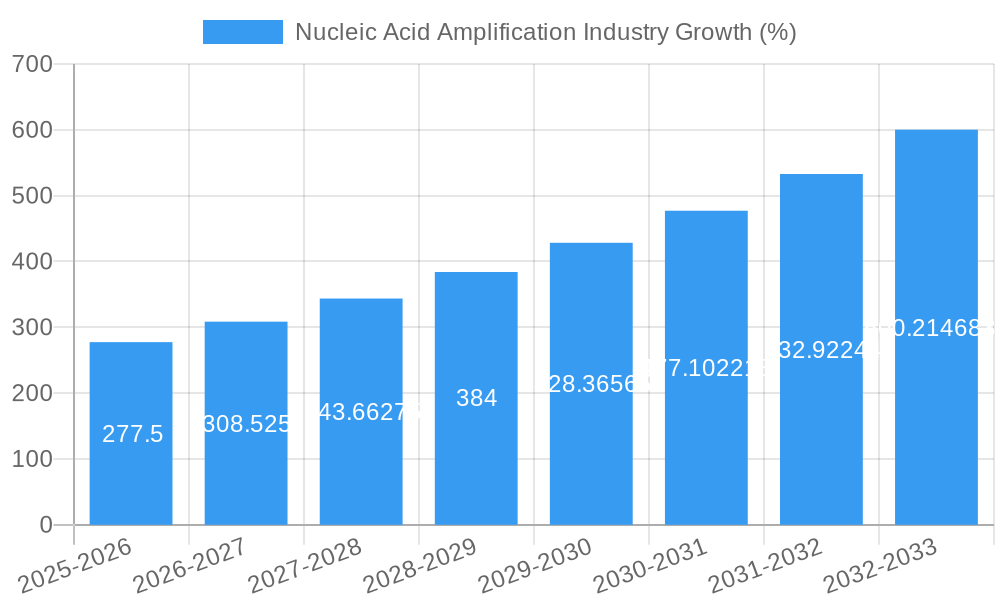
The Nucleic Acid Amplification (NAA) market is experiencing robust growth, projected to reach a substantial size driven by increasing demand for rapid diagnostic testing, advancements in molecular diagnostic technologies, and rising prevalence of infectious diseases. The market's Compound Annual Growth Rate (CAGR) of 11.10% from 2019 to 2024 indicates a significant upward trajectory. This growth is fueled by several key factors. Firstly, the development of more sensitive and specific NAA methods like LAMP and NEAR, enabling faster and more accurate detection of pathogens, is a major driver. Secondly, the increasing adoption of point-of-care diagnostics, particularly in resource-limited settings, further stimulates market expansion. Finally, ongoing research and development efforts focused on improving assay speed, reducing costs, and enhancing the portability of NAA instruments contribute to the market's dynamism. Major players like Quidel Corporation, BioMerieux SA, and Qiagen NV are actively shaping the market landscape through continuous innovation and strategic acquisitions.
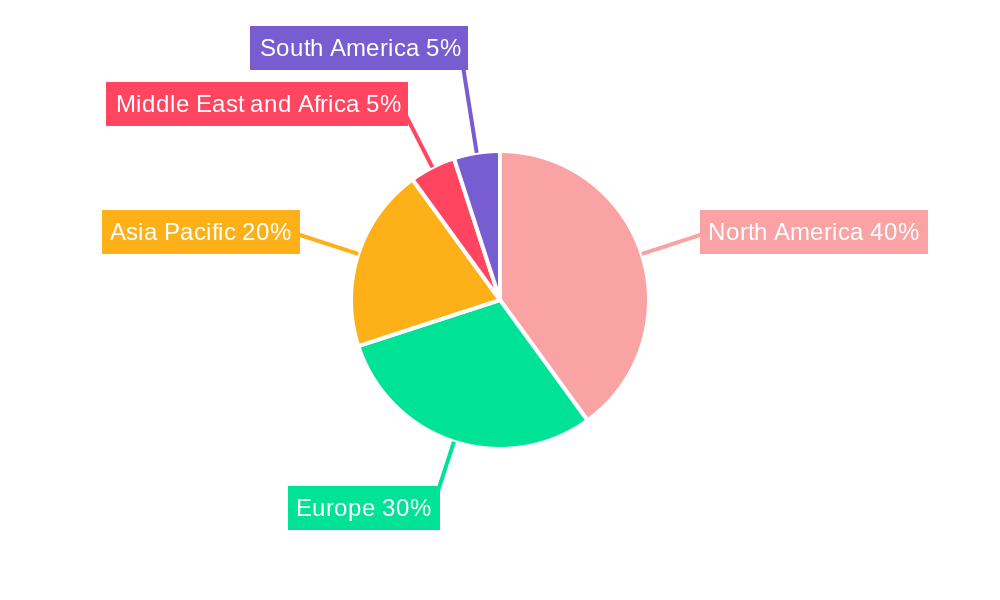
Segment-wise, the instruments segment is expected to hold a larger market share compared to reagents, primarily due to the high initial investment required for advanced amplification systems. Among the technologies, Helicase-dependent Amplification (HDA) and Loop-mediated Isothermal Amplification (LAMP) are expected to witness significant growth owing to their superior speed and simplicity. Geographically, North America currently dominates the market, driven by strong healthcare infrastructure and high adoption of advanced diagnostic technologies. However, Asia Pacific is poised for significant growth in the coming years due to rising healthcare expenditure and increasing prevalence of infectious diseases in the region. This makes the NAA market an attractive investment opportunity for companies seeking to capitalize on the growing need for rapid, accurate, and cost-effective diagnostic solutions. The market will continue to be shaped by technological advancements, regulatory approvals, and the evolving landscape of infectious disease management.
Nucleic Acid Amplification Industry: A Comprehensive Market Report (2019-2033)
This comprehensive report provides an in-depth analysis of the Nucleic Acid Amplification (NAA) industry, encompassing market size, growth drivers, competitive landscape, and future outlook. The study period spans from 2019 to 2033, with 2025 serving as the base and estimated year. The forecast period covers 2025-2033, and the historical period encompasses 2019-2024. Key players like Quidel Corporation, BioMerieux SA, and Qiagen NV are profiled, along with a detailed segmentation by technology, product, and end-user. The report is essential for investors, industry professionals, and researchers seeking a complete understanding of this rapidly evolving market, projected to reach xx Million by 2033.
Nucleic Acid Amplification Industry Market Structure & Competitive Dynamics
The Nucleic Acid Amplification (NAA) industry presents a moderately concentrated market structure, with several key players commanding significant market share. This dynamic landscape is characterized by continuous innovation, fueled by the persistent need for faster, more accurate, and cost-effective diagnostic tools. Stringent regulatory frameworks, especially those governing in-vitro diagnostics (IVDs), profoundly influence market behavior and competitiveness. Product substitution presents a competitive factor, with advancements in alternative diagnostic technologies exerting pressure. Crucially, end-user trends, particularly the escalating demand for point-of-care diagnostics and personalized medicine, are pivotal in shaping market expansion. Mergers and acquisitions (M&A) remain a prominent feature, with recent years witnessing substantial deal values (e.g., transactions in the range of [Insert Specific Value Range] Million). This activity often involves larger entities acquiring smaller companies specializing in niche NAA technologies to broaden their product portfolios and market reach. The competitive landscape is further shaped by factors such as pricing strategies, intellectual property rights, and the ongoing development of novel amplification techniques.
- Market Concentration: Moderately concentrated, with the top 5 players holding approximately [Insert Specific Percentage]% market share in 2024.
- Innovation Ecosystems: Strong focus on isothermal amplification techniques like LAMP and RPA, and the development of sophisticated multiplex assays enabling simultaneous detection of multiple targets. This also includes advancements in digital PCR for improved sensitivity and quantification.
- Regulatory Frameworks: Stringent regulatory approvals (e.g., FDA, EMA, etc.) for IVD products significantly influence market entry barriers, product lifecycle management, and overall market dynamics.
- M&A Activity: Significant activity observed between 2020-2024, with deal values averaging [Insert Specific Average Value] Million, reflecting strategic consolidation and expansion within the sector.
Nucleic Acid Amplification Industry Industry Trends & Insights
The Nucleic Acid Amplification industry is experiencing robust growth, driven by the rising prevalence of infectious diseases, increasing demand for rapid diagnostics, and advancements in molecular biology techniques. The market is witnessing a shift towards isothermal amplification technologies due to their simplicity, cost-effectiveness, and portability, leading to increased point-of-care testing. Consumer preferences are increasingly focusing on rapid results, ease of use, and improved accuracy. The competitive landscape is characterized by both established players and emerging companies vying for market share through product innovation, strategic partnerships, and acquisitions. The market is expected to exhibit a CAGR of xx% during the forecast period (2025-2033), with a market penetration of approximately xx% by 2033 in key regions.
Dominant Markets & Segments in Nucleic Acid Amplification Industry
The NAA market demonstrates geographical diversity, with North America and Europe currently holding leading positions. However, the Asia-Pacific region is exhibiting substantial growth potential driven by escalating healthcare expenditure, the rising prevalence of infectious diseases, and increasing investments in diagnostic infrastructure. Within the technology segments, Loop-mediated Isothermal Amplification (LAMP) and Nucleic Acid Sequence-based Amplification (NASBA) remain highly sought-after due to their speed, simplicity, and cost-effectiveness. While reagents are crucial, the instruments segment commands a higher market value, reflecting the significant cost associated with advanced instrumentation and its role in enabling high-throughput testing and automation. Hospitals represent the primary end-users, followed by research laboratories and other specialized clinical settings.
Key Drivers by Region:
- North America: High healthcare spending, robust research infrastructure, early adoption of advanced technologies, and a strong regulatory framework conducive to innovation.
- Europe: Significant investment in healthcare R&D, a high prevalence of infectious diseases, and stringent regulatory standards driving the adoption of high-quality diagnostic solutions.
- Asia-Pacific: Rapidly expanding healthcare sector, increasing prevalence of infectious diseases, rising disposable incomes driving healthcare access, and governmental initiatives aimed at strengthening diagnostic capabilities.
Dominant Segments:
- By Technology: LAMP, NASBA, and increasingly, CRISPR-based technologies.
- By Product: Instruments (including integrated systems and portable devices), followed by reagents and consumables.
- By End-User: Hospitals, clinical diagnostic laboratories, research institutions, and point-of-care settings (e.g., physician offices, pharmacies).
Nucleic Acid Amplification Industry Product Innovations
Recent advancements in NAA technologies prioritize enhanced speed, sensitivity, portability, and ease of use. Miniaturization of devices, the integration of multiple functionalities into single systems, and intuitive user interfaces are defining trends. The development of multiplex assays capable of simultaneously detecting numerous pathogens is significantly driving market growth. These innovations directly address the increasing demand for rapid, precise, and cost-effective diagnostics across diverse settings, encompassing point-of-care applications, remote areas with limited infrastructure, and high-throughput centralized laboratories. The incorporation of digital technologies and AI/ML for data analysis and interpretation is also gaining traction.
Report Segmentation & Scope
This report provides a comprehensive segmentation of the Nucleic Acid Amplification market, analyzing it across technology (HDA, NEAR, LAMP, SDA, NASBA, TMA, SPIA, Other), product (instruments, reagents, consumables), and end-user (hospitals, research laboratories, clinics, point-of-care settings, etc.). Detailed growth projections, market size estimations, and competitive landscape analyses are provided for each segment. The report highlights the rapid growth of the LAMP technology segment, attributed to its ease of use and cost-effectiveness. The instruments segment is anticipated to maintain a larger market share compared to reagents, driven by technological advancements and the demand for sophisticated and integrated systems. Hospitals and clinical diagnostic laboratories are expected to remain the dominant end-user segments.
Key Drivers of Nucleic Acid Amplification Industry Growth
Several key factors are propelling the growth of the Nucleic Acid Amplification industry. Technological advancements, particularly the development of highly sensitive and rapid amplification methods like LAMP, RPA and CRISPR-based technologies, are driving increased adoption. The global surge in infectious diseases, coupled with the demand for rapid and accurate diagnostics, creates substantial market opportunities. Furthermore, supportive government policies, funding initiatives promoting research and development in this area, and the increasing prevalence of chronic diseases necessitating advanced diagnostic tools contribute significantly to market expansion. The ongoing need for improved pandemic preparedness and the potential for personalized medicine applications also play a substantial role.
Challenges in the Nucleic Acid Amplification Industry Sector
The Nucleic Acid Amplification industry faces certain challenges. Stringent regulatory approvals and the high cost of developing and validating new assays can hinder market entry. Supply chain disruptions can impact the availability of key reagents and instruments. Furthermore, competition from alternative diagnostic technologies poses a threat to market share, requiring continuous innovation and improvement. The overall impact of these challenges is an estimated xx% reduction in market growth during the forecast period.
Leading Players in the Nucleic Acid Amplification Industry Market
- Quidel Corporation
- BioMerieux SA
- OptiGene Limited
- Meridian Bioscience
- Becton Dickinson & Company
- Tecan Genomics Inc
- Lucigen
- Qiagen NV
- Eiken Chemical Co Ltd
Key Developments in Nucleic Acid Amplification Industry Sector
- August 2022: LGC Clinical Diagnostics extended its collaboration with Stanford Medicine, boosting global genetic and metabolic diagnostic testing.
- May 2022: Meridian Bioscience launched two new isothermal amplification products for point-of-care diagnostics.
Strategic Nucleic Acid Amplification Industry Market Outlook
The Nucleic Acid Amplification market is poised for continued growth, driven by ongoing technological innovations, expanding applications in various fields (e.g., infectious disease diagnostics, oncology), and increasing demand for rapid and accurate diagnostics globally. Strategic opportunities lie in developing portable, user-friendly devices, expanding into emerging markets, and focusing on the development of multiplex assays. The future of the NAA market is bright, with significant potential for expansion and innovation.
Nucleic Acid Amplification Industry Segmentation
-
1. Technology
- 1.1. Helicase-dependent Amplification (HDA)
- 1.2. Nicking Enzyme Amplification Reaction (NEAR)
- 1.3. Loop-mediated Isothermal Amplification (LAMP)
- 1.4. Strand Displacement Amplification (SDA)
- 1.5. Nucleic Acid Sequence-based Amplification (NASBA)
- 1.6. Transcription Mediated Amplification (TMA)
- 1.7. Single Primer Isothermal Amplification (SPIA)
- 1.8. Other Technologies
-
2. Product
- 2.1. Instruments
- 2.2. Reagents
-
3. End-User
- 3.1. Hospitals
- 3.2. Research Laboratories
- 3.3. Other End-Users
Nucleic Acid Amplification Industry Segmentation By Geography
-
1. North America
- 1.1. United States
- 1.2. Canada
- 1.3. Mexico
-
2. Europe
- 2.1. Germany
- 2.2. United Kingdom
- 2.3. France
- 2.4. Italy
- 2.5. Spain
- 2.6. Rest of Europe
-
3. Asia Pacific
- 3.1. China
- 3.2. Japan
- 3.3. India
- 3.4. Australia
- 3.5. South Korea
- 3.6. Rest of Asia Pacific
-
4. Middle East and Africa
- 4.1. GCC
- 4.2. South Africa
- 4.3. Rest of Middle East and Africa
-
5. South America
- 5.1. Brazil
- 5.2. Argentina
- 5.3. Rest of South America
Nucleic Acid Amplification Industry REPORT HIGHLIGHTS
| Aspects | Details |
|---|---|
| Study Period | 2019-2033 |
| Base Year | 2024 |
| Estimated Year | 2025 |
| Forecast Period | 2025-2033 |
| Historical Period | 2019-2024 |
| Growth Rate | CAGR of 11.10% from 2019-2033 |
| Segmentation |
|
Table of Contents
- 1. Introduction
- 1.1. Research Scope
- 1.2. Market Segmentation
- 1.3. Research Methodology
- 1.4. Definitions and Assumptions
- 2. Executive Summary
- 2.1. Introduction
- 3. Market Dynamics
- 3.1. Introduction
- 3.2. Market Drivers
- 3.2.1. Increasing Incidences of Chronic Diseases And Aging Population; Increase in the Adoption of INAAT Over PCR; Rise In The Miniaturization of Nucleic Acid-based Diagnostics; Rise In Demand for Low-cost And Effective Diagnostics Procedures
- 3.3. Market Restrains
- 3.3.1. Threatening Opposition from PCR Technologies; Lack of Awareness about New Diagnostics Technologies
- 3.4. Market Trends
- 3.4.1. Loop-mediated Isothermal Amplification (LAMP) Segment is Expected to Hold a Major Market Share in the Isothermal Nucleic Acid Amplification Technology (INAAT) Market
- 4. Market Factor Analysis
- 4.1. Porters Five Forces
- 4.2. Supply/Value Chain
- 4.3. PESTEL analysis
- 4.4. Market Entropy
- 4.5. Patent/Trademark Analysis
- 5. Global Nucleic Acid Amplification Industry Analysis, Insights and Forecast, 2019-2031
- 5.1. Market Analysis, Insights and Forecast - by Technology
- 5.1.1. Helicase-dependent Amplification (HDA)
- 5.1.2. Nicking Enzyme Amplification Reaction (NEAR)
- 5.1.3. Loop-mediated Isothermal Amplification (LAMP)
- 5.1.4. Strand Displacement Amplification (SDA)
- 5.1.5. Nucleic Acid Sequence-based Amplification (NASBA)
- 5.1.6. Transcription Mediated Amplification (TMA)
- 5.1.7. Single Primer Isothermal Amplification (SPIA)
- 5.1.8. Other Technologies
- 5.2. Market Analysis, Insights and Forecast - by Product
- 5.2.1. Instruments
- 5.2.2. Reagents
- 5.3. Market Analysis, Insights and Forecast - by End-User
- 5.3.1. Hospitals
- 5.3.2. Research Laboratories
- 5.3.3. Other End-Users
- 5.4. Market Analysis, Insights and Forecast - by Region
- 5.4.1. North America
- 5.4.2. Europe
- 5.4.3. Asia Pacific
- 5.4.4. Middle East and Africa
- 5.4.5. South America
- 5.1. Market Analysis, Insights and Forecast - by Technology
- 6. North America Nucleic Acid Amplification Industry Analysis, Insights and Forecast, 2019-2031
- 6.1. Market Analysis, Insights and Forecast - by Technology
- 6.1.1. Helicase-dependent Amplification (HDA)
- 6.1.2. Nicking Enzyme Amplification Reaction (NEAR)
- 6.1.3. Loop-mediated Isothermal Amplification (LAMP)
- 6.1.4. Strand Displacement Amplification (SDA)
- 6.1.5. Nucleic Acid Sequence-based Amplification (NASBA)
- 6.1.6. Transcription Mediated Amplification (TMA)
- 6.1.7. Single Primer Isothermal Amplification (SPIA)
- 6.1.8. Other Technologies
- 6.2. Market Analysis, Insights and Forecast - by Product
- 6.2.1. Instruments
- 6.2.2. Reagents
- 6.3. Market Analysis, Insights and Forecast - by End-User
- 6.3.1. Hospitals
- 6.3.2. Research Laboratories
- 6.3.3. Other End-Users
- 6.1. Market Analysis, Insights and Forecast - by Technology
- 7. Europe Nucleic Acid Amplification Industry Analysis, Insights and Forecast, 2019-2031
- 7.1. Market Analysis, Insights and Forecast - by Technology
- 7.1.1. Helicase-dependent Amplification (HDA)
- 7.1.2. Nicking Enzyme Amplification Reaction (NEAR)
- 7.1.3. Loop-mediated Isothermal Amplification (LAMP)
- 7.1.4. Strand Displacement Amplification (SDA)
- 7.1.5. Nucleic Acid Sequence-based Amplification (NASBA)
- 7.1.6. Transcription Mediated Amplification (TMA)
- 7.1.7. Single Primer Isothermal Amplification (SPIA)
- 7.1.8. Other Technologies
- 7.2. Market Analysis, Insights and Forecast - by Product
- 7.2.1. Instruments
- 7.2.2. Reagents
- 7.3. Market Analysis, Insights and Forecast - by End-User
- 7.3.1. Hospitals
- 7.3.2. Research Laboratories
- 7.3.3. Other End-Users
- 7.1. Market Analysis, Insights and Forecast - by Technology
- 8. Asia Pacific Nucleic Acid Amplification Industry Analysis, Insights and Forecast, 2019-2031
- 8.1. Market Analysis, Insights and Forecast - by Technology
- 8.1.1. Helicase-dependent Amplification (HDA)
- 8.1.2. Nicking Enzyme Amplification Reaction (NEAR)
- 8.1.3. Loop-mediated Isothermal Amplification (LAMP)
- 8.1.4. Strand Displacement Amplification (SDA)
- 8.1.5. Nucleic Acid Sequence-based Amplification (NASBA)
- 8.1.6. Transcription Mediated Amplification (TMA)
- 8.1.7. Single Primer Isothermal Amplification (SPIA)
- 8.1.8. Other Technologies
- 8.2. Market Analysis, Insights and Forecast - by Product
- 8.2.1. Instruments
- 8.2.2. Reagents
- 8.3. Market Analysis, Insights and Forecast - by End-User
- 8.3.1. Hospitals
- 8.3.2. Research Laboratories
- 8.3.3. Other End-Users
- 8.1. Market Analysis, Insights and Forecast - by Technology
- 9. Middle East and Africa Nucleic Acid Amplification Industry Analysis, Insights and Forecast, 2019-2031
- 9.1. Market Analysis, Insights and Forecast - by Technology
- 9.1.1. Helicase-dependent Amplification (HDA)
- 9.1.2. Nicking Enzyme Amplification Reaction (NEAR)
- 9.1.3. Loop-mediated Isothermal Amplification (LAMP)
- 9.1.4. Strand Displacement Amplification (SDA)
- 9.1.5. Nucleic Acid Sequence-based Amplification (NASBA)
- 9.1.6. Transcription Mediated Amplification (TMA)
- 9.1.7. Single Primer Isothermal Amplification (SPIA)
- 9.1.8. Other Technologies
- 9.2. Market Analysis, Insights and Forecast - by Product
- 9.2.1. Instruments
- 9.2.2. Reagents
- 9.3. Market Analysis, Insights and Forecast - by End-User
- 9.3.1. Hospitals
- 9.3.2. Research Laboratories
- 9.3.3. Other End-Users
- 9.1. Market Analysis, Insights and Forecast - by Technology
- 10. South America Nucleic Acid Amplification Industry Analysis, Insights and Forecast, 2019-2031
- 10.1. Market Analysis, Insights and Forecast - by Technology
- 10.1.1. Helicase-dependent Amplification (HDA)
- 10.1.2. Nicking Enzyme Amplification Reaction (NEAR)
- 10.1.3. Loop-mediated Isothermal Amplification (LAMP)
- 10.1.4. Strand Displacement Amplification (SDA)
- 10.1.5. Nucleic Acid Sequence-based Amplification (NASBA)
- 10.1.6. Transcription Mediated Amplification (TMA)
- 10.1.7. Single Primer Isothermal Amplification (SPIA)
- 10.1.8. Other Technologies
- 10.2. Market Analysis, Insights and Forecast - by Product
- 10.2.1. Instruments
- 10.2.2. Reagents
- 10.3. Market Analysis, Insights and Forecast - by End-User
- 10.3.1. Hospitals
- 10.3.2. Research Laboratories
- 10.3.3. Other End-Users
- 10.1. Market Analysis, Insights and Forecast - by Technology
- 11. North America Nucleic Acid Amplification Industry Analysis, Insights and Forecast, 2019-2031
- 11.1. Market Analysis, Insights and Forecast - By Country/Sub-region
- 11.1.1 United States
- 11.1.2 Canada
- 11.1.3 Mexico
- 12. Europe Nucleic Acid Amplification Industry Analysis, Insights and Forecast, 2019-2031
- 12.1. Market Analysis, Insights and Forecast - By Country/Sub-region
- 12.1.1 Germany
- 12.1.2 United Kingdom
- 12.1.3 France
- 12.1.4 Italy
- 12.1.5 Spain
- 12.1.6 Rest of Europe
- 13. Asia Pacific Nucleic Acid Amplification Industry Analysis, Insights and Forecast, 2019-2031
- 13.1. Market Analysis, Insights and Forecast - By Country/Sub-region
- 13.1.1 China
- 13.1.2 Japan
- 13.1.3 India
- 13.1.4 Australia
- 13.1.5 South Korea
- 13.1.6 Rest of Asia Pacific
- 14. Middle East and Africa Nucleic Acid Amplification Industry Analysis, Insights and Forecast, 2019-2031
- 14.1. Market Analysis, Insights and Forecast - By Country/Sub-region
- 14.1.1 GCC
- 14.1.2 South Africa
- 14.1.3 Rest of Middle East and Africa
- 15. South America Nucleic Acid Amplification Industry Analysis, Insights and Forecast, 2019-2031
- 15.1. Market Analysis, Insights and Forecast - By Country/Sub-region
- 15.1.1 Brazil
- 15.1.2 Argentina
- 15.1.3 Rest of South America
- 16. Competitive Analysis
- 16.1. Global Market Share Analysis 2024
- 16.2. Company Profiles
- 16.2.1 Quidel Corporation*List Not Exhaustive
- 16.2.1.1. Overview
- 16.2.1.2. Products
- 16.2.1.3. SWOT Analysis
- 16.2.1.4. Recent Developments
- 16.2.1.5. Financials (Based on Availability)
- 16.2.2 BioMerieux SA
- 16.2.2.1. Overview
- 16.2.2.2. Products
- 16.2.2.3. SWOT Analysis
- 16.2.2.4. Recent Developments
- 16.2.2.5. Financials (Based on Availability)
- 16.2.3 OptiGene Limited
- 16.2.3.1. Overview
- 16.2.3.2. Products
- 16.2.3.3. SWOT Analysis
- 16.2.3.4. Recent Developments
- 16.2.3.5. Financials (Based on Availability)
- 16.2.4 Meridian Bioscience
- 16.2.4.1. Overview
- 16.2.4.2. Products
- 16.2.4.3. SWOT Analysis
- 16.2.4.4. Recent Developments
- 16.2.4.5. Financials (Based on Availability)
- 16.2.5 Becton Dickinson & Company
- 16.2.5.1. Overview
- 16.2.5.2. Products
- 16.2.5.3. SWOT Analysis
- 16.2.5.4. Recent Developments
- 16.2.5.5. Financials (Based on Availability)
- 16.2.6 Tecan Genomics Inc
- 16.2.6.1. Overview
- 16.2.6.2. Products
- 16.2.6.3. SWOT Analysis
- 16.2.6.4. Recent Developments
- 16.2.6.5. Financials (Based on Availability)
- 16.2.7 Lucigen
- 16.2.7.1. Overview
- 16.2.7.2. Products
- 16.2.7.3. SWOT Analysis
- 16.2.7.4. Recent Developments
- 16.2.7.5. Financials (Based on Availability)
- 16.2.8 Qiagen NV
- 16.2.8.1. Overview
- 16.2.8.2. Products
- 16.2.8.3. SWOT Analysis
- 16.2.8.4. Recent Developments
- 16.2.8.5. Financials (Based on Availability)
- 16.2.9 Eiken Chemical Co Ltd
- 16.2.9.1. Overview
- 16.2.9.2. Products
- 16.2.9.3. SWOT Analysis
- 16.2.9.4. Recent Developments
- 16.2.9.5. Financials (Based on Availability)
- 16.2.1 Quidel Corporation*List Not Exhaustive
List of Figures
- Figure 1: Global Nucleic Acid Amplification Industry Revenue Breakdown (Million, %) by Region 2024 & 2032
- Figure 2: North America Nucleic Acid Amplification Industry Revenue (Million), by Country 2024 & 2032
- Figure 3: North America Nucleic Acid Amplification Industry Revenue Share (%), by Country 2024 & 2032
- Figure 4: Europe Nucleic Acid Amplification Industry Revenue (Million), by Country 2024 & 2032
- Figure 5: Europe Nucleic Acid Amplification Industry Revenue Share (%), by Country 2024 & 2032
- Figure 6: Asia Pacific Nucleic Acid Amplification Industry Revenue (Million), by Country 2024 & 2032
- Figure 7: Asia Pacific Nucleic Acid Amplification Industry Revenue Share (%), by Country 2024 & 2032
- Figure 8: Middle East and Africa Nucleic Acid Amplification Industry Revenue (Million), by Country 2024 & 2032
- Figure 9: Middle East and Africa Nucleic Acid Amplification Industry Revenue Share (%), by Country 2024 & 2032
- Figure 10: South America Nucleic Acid Amplification Industry Revenue (Million), by Country 2024 & 2032
- Figure 11: South America Nucleic Acid Amplification Industry Revenue Share (%), by Country 2024 & 2032
- Figure 12: North America Nucleic Acid Amplification Industry Revenue (Million), by Technology 2024 & 2032
- Figure 13: North America Nucleic Acid Amplification Industry Revenue Share (%), by Technology 2024 & 2032
- Figure 14: North America Nucleic Acid Amplification Industry Revenue (Million), by Product 2024 & 2032
- Figure 15: North America Nucleic Acid Amplification Industry Revenue Share (%), by Product 2024 & 2032
- Figure 16: North America Nucleic Acid Amplification Industry Revenue (Million), by End-User 2024 & 2032
- Figure 17: North America Nucleic Acid Amplification Industry Revenue Share (%), by End-User 2024 & 2032
- Figure 18: North America Nucleic Acid Amplification Industry Revenue (Million), by Country 2024 & 2032
- Figure 19: North America Nucleic Acid Amplification Industry Revenue Share (%), by Country 2024 & 2032
- Figure 20: Europe Nucleic Acid Amplification Industry Revenue (Million), by Technology 2024 & 2032
- Figure 21: Europe Nucleic Acid Amplification Industry Revenue Share (%), by Technology 2024 & 2032
- Figure 22: Europe Nucleic Acid Amplification Industry Revenue (Million), by Product 2024 & 2032
- Figure 23: Europe Nucleic Acid Amplification Industry Revenue Share (%), by Product 2024 & 2032
- Figure 24: Europe Nucleic Acid Amplification Industry Revenue (Million), by End-User 2024 & 2032
- Figure 25: Europe Nucleic Acid Amplification Industry Revenue Share (%), by End-User 2024 & 2032
- Figure 26: Europe Nucleic Acid Amplification Industry Revenue (Million), by Country 2024 & 2032
- Figure 27: Europe Nucleic Acid Amplification Industry Revenue Share (%), by Country 2024 & 2032
- Figure 28: Asia Pacific Nucleic Acid Amplification Industry Revenue (Million), by Technology 2024 & 2032
- Figure 29: Asia Pacific Nucleic Acid Amplification Industry Revenue Share (%), by Technology 2024 & 2032
- Figure 30: Asia Pacific Nucleic Acid Amplification Industry Revenue (Million), by Product 2024 & 2032
- Figure 31: Asia Pacific Nucleic Acid Amplification Industry Revenue Share (%), by Product 2024 & 2032
- Figure 32: Asia Pacific Nucleic Acid Amplification Industry Revenue (Million), by End-User 2024 & 2032
- Figure 33: Asia Pacific Nucleic Acid Amplification Industry Revenue Share (%), by End-User 2024 & 2032
- Figure 34: Asia Pacific Nucleic Acid Amplification Industry Revenue (Million), by Country 2024 & 2032
- Figure 35: Asia Pacific Nucleic Acid Amplification Industry Revenue Share (%), by Country 2024 & 2032
- Figure 36: Middle East and Africa Nucleic Acid Amplification Industry Revenue (Million), by Technology 2024 & 2032
- Figure 37: Middle East and Africa Nucleic Acid Amplification Industry Revenue Share (%), by Technology 2024 & 2032
- Figure 38: Middle East and Africa Nucleic Acid Amplification Industry Revenue (Million), by Product 2024 & 2032
- Figure 39: Middle East and Africa Nucleic Acid Amplification Industry Revenue Share (%), by Product 2024 & 2032
- Figure 40: Middle East and Africa Nucleic Acid Amplification Industry Revenue (Million), by End-User 2024 & 2032
- Figure 41: Middle East and Africa Nucleic Acid Amplification Industry Revenue Share (%), by End-User 2024 & 2032
- Figure 42: Middle East and Africa Nucleic Acid Amplification Industry Revenue (Million), by Country 2024 & 2032
- Figure 43: Middle East and Africa Nucleic Acid Amplification Industry Revenue Share (%), by Country 2024 & 2032
- Figure 44: South America Nucleic Acid Amplification Industry Revenue (Million), by Technology 2024 & 2032
- Figure 45: South America Nucleic Acid Amplification Industry Revenue Share (%), by Technology 2024 & 2032
- Figure 46: South America Nucleic Acid Amplification Industry Revenue (Million), by Product 2024 & 2032
- Figure 47: South America Nucleic Acid Amplification Industry Revenue Share (%), by Product 2024 & 2032
- Figure 48: South America Nucleic Acid Amplification Industry Revenue (Million), by End-User 2024 & 2032
- Figure 49: South America Nucleic Acid Amplification Industry Revenue Share (%), by End-User 2024 & 2032
- Figure 50: South America Nucleic Acid Amplification Industry Revenue (Million), by Country 2024 & 2032
- Figure 51: South America Nucleic Acid Amplification Industry Revenue Share (%), by Country 2024 & 2032
List of Tables
- Table 1: Global Nucleic Acid Amplification Industry Revenue Million Forecast, by Region 2019 & 2032
- Table 2: Global Nucleic Acid Amplification Industry Revenue Million Forecast, by Technology 2019 & 2032
- Table 3: Global Nucleic Acid Amplification Industry Revenue Million Forecast, by Product 2019 & 2032
- Table 4: Global Nucleic Acid Amplification Industry Revenue Million Forecast, by End-User 2019 & 2032
- Table 5: Global Nucleic Acid Amplification Industry Revenue Million Forecast, by Region 2019 & 2032
- Table 6: Global Nucleic Acid Amplification Industry Revenue Million Forecast, by Country 2019 & 2032
- Table 7: United States Nucleic Acid Amplification Industry Revenue (Million) Forecast, by Application 2019 & 2032
- Table 8: Canada Nucleic Acid Amplification Industry Revenue (Million) Forecast, by Application 2019 & 2032
- Table 9: Mexico Nucleic Acid Amplification Industry Revenue (Million) Forecast, by Application 2019 & 2032
- Table 10: Global Nucleic Acid Amplification Industry Revenue Million Forecast, by Country 2019 & 2032
- Table 11: Germany Nucleic Acid Amplification Industry Revenue (Million) Forecast, by Application 2019 & 2032
- Table 12: United Kingdom Nucleic Acid Amplification Industry Revenue (Million) Forecast, by Application 2019 & 2032
- Table 13: France Nucleic Acid Amplification Industry Revenue (Million) Forecast, by Application 2019 & 2032
- Table 14: Italy Nucleic Acid Amplification Industry Revenue (Million) Forecast, by Application 2019 & 2032
- Table 15: Spain Nucleic Acid Amplification Industry Revenue (Million) Forecast, by Application 2019 & 2032
- Table 16: Rest of Europe Nucleic Acid Amplification Industry Revenue (Million) Forecast, by Application 2019 & 2032
- Table 17: Global Nucleic Acid Amplification Industry Revenue Million Forecast, by Country 2019 & 2032
- Table 18: China Nucleic Acid Amplification Industry Revenue (Million) Forecast, by Application 2019 & 2032
- Table 19: Japan Nucleic Acid Amplification Industry Revenue (Million) Forecast, by Application 2019 & 2032
- Table 20: India Nucleic Acid Amplification Industry Revenue (Million) Forecast, by Application 2019 & 2032
- Table 21: Australia Nucleic Acid Amplification Industry Revenue (Million) Forecast, by Application 2019 & 2032
- Table 22: South Korea Nucleic Acid Amplification Industry Revenue (Million) Forecast, by Application 2019 & 2032
- Table 23: Rest of Asia Pacific Nucleic Acid Amplification Industry Revenue (Million) Forecast, by Application 2019 & 2032
- Table 24: Global Nucleic Acid Amplification Industry Revenue Million Forecast, by Country 2019 & 2032
- Table 25: GCC Nucleic Acid Amplification Industry Revenue (Million) Forecast, by Application 2019 & 2032
- Table 26: South Africa Nucleic Acid Amplification Industry Revenue (Million) Forecast, by Application 2019 & 2032
- Table 27: Rest of Middle East and Africa Nucleic Acid Amplification Industry Revenue (Million) Forecast, by Application 2019 & 2032
- Table 28: Global Nucleic Acid Amplification Industry Revenue Million Forecast, by Country 2019 & 2032
- Table 29: Brazil Nucleic Acid Amplification Industry Revenue (Million) Forecast, by Application 2019 & 2032
- Table 30: Argentina Nucleic Acid Amplification Industry Revenue (Million) Forecast, by Application 2019 & 2032
- Table 31: Rest of South America Nucleic Acid Amplification Industry Revenue (Million) Forecast, by Application 2019 & 2032
- Table 32: Global Nucleic Acid Amplification Industry Revenue Million Forecast, by Technology 2019 & 2032
- Table 33: Global Nucleic Acid Amplification Industry Revenue Million Forecast, by Product 2019 & 2032
- Table 34: Global Nucleic Acid Amplification Industry Revenue Million Forecast, by End-User 2019 & 2032
- Table 35: Global Nucleic Acid Amplification Industry Revenue Million Forecast, by Country 2019 & 2032
- Table 36: United States Nucleic Acid Amplification Industry Revenue (Million) Forecast, by Application 2019 & 2032
- Table 37: Canada Nucleic Acid Amplification Industry Revenue (Million) Forecast, by Application 2019 & 2032
- Table 38: Mexico Nucleic Acid Amplification Industry Revenue (Million) Forecast, by Application 2019 & 2032
- Table 39: Global Nucleic Acid Amplification Industry Revenue Million Forecast, by Technology 2019 & 2032
- Table 40: Global Nucleic Acid Amplification Industry Revenue Million Forecast, by Product 2019 & 2032
- Table 41: Global Nucleic Acid Amplification Industry Revenue Million Forecast, by End-User 2019 & 2032
- Table 42: Global Nucleic Acid Amplification Industry Revenue Million Forecast, by Country 2019 & 2032
- Table 43: Germany Nucleic Acid Amplification Industry Revenue (Million) Forecast, by Application 2019 & 2032
- Table 44: United Kingdom Nucleic Acid Amplification Industry Revenue (Million) Forecast, by Application 2019 & 2032
- Table 45: France Nucleic Acid Amplification Industry Revenue (Million) Forecast, by Application 2019 & 2032
- Table 46: Italy Nucleic Acid Amplification Industry Revenue (Million) Forecast, by Application 2019 & 2032
- Table 47: Spain Nucleic Acid Amplification Industry Revenue (Million) Forecast, by Application 2019 & 2032
- Table 48: Rest of Europe Nucleic Acid Amplification Industry Revenue (Million) Forecast, by Application 2019 & 2032
- Table 49: Global Nucleic Acid Amplification Industry Revenue Million Forecast, by Technology 2019 & 2032
- Table 50: Global Nucleic Acid Amplification Industry Revenue Million Forecast, by Product 2019 & 2032
- Table 51: Global Nucleic Acid Amplification Industry Revenue Million Forecast, by End-User 2019 & 2032
- Table 52: Global Nucleic Acid Amplification Industry Revenue Million Forecast, by Country 2019 & 2032
- Table 53: China Nucleic Acid Amplification Industry Revenue (Million) Forecast, by Application 2019 & 2032
- Table 54: Japan Nucleic Acid Amplification Industry Revenue (Million) Forecast, by Application 2019 & 2032
- Table 55: India Nucleic Acid Amplification Industry Revenue (Million) Forecast, by Application 2019 & 2032
- Table 56: Australia Nucleic Acid Amplification Industry Revenue (Million) Forecast, by Application 2019 & 2032
- Table 57: South Korea Nucleic Acid Amplification Industry Revenue (Million) Forecast, by Application 2019 & 2032
- Table 58: Rest of Asia Pacific Nucleic Acid Amplification Industry Revenue (Million) Forecast, by Application 2019 & 2032
- Table 59: Global Nucleic Acid Amplification Industry Revenue Million Forecast, by Technology 2019 & 2032
- Table 60: Global Nucleic Acid Amplification Industry Revenue Million Forecast, by Product 2019 & 2032
- Table 61: Global Nucleic Acid Amplification Industry Revenue Million Forecast, by End-User 2019 & 2032
- Table 62: Global Nucleic Acid Amplification Industry Revenue Million Forecast, by Country 2019 & 2032
- Table 63: GCC Nucleic Acid Amplification Industry Revenue (Million) Forecast, by Application 2019 & 2032
- Table 64: South Africa Nucleic Acid Amplification Industry Revenue (Million) Forecast, by Application 2019 & 2032
- Table 65: Rest of Middle East and Africa Nucleic Acid Amplification Industry Revenue (Million) Forecast, by Application 2019 & 2032
- Table 66: Global Nucleic Acid Amplification Industry Revenue Million Forecast, by Technology 2019 & 2032
- Table 67: Global Nucleic Acid Amplification Industry Revenue Million Forecast, by Product 2019 & 2032
- Table 68: Global Nucleic Acid Amplification Industry Revenue Million Forecast, by End-User 2019 & 2032
- Table 69: Global Nucleic Acid Amplification Industry Revenue Million Forecast, by Country 2019 & 2032
- Table 70: Brazil Nucleic Acid Amplification Industry Revenue (Million) Forecast, by Application 2019 & 2032
- Table 71: Argentina Nucleic Acid Amplification Industry Revenue (Million) Forecast, by Application 2019 & 2032
- Table 72: Rest of South America Nucleic Acid Amplification Industry Revenue (Million) Forecast, by Application 2019 & 2032
Frequently Asked Questions
1. What is the projected Compound Annual Growth Rate (CAGR) of the Nucleic Acid Amplification Industry?
The projected CAGR is approximately 11.10%.
2. Which companies are prominent players in the Nucleic Acid Amplification Industry?
Key companies in the market include Quidel Corporation*List Not Exhaustive, BioMerieux SA, OptiGene Limited, Meridian Bioscience, Becton Dickinson & Company, Tecan Genomics Inc, Lucigen, Qiagen NV, Eiken Chemical Co Ltd.
3. What are the main segments of the Nucleic Acid Amplification Industry?
The market segments include Technology, Product, End-User.
4. Can you provide details about the market size?
The market size is estimated to be USD XX Million as of 2022.
5. What are some drivers contributing to market growth?
Increasing Incidences of Chronic Diseases And Aging Population; Increase in the Adoption of INAAT Over PCR; Rise In The Miniaturization of Nucleic Acid-based Diagnostics; Rise In Demand for Low-cost And Effective Diagnostics Procedures.
6. What are the notable trends driving market growth?
Loop-mediated Isothermal Amplification (LAMP) Segment is Expected to Hold a Major Market Share in the Isothermal Nucleic Acid Amplification Technology (INAAT) Market.
7. Are there any restraints impacting market growth?
Threatening Opposition from PCR Technologies; Lack of Awareness about New Diagnostics Technologies.
8. Can you provide examples of recent developments in the market?
In August 2022, LGC Clinical Diagnostics announced the extension of their exclusive collaboration with Stanford Medicine's Department of Obstetrics and Gynecology and Metabolic Health Center supporting global genetic and metabolic diagnostic testing.
9. What pricing options are available for accessing the report?
Pricing options include single-user, multi-user, and enterprise licenses priced at USD 4750, USD 5250, and USD 8750 respectively.
10. Is the market size provided in terms of value or volume?
The market size is provided in terms of value, measured in Million.
11. Are there any specific market keywords associated with the report?
Yes, the market keyword associated with the report is "Nucleic Acid Amplification Industry," which aids in identifying and referencing the specific market segment covered.
12. How do I determine which pricing option suits my needs best?
The pricing options vary based on user requirements and access needs. Individual users may opt for single-user licenses, while businesses requiring broader access may choose multi-user or enterprise licenses for cost-effective access to the report.
13. Are there any additional resources or data provided in the Nucleic Acid Amplification Industry report?
While the report offers comprehensive insights, it's advisable to review the specific contents or supplementary materials provided to ascertain if additional resources or data are available.
14. How can I stay updated on further developments or reports in the Nucleic Acid Amplification Industry?
To stay informed about further developments, trends, and reports in the Nucleic Acid Amplification Industry, consider subscribing to industry newsletters, following relevant companies and organizations, or regularly checking reputable industry news sources and publications.
Methodology
Step 1 - Identification of Relevant Samples Size from Population Database


Step 2 - Approaches for Defining Global Market Size (Value, Volume* & Price*)

Note*: In applicable scenarios
Step 3 - Data Sources
Primary Research
- Web Analytics
- Survey Reports
- Research Institute
- Latest Research Reports
- Opinion Leaders
Secondary Research
- Annual Reports
- White Paper
- Latest Press Release
- Industry Association
- Paid Database
- Investor Presentations

Step 4 - Data Triangulation
Involves using different sources of information in order to increase the validity of a study
These sources are likely to be stakeholders in a program - participants, other researchers, program staff, other community members, and so on.
Then we put all data in single framework & apply various statistical tools to find out the dynamic on the market.
During the analysis stage, feedback from the stakeholder groups would be compared to determine areas of agreement as well as areas of divergence


