
Key Insights
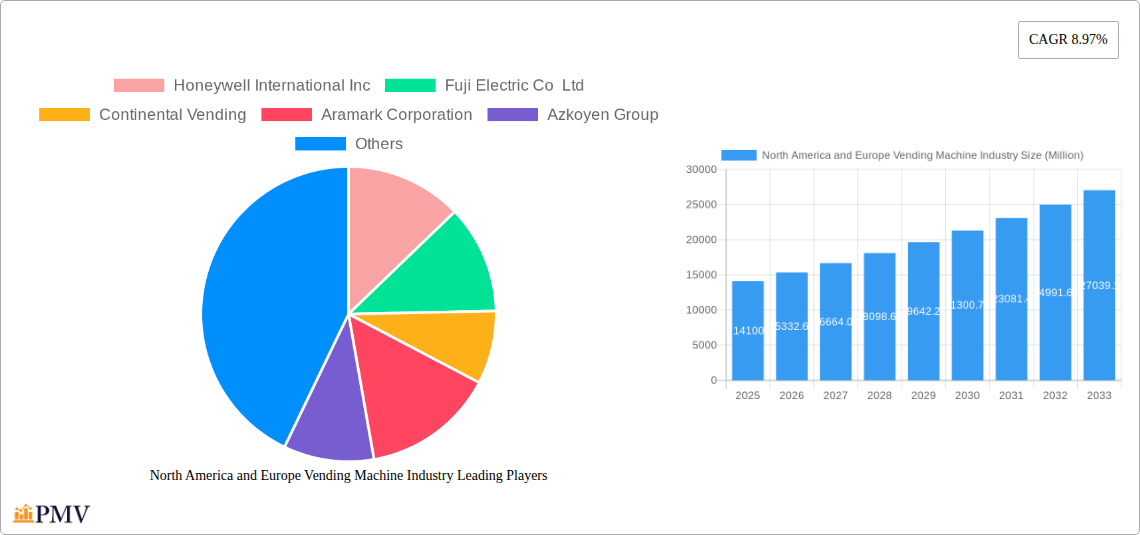
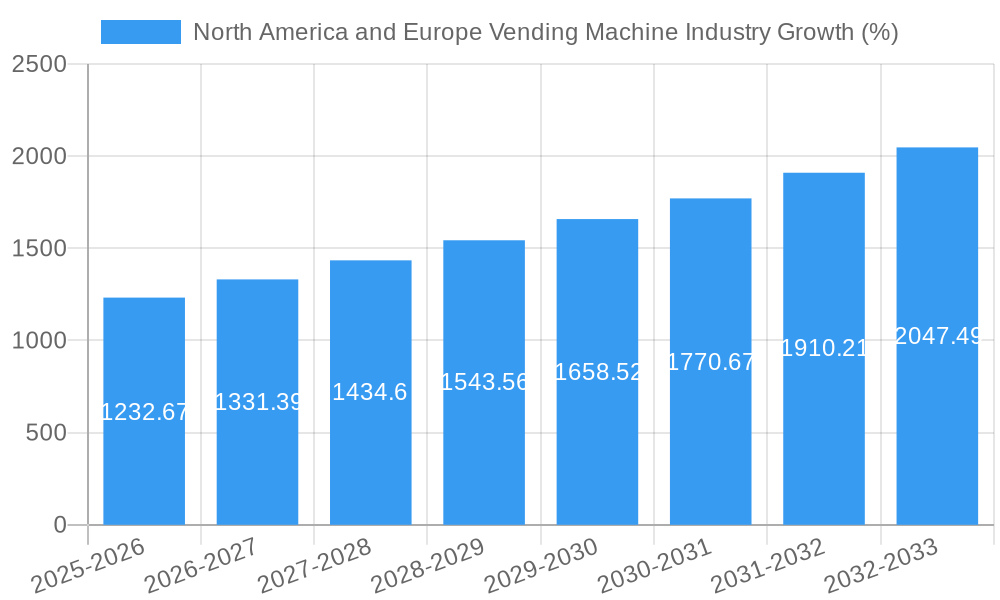
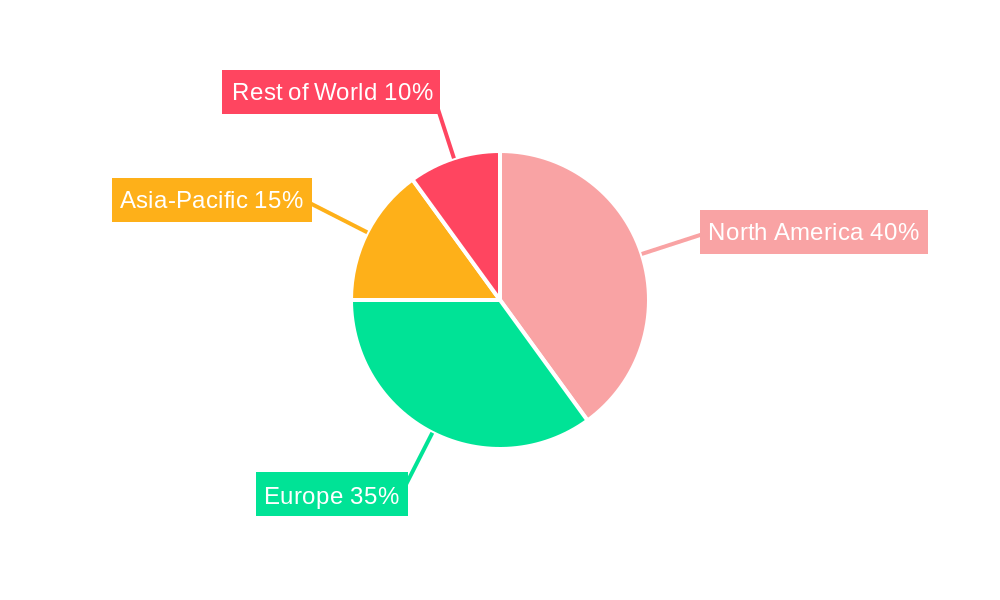
The North America and Europe vending machine markets are experiencing robust growth, driven by evolving consumer preferences and technological advancements. The global market, valued at $14.10 billion in 2025, exhibits a Compound Annual Growth Rate (CAGR) of 8.97%, projecting significant expansion through 2033. North America, a mature market, benefits from high consumer density in urban areas and a strong presence of established vending operators. The increasing adoption of cashless payment systems, contactless technologies, and smart vending machines enhances convenience and operational efficiency, fueling market growth. Furthermore, a shift towards healthier food and beverage options within vending machines caters to growing health consciousness among consumers. While the market faces constraints such as fluctuating raw material prices and competition from quick-service restaurants, the integration of technology and focus on product diversification are mitigating these challenges.
Europe's vending machine market demonstrates similar growth trends, although market maturity varies across regions. Germany, France, and the UK represent significant market segments, characterized by established vending infrastructure and high consumer acceptance. The region benefits from a strong focus on workplace wellness and the rising adoption of automated solutions in offices and institutions. However, regulatory changes concerning food safety and hygiene standards, along with economic fluctuations in specific European countries, pose potential restraints on market expansion. Nevertheless, the ongoing adoption of connected vending machines capable of data analytics, inventory management, and personalized offers will likely drive future growth in the European market. The diversification of offered products beyond traditional snacks and beverages, such as fresh food and personalized health options, is also contributing to market expansion.
North America and Europe Vending Machine Industry: A Comprehensive Market Report (2019-2033)
This detailed report provides a comprehensive analysis of the North America and Europe vending machine industry, offering invaluable insights for stakeholders seeking to navigate this dynamic market. The study period covers 2019-2033, with 2025 as the base and estimated year, and a forecast period of 2025-2033. The historical period analyzed is 2019-2024. The report utilizes rigorous data analysis to provide actionable intelligence and strategic recommendations. The total market size in 2024 is estimated at xx Million and projected to reach xx Million by 2033, exhibiting a CAGR of xx%.
North America and Europe Vending Machine Industry Market Structure & Competitive Dynamics
The North American and European vending machine market exhibits a moderately concentrated structure with several key players commanding significant market share. Honeywell International Inc, Fuji Electric Co Ltd, and Crane Merchandising Systems Inc are among the prominent companies shaping the landscape. Market concentration is influenced by factors such as economies of scale, technological capabilities, and established distribution networks. Innovation is a crucial competitive factor, with companies investing heavily in smart vending machines with cashless payment systems, improved inventory management, and data analytics capabilities. Regulatory frameworks vary across regions, influencing compliance costs and market access. Product substitutes, such as convenience stores and online delivery services, exert competitive pressure, particularly in densely populated areas. End-user preferences are shifting towards healthier options and customized product offerings, driving innovation in product selection and machine design. M&A activity in the sector has been relatively moderate in recent years, with deal values averaging xx Million. However, strategic acquisitions are expected to increase as companies strive to enhance their market presence and technological capabilities. Key M&A activities included [Insert Specific Details of M&A activities, including names of companies and deal size if available; otherwise, use “xx Million”].
North America and Europe Vending Machine Industry Industry Trends & Insights
The vending machine industry in North America and Europe is experiencing significant transformation driven by several key factors. Technological advancements, including the integration of IoT (Internet of Things) capabilities, are enhancing machine efficiency and customer experience. Smart vending machines offer features like mobile ordering, cashless payments, personalized recommendations, and real-time inventory tracking. This drives customer engagement and revenue optimization. Consumer preferences are increasingly demanding healthier and more diverse product options, including organic and locally sourced items. This is pushing manufacturers and operators to adapt their product offerings and machine configurations to meet these evolving demands. The market is also witnessing the rise of subscription models and loyalty programs to enhance customer retention and recurring revenue streams. Competitive dynamics are intense, with established players facing pressure from emerging technology companies and innovative business models. The increasing penetration of cashless payment systems and the growing adoption of mobile ordering apps are contributing to market expansion. This trend is projected to accelerate in the coming years, with a significant increase in market penetration. The overall market growth is expected to be fuelled by these trends and will increase with approximately xx% CAGR over the forecast period.
Dominant Markets & Segments in North America and Europe Vending Machine Industry
The office/commercial segment dominates the vending machine market in both North America and Europe. This is driven by the high density of employees in urban centers and the convenience of on-site access to food and beverages. The institutional segment (schools, hospitals, government buildings) is also a significant contributor, driven by the large number of consumers in these locations. Within product types, the beverage segment holds the largest market share, reflecting strong demand for convenient hydration and refreshment options. The packaged food segment is also growing steadily.
- Key Drivers for Office/Commercial Dominance: High employee density, convenient location, increasing demand for quick and easy meal solutions, and rising disposable incomes.
- Key Drivers for Institutional Dominance: Large consumer bases, captive audiences, government initiatives supporting workplace wellness, and growing demand for healthy and convenient food choices in institutions.
- Key Drivers for Beverage Dominance: Thirst for convenience, wide range of choices, ease of vending, and comparatively low-cost price point.
- Key Drivers for Packaged Food Dominance: increasing demand for quick and convenient meal options, busy lifestyles, and availability of various snack and meal options.
The market in the major metropolitan areas in both regions show the highest market penetration, and growth in rural areas is comparatively slower.
North America and Europe Vending Machine Industry Product Innovations
Recent innovations in the vending machine industry focus on enhancing convenience, health consciousness, and operational efficiency. Smart vending machines with mobile payment options, real-time inventory management systems, and data analytics capabilities are becoming increasingly prevalent. The integration of IoT technology facilitates remote monitoring and maintenance, leading to cost optimization and improved reliability. Companies are also focusing on offering healthier options and customized product selections to cater to evolving consumer preferences. These innovations enhance the value proposition for both consumers and operators, driving industry growth and fostering increased competition.
Report Segmentation & Scope
This report segments the North America and Europe vending machine market by location (Office/Commercial, Institutional, Others – including Healthcare Facilities, Amusement Parks, Sports Venues, Transportation Facilities) and by type (Beverage, Packaged Food, Others). Each segment is analyzed for its growth projections, market size, and competitive dynamics. The "Others" location segment exhibits the lowest market share compared to the Office/Commercial and Institutional segments due to the smaller captive audience and lower density of vending machine placements. The "Others" product category includes items like confectionery, personal care products, and other miscellaneous items, representing a smaller but growing segment of the overall market, with growth primarily fueled by expanding product portfolios and increased consumer interest in niche items.
Key Drivers of North America and Europe Vending Machine Industry Growth
Several factors are driving the growth of the vending machine industry. Technological advancements such as smart vending machines with mobile payment options are enhancing customer experience and convenience, contributing to increased market penetration. The increasing adoption of cashless payment systems simplifies transactions, leading to greater consumer acceptance. Economic growth and rising disposable incomes also support the market growth as consumers seek convenient and readily available food and beverages. Furthermore, government regulations concerning workplace wellness and food safety can influence the adoption of vending machines offering healthier options.
Challenges in the North America and Europe Vending Machine Industry Sector
The vending machine industry faces several challenges. Regulatory hurdles concerning food safety, hygiene, and licensing requirements vary across regions, increasing compliance costs. Supply chain disruptions can impact product availability and operational efficiency. Intense competition from alternative food and beverage providers such as convenience stores, cafes, and online delivery services is a significant restraint. Fluctuations in raw material prices can also impact profitability. These challenges together can affect the profit margin by up to xx%.
Leading Players in the North America and Europe Vending Machine Industry Market
- Honeywell International Inc
- Fuji Electric Co Ltd
- Continental Vending
- Aramark Corporation
- Azkoyen Group
- Crane Merchandising Systems Inc
- Bulk Vending Systems
- Sanden Holdings Corporation
- Compass Group Plc
- Evoca Group
- Automated Merchandising Systems
- Azkoyen Vending Systems
- Selecta Compass Group
- American Vending Machines
Key Developments in North America and Europe Vending Machine Industry Sector
- September 2021: Glory, a global technology company, partnered with Deutsche Bahn, Germany's largest railway operator, to launch an IoT-enabled vending solution offering fresh, locally sourced produce. This highlights the increasing focus on healthier options and technological integration.
- April 2022: Lush, a British cosmetics company, launched a 24-hour vending machine in London, demonstrating the expanding application of vending beyond food and beverages.
Strategic North America and Europe Vending Machine Industry Market Outlook
The future of the North America and Europe vending machine industry looks promising. Continued technological advancements, particularly in areas such as artificial intelligence and machine learning, are poised to transform the customer experience and optimize operational efficiency. The growing demand for healthier and more diverse product options presents significant opportunities for innovation and market expansion. Strategic partnerships and acquisitions are expected to further shape the competitive landscape. Companies that effectively leverage technological advancements and adapt to changing consumer preferences are likely to achieve significant growth in the coming years. The industry is well-positioned for expansion, driven by the growing demand for convenience and the continuous evolution of vending technology.
North America and Europe Vending Machine Industry Segmentation
-
1. Type
- 1.1. Beverage
- 1.2. Packaged Food
- 1.3. Others
-
2. Location
- 2.1. Office/Commercial
- 2.2. Institutional
- 2.3. Others
North America and Europe Vending Machine Industry Segmentation By Geography
-
1. North America
- 1.1. United States
- 1.2. Canada
- 1.3. Mexico
-
2. Europe
- 2.1. Germany
- 2.2. United Kingdom
- 2.3. France
- 2.4. Italy
- 2.5. Spain
- 2.6. Rest of Europe
North America and Europe Vending Machine Industry REPORT HIGHLIGHTS
| Aspects | Details |
|---|---|
| Study Period | 2019-2033 |
| Base Year | 2024 |
| Estimated Year | 2025 |
| Forecast Period | 2025-2033 |
| Historical Period | 2019-2024 |
| Growth Rate | CAGR of 8.97% from 2019-2033 |
| Segmentation |
|
Table of Contents
- 1. Introduction
- 1.1. Research Scope
- 1.2. Market Segmentation
- 1.3. Research Methodology
- 1.4. Definitions and Assumptions
- 2. Executive Summary
- 2.1. Introduction
- 3. Market Dynamics
- 3.1. Introduction
- 3.2. Market Drivers
- 3.2.1. Connecting/Improving Connectivity to Rural Areas; Improving and Catering to Increasing Data Needs
- 3.3. Market Restrains
- 3.3.1. ; High Initial Investment and Cost of Maintenance
- 3.4. Market Trends
- 3.4.1. Food Vending Machines are Expected to Witness a High Market Growth.
- 4. Market Factor Analysis
- 4.1. Porters Five Forces
- 4.2. Supply/Value Chain
- 4.3. PESTEL analysis
- 4.4. Market Entropy
- 4.5. Patent/Trademark Analysis
- 5. North America and Europe Vending Machine Industry Analysis, Insights and Forecast, 2019-2031
- 5.1. Market Analysis, Insights and Forecast - by Type
- 5.1.1. Beverage
- 5.1.2. Packaged Food
- 5.1.3. Others
- 5.2. Market Analysis, Insights and Forecast - by Location
- 5.2.1. Office/Commercial
- 5.2.2. Institutional
- 5.2.3. Others
- 5.3. Market Analysis, Insights and Forecast - by Region
- 5.3.1. North America
- 5.3.2. Europe
- 5.1. Market Analysis, Insights and Forecast - by Type
- 6. North America North America and Europe Vending Machine Industry Analysis, Insights and Forecast, 2019-2031
- 6.1. Market Analysis, Insights and Forecast - by Type
- 6.1.1. Beverage
- 6.1.2. Packaged Food
- 6.1.3. Others
- 6.2. Market Analysis, Insights and Forecast - by Location
- 6.2.1. Office/Commercial
- 6.2.2. Institutional
- 6.2.3. Others
- 6.1. Market Analysis, Insights and Forecast - by Type
- 7. Europe North America and Europe Vending Machine Industry Analysis, Insights and Forecast, 2019-2031
- 7.1. Market Analysis, Insights and Forecast - by Type
- 7.1.1. Beverage
- 7.1.2. Packaged Food
- 7.1.3. Others
- 7.2. Market Analysis, Insights and Forecast - by Location
- 7.2.1. Office/Commercial
- 7.2.2. Institutional
- 7.2.3. Others
- 7.1. Market Analysis, Insights and Forecast - by Type
- 8. Germany North America and Europe Vending Machine Industry Analysis, Insights and Forecast, 2019-2031
- 9. France North America and Europe Vending Machine Industry Analysis, Insights and Forecast, 2019-2031
- 10. Italy North America and Europe Vending Machine Industry Analysis, Insights and Forecast, 2019-2031
- 11. United Kingdom North America and Europe Vending Machine Industry Analysis, Insights and Forecast, 2019-2031
- 12. Netherlands North America and Europe Vending Machine Industry Analysis, Insights and Forecast, 2019-2031
- 13. Sweden North America and Europe Vending Machine Industry Analysis, Insights and Forecast, 2019-2031
- 14. Rest of Europe North America and Europe Vending Machine Industry Analysis, Insights and Forecast, 2019-2031
- 15. Competitive Analysis
- 15.1. Market Share Analysis 2024
- 15.2. Company Profiles
- 15.2.1 Honeywell International Inc
- 15.2.1.1. Overview
- 15.2.1.2. Products
- 15.2.1.3. SWOT Analysis
- 15.2.1.4. Recent Developments
- 15.2.1.5. Financials (Based on Availability)
- 15.2.2 Fuji Electric Co Ltd
- 15.2.2.1. Overview
- 15.2.2.2. Products
- 15.2.2.3. SWOT Analysis
- 15.2.2.4. Recent Developments
- 15.2.2.5. Financials (Based on Availability)
- 15.2.3 Continental Vending
- 15.2.3.1. Overview
- 15.2.3.2. Products
- 15.2.3.3. SWOT Analysis
- 15.2.3.4. Recent Developments
- 15.2.3.5. Financials (Based on Availability)
- 15.2.4 Aramark Corporation
- 15.2.4.1. Overview
- 15.2.4.2. Products
- 15.2.4.3. SWOT Analysis
- 15.2.4.4. Recent Developments
- 15.2.4.5. Financials (Based on Availability)
- 15.2.5 Azkoyen Group
- 15.2.5.1. Overview
- 15.2.5.2. Products
- 15.2.5.3. SWOT Analysis
- 15.2.5.4. Recent Developments
- 15.2.5.5. Financials (Based on Availability)
- 15.2.6 Crane Merchandising Systems Inc
- 15.2.6.1. Overview
- 15.2.6.2. Products
- 15.2.6.3. SWOT Analysis
- 15.2.6.4. Recent Developments
- 15.2.6.5. Financials (Based on Availability)
- 15.2.7 Bulk Vending Systems
- 15.2.7.1. Overview
- 15.2.7.2. Products
- 15.2.7.3. SWOT Analysis
- 15.2.7.4. Recent Developments
- 15.2.7.5. Financials (Based on Availability)
- 15.2.8 Sanden Holdings Corporation
- 15.2.8.1. Overview
- 15.2.8.2. Products
- 15.2.8.3. SWOT Analysis
- 15.2.8.4. Recent Developments
- 15.2.8.5. Financials (Based on Availability)
- 15.2.9 CompassGroupPlc
- 15.2.9.1. Overview
- 15.2.9.2. Products
- 15.2.9.3. SWOT Analysis
- 15.2.9.4. Recent Developments
- 15.2.9.5. Financials (Based on Availability)
- 15.2.10 Evoca Group
- 15.2.10.1. Overview
- 15.2.10.2. Products
- 15.2.10.3. SWOT Analysis
- 15.2.10.4. Recent Developments
- 15.2.10.5. Financials (Based on Availability)
- 15.2.11 Automated Merchandising Systems
- 15.2.11.1. Overview
- 15.2.11.2. Products
- 15.2.11.3. SWOT Analysis
- 15.2.11.4. Recent Developments
- 15.2.11.5. Financials (Based on Availability)
- 15.2.12 Azkoyen Vending Systems
- 15.2.12.1. Overview
- 15.2.12.2. Products
- 15.2.12.3. SWOT Analysis
- 15.2.12.4. Recent Developments
- 15.2.12.5. Financials (Based on Availability)
- 15.2.13 Selecta Compass Group
- 15.2.13.1. Overview
- 15.2.13.2. Products
- 15.2.13.3. SWOT Analysis
- 15.2.13.4. Recent Developments
- 15.2.13.5. Financials (Based on Availability)
- 15.2.14 American Vending Machines
- 15.2.14.1. Overview
- 15.2.14.2. Products
- 15.2.14.3. SWOT Analysis
- 15.2.14.4. Recent Developments
- 15.2.14.5. Financials (Based on Availability)
- 15.2.1 Honeywell International Inc
List of Figures
- Figure 1: North America and Europe Vending Machine Industry Revenue Breakdown (Million, %) by Product 2024 & 2032
- Figure 2: North America and Europe Vending Machine Industry Share (%) by Company 2024
List of Tables
- Table 1: North America and Europe Vending Machine Industry Revenue Million Forecast, by Region 2019 & 2032
- Table 2: North America and Europe Vending Machine Industry Volume K Unit Forecast, by Region 2019 & 2032
- Table 3: North America and Europe Vending Machine Industry Revenue Million Forecast, by Type 2019 & 2032
- Table 4: North America and Europe Vending Machine Industry Volume K Unit Forecast, by Type 2019 & 2032
- Table 5: North America and Europe Vending Machine Industry Revenue Million Forecast, by Location 2019 & 2032
- Table 6: North America and Europe Vending Machine Industry Volume K Unit Forecast, by Location 2019 & 2032
- Table 7: North America and Europe Vending Machine Industry Revenue Million Forecast, by Region 2019 & 2032
- Table 8: North America and Europe Vending Machine Industry Volume K Unit Forecast, by Region 2019 & 2032
- Table 9: North America and Europe Vending Machine Industry Revenue Million Forecast, by Country 2019 & 2032
- Table 10: North America and Europe Vending Machine Industry Volume K Unit Forecast, by Country 2019 & 2032
- Table 11: Germany North America and Europe Vending Machine Industry Revenue (Million) Forecast, by Application 2019 & 2032
- Table 12: Germany North America and Europe Vending Machine Industry Volume (K Unit) Forecast, by Application 2019 & 2032
- Table 13: France North America and Europe Vending Machine Industry Revenue (Million) Forecast, by Application 2019 & 2032
- Table 14: France North America and Europe Vending Machine Industry Volume (K Unit) Forecast, by Application 2019 & 2032
- Table 15: Italy North America and Europe Vending Machine Industry Revenue (Million) Forecast, by Application 2019 & 2032
- Table 16: Italy North America and Europe Vending Machine Industry Volume (K Unit) Forecast, by Application 2019 & 2032
- Table 17: United Kingdom North America and Europe Vending Machine Industry Revenue (Million) Forecast, by Application 2019 & 2032
- Table 18: United Kingdom North America and Europe Vending Machine Industry Volume (K Unit) Forecast, by Application 2019 & 2032
- Table 19: Netherlands North America and Europe Vending Machine Industry Revenue (Million) Forecast, by Application 2019 & 2032
- Table 20: Netherlands North America and Europe Vending Machine Industry Volume (K Unit) Forecast, by Application 2019 & 2032
- Table 21: Sweden North America and Europe Vending Machine Industry Revenue (Million) Forecast, by Application 2019 & 2032
- Table 22: Sweden North America and Europe Vending Machine Industry Volume (K Unit) Forecast, by Application 2019 & 2032
- Table 23: Rest of Europe North America and Europe Vending Machine Industry Revenue (Million) Forecast, by Application 2019 & 2032
- Table 24: Rest of Europe North America and Europe Vending Machine Industry Volume (K Unit) Forecast, by Application 2019 & 2032
- Table 25: North America and Europe Vending Machine Industry Revenue Million Forecast, by Type 2019 & 2032
- Table 26: North America and Europe Vending Machine Industry Volume K Unit Forecast, by Type 2019 & 2032
- Table 27: North America and Europe Vending Machine Industry Revenue Million Forecast, by Location 2019 & 2032
- Table 28: North America and Europe Vending Machine Industry Volume K Unit Forecast, by Location 2019 & 2032
- Table 29: North America and Europe Vending Machine Industry Revenue Million Forecast, by Country 2019 & 2032
- Table 30: North America and Europe Vending Machine Industry Volume K Unit Forecast, by Country 2019 & 2032
- Table 31: United States North America and Europe Vending Machine Industry Revenue (Million) Forecast, by Application 2019 & 2032
- Table 32: United States North America and Europe Vending Machine Industry Volume (K Unit) Forecast, by Application 2019 & 2032
- Table 33: Canada North America and Europe Vending Machine Industry Revenue (Million) Forecast, by Application 2019 & 2032
- Table 34: Canada North America and Europe Vending Machine Industry Volume (K Unit) Forecast, by Application 2019 & 2032
- Table 35: Mexico North America and Europe Vending Machine Industry Revenue (Million) Forecast, by Application 2019 & 2032
- Table 36: Mexico North America and Europe Vending Machine Industry Volume (K Unit) Forecast, by Application 2019 & 2032
- Table 37: North America and Europe Vending Machine Industry Revenue Million Forecast, by Type 2019 & 2032
- Table 38: North America and Europe Vending Machine Industry Volume K Unit Forecast, by Type 2019 & 2032
- Table 39: North America and Europe Vending Machine Industry Revenue Million Forecast, by Location 2019 & 2032
- Table 40: North America and Europe Vending Machine Industry Volume K Unit Forecast, by Location 2019 & 2032
- Table 41: North America and Europe Vending Machine Industry Revenue Million Forecast, by Country 2019 & 2032
- Table 42: North America and Europe Vending Machine Industry Volume K Unit Forecast, by Country 2019 & 2032
- Table 43: Germany North America and Europe Vending Machine Industry Revenue (Million) Forecast, by Application 2019 & 2032
- Table 44: Germany North America and Europe Vending Machine Industry Volume (K Unit) Forecast, by Application 2019 & 2032
- Table 45: United Kingdom North America and Europe Vending Machine Industry Revenue (Million) Forecast, by Application 2019 & 2032
- Table 46: United Kingdom North America and Europe Vending Machine Industry Volume (K Unit) Forecast, by Application 2019 & 2032
- Table 47: France North America and Europe Vending Machine Industry Revenue (Million) Forecast, by Application 2019 & 2032
- Table 48: France North America and Europe Vending Machine Industry Volume (K Unit) Forecast, by Application 2019 & 2032
- Table 49: Italy North America and Europe Vending Machine Industry Revenue (Million) Forecast, by Application 2019 & 2032
- Table 50: Italy North America and Europe Vending Machine Industry Volume (K Unit) Forecast, by Application 2019 & 2032
- Table 51: Spain North America and Europe Vending Machine Industry Revenue (Million) Forecast, by Application 2019 & 2032
- Table 52: Spain North America and Europe Vending Machine Industry Volume (K Unit) Forecast, by Application 2019 & 2032
- Table 53: Rest of Europe North America and Europe Vending Machine Industry Revenue (Million) Forecast, by Application 2019 & 2032
- Table 54: Rest of Europe North America and Europe Vending Machine Industry Volume (K Unit) Forecast, by Application 2019 & 2032
Frequently Asked Questions
1. What is the projected Compound Annual Growth Rate (CAGR) of the North America and Europe Vending Machine Industry?
The projected CAGR is approximately 8.97%.
2. Which companies are prominent players in the North America and Europe Vending Machine Industry?
Key companies in the market include Honeywell International Inc, Fuji Electric Co Ltd, Continental Vending, Aramark Corporation, Azkoyen Group, Crane Merchandising Systems Inc, Bulk Vending Systems, Sanden Holdings Corporation, CompassGroupPlc, Evoca Group, Automated Merchandising Systems, Azkoyen Vending Systems, Selecta Compass Group, American Vending Machines.
3. What are the main segments of the North America and Europe Vending Machine Industry?
The market segments include Type, Location.
4. Can you provide details about the market size?
The market size is estimated to be USD 14.10 Million as of 2022.
5. What are some drivers contributing to market growth?
Connecting/Improving Connectivity to Rural Areas; Improving and Catering to Increasing Data Needs.
6. What are the notable trends driving market growth?
Food Vending Machines are Expected to Witness a High Market Growth..
7. Are there any restraints impacting market growth?
; High Initial Investment and Cost of Maintenance.
8. Can you provide examples of recent developments in the market?
April 2022 - Lush, the British cosmetics company, established a 24-hour vending machine where customers can buy its goods anytime or at night. The vending machine is located in London's Coal Drop's Yard, just a ten-minute walk from King's Cross Station, one of the city's busiest rail stations.
9. What pricing options are available for accessing the report?
Pricing options include single-user, multi-user, and enterprise licenses priced at USD 4750, USD 5250, and USD 8750 respectively.
10. Is the market size provided in terms of value or volume?
The market size is provided in terms of value, measured in Million and volume, measured in K Unit.
11. Are there any specific market keywords associated with the report?
Yes, the market keyword associated with the report is "North America and Europe Vending Machine Industry," which aids in identifying and referencing the specific market segment covered.
12. How do I determine which pricing option suits my needs best?
The pricing options vary based on user requirements and access needs. Individual users may opt for single-user licenses, while businesses requiring broader access may choose multi-user or enterprise licenses for cost-effective access to the report.
13. Are there any additional resources or data provided in the North America and Europe Vending Machine Industry report?
While the report offers comprehensive insights, it's advisable to review the specific contents or supplementary materials provided to ascertain if additional resources or data are available.
14. How can I stay updated on further developments or reports in the North America and Europe Vending Machine Industry?
To stay informed about further developments, trends, and reports in the North America and Europe Vending Machine Industry, consider subscribing to industry newsletters, following relevant companies and organizations, or regularly checking reputable industry news sources and publications.
Methodology
Step 1 - Identification of Relevant Samples Size from Population Database


Step 2 - Approaches for Defining Global Market Size (Value, Volume* & Price*)

Note*: In applicable scenarios
Step 3 - Data Sources
Primary Research
- Web Analytics
- Survey Reports
- Research Institute
- Latest Research Reports
- Opinion Leaders
Secondary Research
- Annual Reports
- White Paper
- Latest Press Release
- Industry Association
- Paid Database
- Investor Presentations

Step 4 - Data Triangulation
Involves using different sources of information in order to increase the validity of a study
These sources are likely to be stakeholders in a program - participants, other researchers, program staff, other community members, and so on.
Then we put all data in single framework & apply various statistical tools to find out the dynamic on the market.
During the analysis stage, feedback from the stakeholder groups would be compared to determine areas of agreement as well as areas of divergence


