
Key Insights
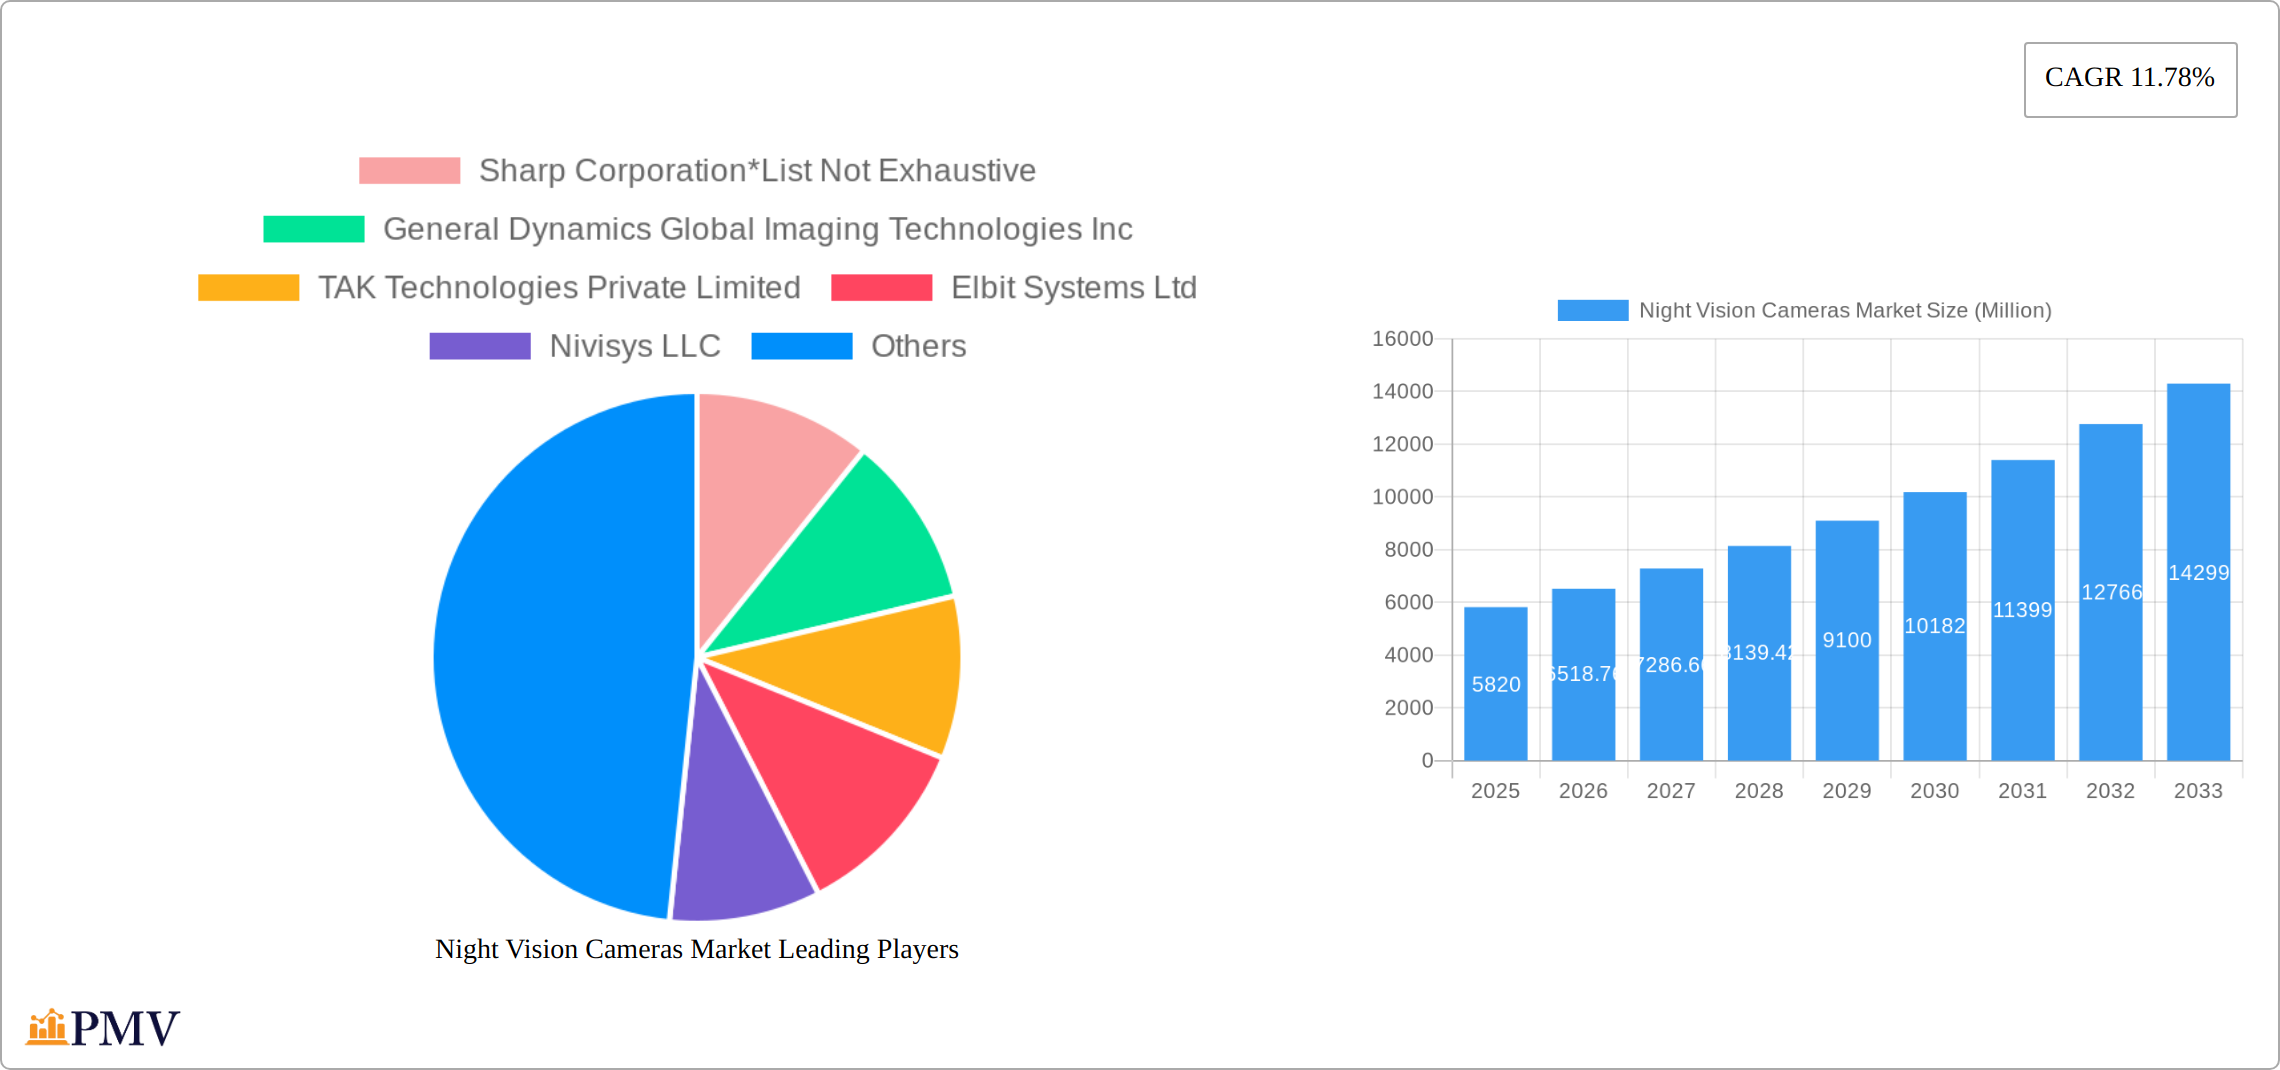
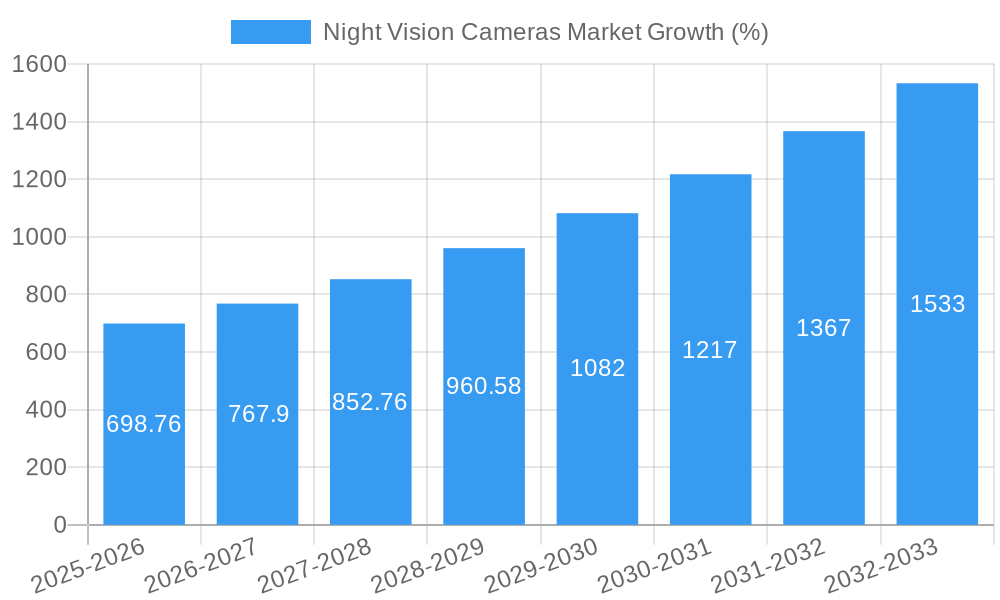
The Night Vision Cameras market is experiencing robust growth, projected to reach a value of $5.82 billion in 2025 and maintain a Compound Annual Growth Rate (CAGR) of 11.78% from 2025 to 2033. This expansion is driven by several key factors. Increasing demand from military and defense applications, fueled by modernization efforts and technological advancements, significantly contributes to market growth. Simultaneously, the industrial sector's adoption of night vision cameras for enhanced security and surveillance, particularly in logistics and infrastructure monitoring, is a substantial driver. Furthermore, the rising need for improved safety and security in public and residential infrastructure, coupled with advancements in transportation safety measures, further fuels market expansion. Research and development initiatives focusing on enhancing image quality, resolution, and functionality, along with the miniaturization of components, are also pushing the market forward. The market is segmented by end-user (military & defense, industrial, public & residential infrastructure, transportation, research, other) and by type (wired and wireless night vision cameras), with wireless cameras gaining significant traction due to their flexibility and ease of deployment. Competitive dynamics are shaped by established players like FLIR Systems, and Sony Corporation alongside newer entrants, leading to innovation and price competitiveness. The Asia-Pacific region is expected to witness substantial growth due to increasing infrastructure development and government investments.
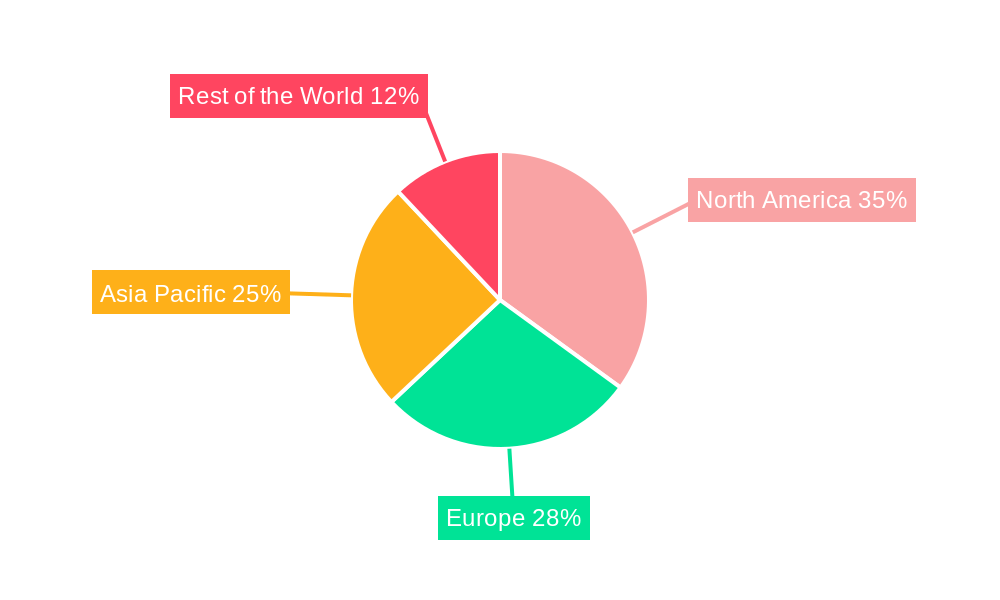
Growth within the night vision camera market is expected to continue beyond 2025, driven by ongoing technological innovation and increasing applications across various sectors. The shift towards smaller, lighter, and more energy-efficient wireless cameras is a prominent trend, alongside the integration of advanced features like improved image processing, thermal imaging capabilities, and AI-based object recognition. While factors like high initial investment costs and potential regulatory hurdles could present challenges, the overall market outlook remains positive, with the continuous development of superior technologies and broader adoption across diverse end-use sectors expected to offset these restraints. North America and Europe currently hold significant market shares due to established technologies and high defense budgets, but the rapid expansion of the Asia-Pacific region is poised to shift the regional landscape in the coming years. The increasing adoption of night vision technology in autonomous vehicles and drones is also a significant emerging market opportunity.
Night Vision Cameras Market: A Comprehensive Report (2019-2033)
This in-depth report provides a comprehensive analysis of the Night Vision Cameras Market, offering invaluable insights for stakeholders across the industry. Covering the period from 2019 to 2033, with a base year of 2025 and a forecast period of 2025-2033, this report meticulously examines market dynamics, competitive landscapes, and future growth prospects. The study encompasses detailed segmentation by end-user (Military and Defense, Industrial, Public and Residential Infrastructure, Transportation, Research, Other End Users) and by type (Wired Night Vision Cameras, Wireless Night Vision Cameras). The total market size is projected to reach xx Million by 2033.
Night Vision Cameras Market Market Structure & Competitive Dynamics
The Night Vision Cameras market presents a moderately consolidated structure, with several key players holding substantial market shares. This concentration is shaped by technological innovation, economies of scale, and strategic alliances. The dynamic innovation ecosystem is fueled by ongoing R&D, focused on enhancing image clarity, expanding functionalities (including advanced analytics and AI integration), and driving down costs. Regulatory landscapes, particularly within defense and security sectors, significantly influence market trends. Competitive pressures arise from substitute products, such as improved low-light imaging technologies; however, the escalating demand for robust security solutions is a powerful growth catalyst. Mergers and acquisitions (M&A) have significantly reshaped the competitive landscape, with recent deals ranging from [Insert Updated Deal Value Range] in value. A prime example is the acquisition of [Company A] by [Company B] in [Year], which notably shifted market share distribution. Key performance indicators influencing market share include technological leadership, competitive pricing strategies, and brand reputation. The competitive landscape is also influenced by factors such as supply chain resilience and access to critical components.
Night Vision Cameras Market Industry Trends & Insights
The Night Vision Cameras market is experiencing robust growth, driven by several key factors. The increasing demand for enhanced security solutions in both commercial and government sectors is a primary driver. Technological advancements, including the integration of artificial intelligence (AI) and improved sensor technologies, are further boosting market expansion. A notable trend is the growing preference for wireless night vision cameras due to their increased flexibility and ease of installation. The market demonstrates a steady Compound Annual Growth Rate (CAGR) of xx% during the forecast period (2025-2033). Consumer preferences are shifting towards higher resolution, longer range, and more feature-rich cameras. Competitive dynamics are shaped by innovation, pricing strategies, and brand recognition, with established players and new entrants vying for market share. Market penetration is particularly high in developed economies, with emerging markets exhibiting significant growth potential.
Dominant Markets & Segments in Night Vision Cameras Market
Dominant Region/Country: North America currently maintains the largest market share, driven by substantial defense spending and a mature security infrastructure. However, the Asia-Pacific region is projected to exhibit the most rapid growth throughout the forecast period, fueled by urbanization, heightened security concerns, and government-led initiatives.
Dominant End-User Segment: The Military and Defense sector remains a major market segment due to the indispensable role of night vision technology in military operations. The Industrial sector is experiencing robust growth, propelled by the increasing adoption of surveillance and monitoring technologies across diverse industries. The Public and Residential Infrastructure segment shows a rising adoption rate of night vision cameras for security and safety enhancements.
Dominant Type Segment: Wireless night vision cameras are gaining popularity over wired counterparts due to their installation flexibility and convenience, especially in residential applications. Nevertheless, wired cameras continue to hold a significant market share in high-security contexts, owing to their superior reliability and enhanced data security.
Key Drivers for Dominant Segments:
- Military and Defense: Increased government investment in defense modernization and the growing demand for sophisticated surveillance technologies.
- Industrial: Widespread adoption of smart security systems, the rise of industrial automation, and the need for effective remote monitoring capabilities.
- Public and Residential Infrastructure: Rapid urbanization, escalating safety concerns, and government programs promoting smart city development.
Night Vision Cameras Market Product Innovations
Recent innovations in night vision cameras focus on enhancing image quality, incorporating advanced features like AI-powered analytics, and improving thermal imaging capabilities. The integration of 4K UHD video recording, as exemplified by ROVAOM's recent product launch, is a notable development. These advancements cater to the growing demand for high-resolution, user-friendly, and feature-rich cameras across various applications, giving companies a significant competitive advantage. The miniaturization of cameras and the development of low-power consumption designs are also crucial trends.
Report Segmentation & Scope
By End User: This report segments the market by end-user into Military and Defense, Industrial, Public and Residential Infrastructure, Transportation, Research, and Other End Users. Each segment’s growth projections, market size, and competitive dynamics are analyzed, considering factors such as specific application requirements and industry trends. The Military and Defense segment is expected to maintain its dominance due to significant government spending, while the Industrial and Public and Residential Infrastructure segments are projected to experience rapid growth.
By Type: The report categorizes the market into Wired Night Vision Cameras and Wireless Night Vision Cameras. Each type’s market size, growth rate, and key characteristics are thoroughly examined. The Wireless segment shows a higher projected CAGR due to increasing preference for mobility and flexibility, but Wired cameras retain market share for applications requiring high reliability and security.
Key Drivers of Night Vision Cameras Market Growth
Technological advancements in sensor technology and image processing are key growth drivers, resulting in superior image quality and expanded functionalities. Increased government spending on defense and security, along with rising security concerns across various sectors, fuels market expansion. Positive economic conditions in many regions, particularly in developing economies, further contribute to market growth. Furthermore, stringent safety regulations in specific industries mandate the use of night vision cameras, boosting demand. The growing adoption of smart city initiatives plays a significant role in driving demand for night vision cameras. The increasing integration with other IoT devices and cloud platforms is another important factor.
Challenges in the Night Vision Cameras Market Sector
High initial investment costs can hinder adoption, especially in budget-constrained applications. Supply chain disruptions and component shortages can impact production and availability. Intense competition among established and emerging players can put pressure on pricing and margins. Stringent regulatory requirements and compliance standards add complexity and can limit market access in certain regions. The fluctuating prices of raw materials also impact production costs.
Leading Players in the Night Vision Cameras Market Market
- Sharp Corporation
- General Dynamics Global Imaging Technologies Inc
- TAK Technologies Private Limited
- Elbit Systems Ltd
- Nivisys LLC
- Rockwell Collins Inc
- Harris Corporation
- BAE Systems PLC
- Intevac Inc
- Tactical Night Vision Company Inc
- Panasonic Corporation
- FLIR Systems Inc
- Photonis
- Sony Corporation
Key Developments in Night Vision Cameras Market Sector
October 2023: Google addressed blurry night vision issues in select Nest Cam models, highlighting the importance of continuous software updates and image processing refinements.
August 2023: ROVAOM launched a 4K color night vision camera for USD 249, showcasing advancements in affordability and image quality, impacting the competitive landscape through disruptive pricing.
[Add another recent development with date and brief description]
Strategic Night Vision Cameras Market Market Outlook
The Night Vision Cameras market is poised for sustained growth, driven by technological innovation, escalating security requirements, and favorable economic conditions. Strategic opportunities lie in developing advanced features such as AI-powered analytics, enhanced thermal imaging capabilities, and miniaturization. A focus on cost optimization and expansion into emerging markets will be crucial for securing market leadership. The integration of night vision technology with other smart security solutions promises to unlock new avenues for growth. Furthermore, exploring niche applications and developing sustainable manufacturing processes will provide a competitive edge.
Night Vision Cameras Market Segmentation
-
1. Type
- 1.1. Wired Night Vision Cameras
- 1.2. Wireless Night Vision Cameras
-
2. End User
- 2.1. Military and Defense
- 2.2. Industrial
- 2.3. Public and Residential Infrastructure
- 2.4. Transportation
- 2.5. Research
- 2.6. Other End Users
Night Vision Cameras Market Segmentation By Geography
- 1. North America
- 2. Europe
- 3. Asia
- 4. Australia and New Zealand
- 5. Latin America
- 6. Middle East and Africa
Night Vision Cameras Market REPORT HIGHLIGHTS
| Aspects | Details |
|---|---|
| Study Period | 2019-2033 |
| Base Year | 2024 |
| Estimated Year | 2025 |
| Forecast Period | 2025-2033 |
| Historical Period | 2019-2024 |
| Growth Rate | CAGR of 11.78% from 2019-2033 |
| Segmentation |
|
Table of Contents
- 1. Introduction
- 1.1. Research Scope
- 1.2. Market Segmentation
- 1.3. Research Methodology
- 1.4. Definitions and Assumptions
- 2. Executive Summary
- 2.1. Introduction
- 3. Market Dynamics
- 3.1. Introduction
- 3.2. Market Drivers
- 3.2.1. Rising Need for Advanced Surveillance Technology; Automotive Night Vision Applications
- 3.3. Market Restrains
- 3.3.1. Targetting through Transparent Obstacles
- 3.4. Market Trends
- 3.4.1. Military and Defense Segment is Expected to Drive the Market
- 4. Market Factor Analysis
- 4.1. Porters Five Forces
- 4.2. Supply/Value Chain
- 4.3. PESTEL analysis
- 4.4. Market Entropy
- 4.5. Patent/Trademark Analysis
- 5. Global Night Vision Cameras Market Analysis, Insights and Forecast, 2019-2031
- 5.1. Market Analysis, Insights and Forecast - by Type
- 5.1.1. Wired Night Vision Cameras
- 5.1.2. Wireless Night Vision Cameras
- 5.2. Market Analysis, Insights and Forecast - by End User
- 5.2.1. Military and Defense
- 5.2.2. Industrial
- 5.2.3. Public and Residential Infrastructure
- 5.2.4. Transportation
- 5.2.5. Research
- 5.2.6. Other End Users
- 5.3. Market Analysis, Insights and Forecast - by Region
- 5.3.1. North America
- 5.3.2. Europe
- 5.3.3. Asia
- 5.3.4. Australia and New Zealand
- 5.3.5. Latin America
- 5.3.6. Middle East and Africa
- 5.1. Market Analysis, Insights and Forecast - by Type
- 6. North America Night Vision Cameras Market Analysis, Insights and Forecast, 2019-2031
- 6.1. Market Analysis, Insights and Forecast - by Type
- 6.1.1. Wired Night Vision Cameras
- 6.1.2. Wireless Night Vision Cameras
- 6.2. Market Analysis, Insights and Forecast - by End User
- 6.2.1. Military and Defense
- 6.2.2. Industrial
- 6.2.3. Public and Residential Infrastructure
- 6.2.4. Transportation
- 6.2.5. Research
- 6.2.6. Other End Users
- 6.1. Market Analysis, Insights and Forecast - by Type
- 7. Europe Night Vision Cameras Market Analysis, Insights and Forecast, 2019-2031
- 7.1. Market Analysis, Insights and Forecast - by Type
- 7.1.1. Wired Night Vision Cameras
- 7.1.2. Wireless Night Vision Cameras
- 7.2. Market Analysis, Insights and Forecast - by End User
- 7.2.1. Military and Defense
- 7.2.2. Industrial
- 7.2.3. Public and Residential Infrastructure
- 7.2.4. Transportation
- 7.2.5. Research
- 7.2.6. Other End Users
- 7.1. Market Analysis, Insights and Forecast - by Type
- 8. Asia Night Vision Cameras Market Analysis, Insights and Forecast, 2019-2031
- 8.1. Market Analysis, Insights and Forecast - by Type
- 8.1.1. Wired Night Vision Cameras
- 8.1.2. Wireless Night Vision Cameras
- 8.2. Market Analysis, Insights and Forecast - by End User
- 8.2.1. Military and Defense
- 8.2.2. Industrial
- 8.2.3. Public and Residential Infrastructure
- 8.2.4. Transportation
- 8.2.5. Research
- 8.2.6. Other End Users
- 8.1. Market Analysis, Insights and Forecast - by Type
- 9. Australia and New Zealand Night Vision Cameras Market Analysis, Insights and Forecast, 2019-2031
- 9.1. Market Analysis, Insights and Forecast - by Type
- 9.1.1. Wired Night Vision Cameras
- 9.1.2. Wireless Night Vision Cameras
- 9.2. Market Analysis, Insights and Forecast - by End User
- 9.2.1. Military and Defense
- 9.2.2. Industrial
- 9.2.3. Public and Residential Infrastructure
- 9.2.4. Transportation
- 9.2.5. Research
- 9.2.6. Other End Users
- 9.1. Market Analysis, Insights and Forecast - by Type
- 10. Latin America Night Vision Cameras Market Analysis, Insights and Forecast, 2019-2031
- 10.1. Market Analysis, Insights and Forecast - by Type
- 10.1.1. Wired Night Vision Cameras
- 10.1.2. Wireless Night Vision Cameras
- 10.2. Market Analysis, Insights and Forecast - by End User
- 10.2.1. Military and Defense
- 10.2.2. Industrial
- 10.2.3. Public and Residential Infrastructure
- 10.2.4. Transportation
- 10.2.5. Research
- 10.2.6. Other End Users
- 10.1. Market Analysis, Insights and Forecast - by Type
- 11. Middle East and Africa Night Vision Cameras Market Analysis, Insights and Forecast, 2019-2031
- 11.1. Market Analysis, Insights and Forecast - by Type
- 11.1.1. Wired Night Vision Cameras
- 11.1.2. Wireless Night Vision Cameras
- 11.2. Market Analysis, Insights and Forecast - by End User
- 11.2.1. Military and Defense
- 11.2.2. Industrial
- 11.2.3. Public and Residential Infrastructure
- 11.2.4. Transportation
- 11.2.5. Research
- 11.2.6. Other End Users
- 11.1. Market Analysis, Insights and Forecast - by Type
- 12. North America Night Vision Cameras Market Analysis, Insights and Forecast, 2019-2031
- 12.1. Market Analysis, Insights and Forecast - By Country/Sub-region
- 12.1.1.
- 13. Europe Night Vision Cameras Market Analysis, Insights and Forecast, 2019-2031
- 13.1. Market Analysis, Insights and Forecast - By Country/Sub-region
- 13.1.1.
- 14. Asia Pacific Night Vision Cameras Market Analysis, Insights and Forecast, 2019-2031
- 14.1. Market Analysis, Insights and Forecast - By Country/Sub-region
- 14.1.1.
- 15. Rest of the World Night Vision Cameras Market Analysis, Insights and Forecast, 2019-2031
- 15.1. Market Analysis, Insights and Forecast - By Country/Sub-region
- 15.1.1.
- 16. Competitive Analysis
- 16.1. Global Market Share Analysis 2024
- 16.2. Company Profiles
- 16.2.1 Sharp Corporation*List Not Exhaustive
- 16.2.1.1. Overview
- 16.2.1.2. Products
- 16.2.1.3. SWOT Analysis
- 16.2.1.4. Recent Developments
- 16.2.1.5. Financials (Based on Availability)
- 16.2.2 General Dynamics Global Imaging Technologies Inc
- 16.2.2.1. Overview
- 16.2.2.2. Products
- 16.2.2.3. SWOT Analysis
- 16.2.2.4. Recent Developments
- 16.2.2.5. Financials (Based on Availability)
- 16.2.3 TAK Technologies Private Limited
- 16.2.3.1. Overview
- 16.2.3.2. Products
- 16.2.3.3. SWOT Analysis
- 16.2.3.4. Recent Developments
- 16.2.3.5. Financials (Based on Availability)
- 16.2.4 Elbit Systems Ltd
- 16.2.4.1. Overview
- 16.2.4.2. Products
- 16.2.4.3. SWOT Analysis
- 16.2.4.4. Recent Developments
- 16.2.4.5. Financials (Based on Availability)
- 16.2.5 Nivisys LLC
- 16.2.5.1. Overview
- 16.2.5.2. Products
- 16.2.5.3. SWOT Analysis
- 16.2.5.4. Recent Developments
- 16.2.5.5. Financials (Based on Availability)
- 16.2.6 Rockwell Collins Inc
- 16.2.6.1. Overview
- 16.2.6.2. Products
- 16.2.6.3. SWOT Analysis
- 16.2.6.4. Recent Developments
- 16.2.6.5. Financials (Based on Availability)
- 16.2.7 Harris Corporation
- 16.2.7.1. Overview
- 16.2.7.2. Products
- 16.2.7.3. SWOT Analysis
- 16.2.7.4. Recent Developments
- 16.2.7.5. Financials (Based on Availability)
- 16.2.8 BAE Systems PLC
- 16.2.8.1. Overview
- 16.2.8.2. Products
- 16.2.8.3. SWOT Analysis
- 16.2.8.4. Recent Developments
- 16.2.8.5. Financials (Based on Availability)
- 16.2.9 Intevac Inc
- 16.2.9.1. Overview
- 16.2.9.2. Products
- 16.2.9.3. SWOT Analysis
- 16.2.9.4. Recent Developments
- 16.2.9.5. Financials (Based on Availability)
- 16.2.10 Tactical Night Vision Company Inc
- 16.2.10.1. Overview
- 16.2.10.2. Products
- 16.2.10.3. SWOT Analysis
- 16.2.10.4. Recent Developments
- 16.2.10.5. Financials (Based on Availability)
- 16.2.11 Panasonic Corporation
- 16.2.11.1. Overview
- 16.2.11.2. Products
- 16.2.11.3. SWOT Analysis
- 16.2.11.4. Recent Developments
- 16.2.11.5. Financials (Based on Availability)
- 16.2.12 FLIR Systems Inc
- 16.2.12.1. Overview
- 16.2.12.2. Products
- 16.2.12.3. SWOT Analysis
- 16.2.12.4. Recent Developments
- 16.2.12.5. Financials (Based on Availability)
- 16.2.13 Photonis
- 16.2.13.1. Overview
- 16.2.13.2. Products
- 16.2.13.3. SWOT Analysis
- 16.2.13.4. Recent Developments
- 16.2.13.5. Financials (Based on Availability)
- 16.2.14 Sony Corporation
- 16.2.14.1. Overview
- 16.2.14.2. Products
- 16.2.14.3. SWOT Analysis
- 16.2.14.4. Recent Developments
- 16.2.14.5. Financials (Based on Availability)
- 16.2.1 Sharp Corporation*List Not Exhaustive
List of Figures
- Figure 1: Global Night Vision Cameras Market Revenue Breakdown (Million, %) by Region 2024 & 2032
- Figure 2: North America Night Vision Cameras Market Revenue (Million), by Country 2024 & 2032
- Figure 3: North America Night Vision Cameras Market Revenue Share (%), by Country 2024 & 2032
- Figure 4: Europe Night Vision Cameras Market Revenue (Million), by Country 2024 & 2032
- Figure 5: Europe Night Vision Cameras Market Revenue Share (%), by Country 2024 & 2032
- Figure 6: Asia Pacific Night Vision Cameras Market Revenue (Million), by Country 2024 & 2032
- Figure 7: Asia Pacific Night Vision Cameras Market Revenue Share (%), by Country 2024 & 2032
- Figure 8: Rest of the World Night Vision Cameras Market Revenue (Million), by Country 2024 & 2032
- Figure 9: Rest of the World Night Vision Cameras Market Revenue Share (%), by Country 2024 & 2032
- Figure 10: North America Night Vision Cameras Market Revenue (Million), by Type 2024 & 2032
- Figure 11: North America Night Vision Cameras Market Revenue Share (%), by Type 2024 & 2032
- Figure 12: North America Night Vision Cameras Market Revenue (Million), by End User 2024 & 2032
- Figure 13: North America Night Vision Cameras Market Revenue Share (%), by End User 2024 & 2032
- Figure 14: North America Night Vision Cameras Market Revenue (Million), by Country 2024 & 2032
- Figure 15: North America Night Vision Cameras Market Revenue Share (%), by Country 2024 & 2032
- Figure 16: Europe Night Vision Cameras Market Revenue (Million), by Type 2024 & 2032
- Figure 17: Europe Night Vision Cameras Market Revenue Share (%), by Type 2024 & 2032
- Figure 18: Europe Night Vision Cameras Market Revenue (Million), by End User 2024 & 2032
- Figure 19: Europe Night Vision Cameras Market Revenue Share (%), by End User 2024 & 2032
- Figure 20: Europe Night Vision Cameras Market Revenue (Million), by Country 2024 & 2032
- Figure 21: Europe Night Vision Cameras Market Revenue Share (%), by Country 2024 & 2032
- Figure 22: Asia Night Vision Cameras Market Revenue (Million), by Type 2024 & 2032
- Figure 23: Asia Night Vision Cameras Market Revenue Share (%), by Type 2024 & 2032
- Figure 24: Asia Night Vision Cameras Market Revenue (Million), by End User 2024 & 2032
- Figure 25: Asia Night Vision Cameras Market Revenue Share (%), by End User 2024 & 2032
- Figure 26: Asia Night Vision Cameras Market Revenue (Million), by Country 2024 & 2032
- Figure 27: Asia Night Vision Cameras Market Revenue Share (%), by Country 2024 & 2032
- Figure 28: Australia and New Zealand Night Vision Cameras Market Revenue (Million), by Type 2024 & 2032
- Figure 29: Australia and New Zealand Night Vision Cameras Market Revenue Share (%), by Type 2024 & 2032
- Figure 30: Australia and New Zealand Night Vision Cameras Market Revenue (Million), by End User 2024 & 2032
- Figure 31: Australia and New Zealand Night Vision Cameras Market Revenue Share (%), by End User 2024 & 2032
- Figure 32: Australia and New Zealand Night Vision Cameras Market Revenue (Million), by Country 2024 & 2032
- Figure 33: Australia and New Zealand Night Vision Cameras Market Revenue Share (%), by Country 2024 & 2032
- Figure 34: Latin America Night Vision Cameras Market Revenue (Million), by Type 2024 & 2032
- Figure 35: Latin America Night Vision Cameras Market Revenue Share (%), by Type 2024 & 2032
- Figure 36: Latin America Night Vision Cameras Market Revenue (Million), by End User 2024 & 2032
- Figure 37: Latin America Night Vision Cameras Market Revenue Share (%), by End User 2024 & 2032
- Figure 38: Latin America Night Vision Cameras Market Revenue (Million), by Country 2024 & 2032
- Figure 39: Latin America Night Vision Cameras Market Revenue Share (%), by Country 2024 & 2032
- Figure 40: Middle East and Africa Night Vision Cameras Market Revenue (Million), by Type 2024 & 2032
- Figure 41: Middle East and Africa Night Vision Cameras Market Revenue Share (%), by Type 2024 & 2032
- Figure 42: Middle East and Africa Night Vision Cameras Market Revenue (Million), by End User 2024 & 2032
- Figure 43: Middle East and Africa Night Vision Cameras Market Revenue Share (%), by End User 2024 & 2032
- Figure 44: Middle East and Africa Night Vision Cameras Market Revenue (Million), by Country 2024 & 2032
- Figure 45: Middle East and Africa Night Vision Cameras Market Revenue Share (%), by Country 2024 & 2032
List of Tables
- Table 1: Global Night Vision Cameras Market Revenue Million Forecast, by Region 2019 & 2032
- Table 2: Global Night Vision Cameras Market Revenue Million Forecast, by Type 2019 & 2032
- Table 3: Global Night Vision Cameras Market Revenue Million Forecast, by End User 2019 & 2032
- Table 4: Global Night Vision Cameras Market Revenue Million Forecast, by Region 2019 & 2032
- Table 5: Global Night Vision Cameras Market Revenue Million Forecast, by Country 2019 & 2032
- Table 6: Night Vision Cameras Market Revenue (Million) Forecast, by Application 2019 & 2032
- Table 7: Global Night Vision Cameras Market Revenue Million Forecast, by Country 2019 & 2032
- Table 8: Night Vision Cameras Market Revenue (Million) Forecast, by Application 2019 & 2032
- Table 9: Global Night Vision Cameras Market Revenue Million Forecast, by Country 2019 & 2032
- Table 10: Night Vision Cameras Market Revenue (Million) Forecast, by Application 2019 & 2032
- Table 11: Global Night Vision Cameras Market Revenue Million Forecast, by Country 2019 & 2032
- Table 12: Night Vision Cameras Market Revenue (Million) Forecast, by Application 2019 & 2032
- Table 13: Global Night Vision Cameras Market Revenue Million Forecast, by Type 2019 & 2032
- Table 14: Global Night Vision Cameras Market Revenue Million Forecast, by End User 2019 & 2032
- Table 15: Global Night Vision Cameras Market Revenue Million Forecast, by Country 2019 & 2032
- Table 16: Global Night Vision Cameras Market Revenue Million Forecast, by Type 2019 & 2032
- Table 17: Global Night Vision Cameras Market Revenue Million Forecast, by End User 2019 & 2032
- Table 18: Global Night Vision Cameras Market Revenue Million Forecast, by Country 2019 & 2032
- Table 19: Global Night Vision Cameras Market Revenue Million Forecast, by Type 2019 & 2032
- Table 20: Global Night Vision Cameras Market Revenue Million Forecast, by End User 2019 & 2032
- Table 21: Global Night Vision Cameras Market Revenue Million Forecast, by Country 2019 & 2032
- Table 22: Global Night Vision Cameras Market Revenue Million Forecast, by Type 2019 & 2032
- Table 23: Global Night Vision Cameras Market Revenue Million Forecast, by End User 2019 & 2032
- Table 24: Global Night Vision Cameras Market Revenue Million Forecast, by Country 2019 & 2032
- Table 25: Global Night Vision Cameras Market Revenue Million Forecast, by Type 2019 & 2032
- Table 26: Global Night Vision Cameras Market Revenue Million Forecast, by End User 2019 & 2032
- Table 27: Global Night Vision Cameras Market Revenue Million Forecast, by Country 2019 & 2032
- Table 28: Global Night Vision Cameras Market Revenue Million Forecast, by Type 2019 & 2032
- Table 29: Global Night Vision Cameras Market Revenue Million Forecast, by End User 2019 & 2032
- Table 30: Global Night Vision Cameras Market Revenue Million Forecast, by Country 2019 & 2032
Frequently Asked Questions
1. What is the projected Compound Annual Growth Rate (CAGR) of the Night Vision Cameras Market?
The projected CAGR is approximately 11.78%.
2. Which companies are prominent players in the Night Vision Cameras Market?
Key companies in the market include Sharp Corporation*List Not Exhaustive, General Dynamics Global Imaging Technologies Inc, TAK Technologies Private Limited, Elbit Systems Ltd, Nivisys LLC, Rockwell Collins Inc, Harris Corporation, BAE Systems PLC, Intevac Inc, Tactical Night Vision Company Inc, Panasonic Corporation, FLIR Systems Inc, Photonis, Sony Corporation.
3. What are the main segments of the Night Vision Cameras Market?
The market segments include Type, End User.
4. Can you provide details about the market size?
The market size is estimated to be USD 5.82 Million as of 2022.
5. What are some drivers contributing to market growth?
Rising Need for Advanced Surveillance Technology; Automotive Night Vision Applications.
6. What are the notable trends driving market growth?
Military and Defense Segment is Expected to Drive the Market.
7. Are there any restraints impacting market growth?
Targetting through Transparent Obstacles.
8. Can you provide examples of recent developments in the market?
October 2023: Google is in the process of implementing a solution to address the issue of blurry night vision on select Nest Cam models. According to a statement provided to 9to5Google, the fix is currently being deployed to the battery-powered Nest Cam model, the battery-powered Nest Doorbell, and the second-generation wired Nest Doorbell.
9. What pricing options are available for accessing the report?
Pricing options include single-user, multi-user, and enterprise licenses priced at USD 4750, USD 5250, and USD 8750 respectively.
10. Is the market size provided in terms of value or volume?
The market size is provided in terms of value, measured in Million.
11. Are there any specific market keywords associated with the report?
Yes, the market keyword associated with the report is "Night Vision Cameras Market," which aids in identifying and referencing the specific market segment covered.
12. How do I determine which pricing option suits my needs best?
The pricing options vary based on user requirements and access needs. Individual users may opt for single-user licenses, while businesses requiring broader access may choose multi-user or enterprise licenses for cost-effective access to the report.
13. Are there any additional resources or data provided in the Night Vision Cameras Market report?
While the report offers comprehensive insights, it's advisable to review the specific contents or supplementary materials provided to ascertain if additional resources or data are available.
14. How can I stay updated on further developments or reports in the Night Vision Cameras Market?
To stay informed about further developments, trends, and reports in the Night Vision Cameras Market, consider subscribing to industry newsletters, following relevant companies and organizations, or regularly checking reputable industry news sources and publications.
Methodology
Step 1 - Identification of Relevant Samples Size from Population Database


Step 2 - Approaches for Defining Global Market Size (Value, Volume* & Price*)

Note*: In applicable scenarios
Step 3 - Data Sources
Primary Research
- Web Analytics
- Survey Reports
- Research Institute
- Latest Research Reports
- Opinion Leaders
Secondary Research
- Annual Reports
- White Paper
- Latest Press Release
- Industry Association
- Paid Database
- Investor Presentations

Step 4 - Data Triangulation
Involves using different sources of information in order to increase the validity of a study
These sources are likely to be stakeholders in a program - participants, other researchers, program staff, other community members, and so on.
Then we put all data in single framework & apply various statistical tools to find out the dynamic on the market.
During the analysis stage, feedback from the stakeholder groups would be compared to determine areas of agreement as well as areas of divergence


