
Key Insights
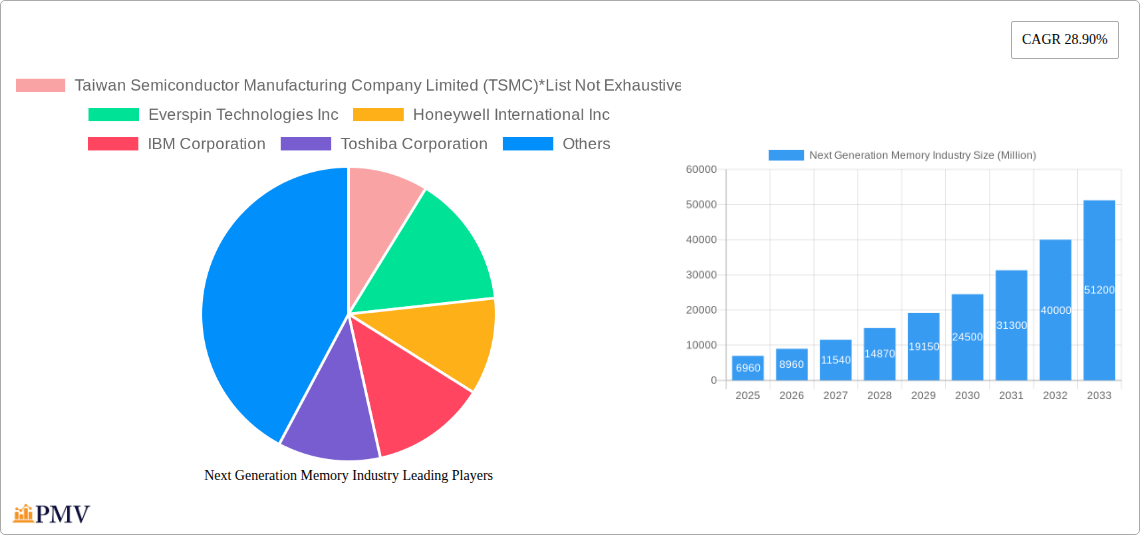
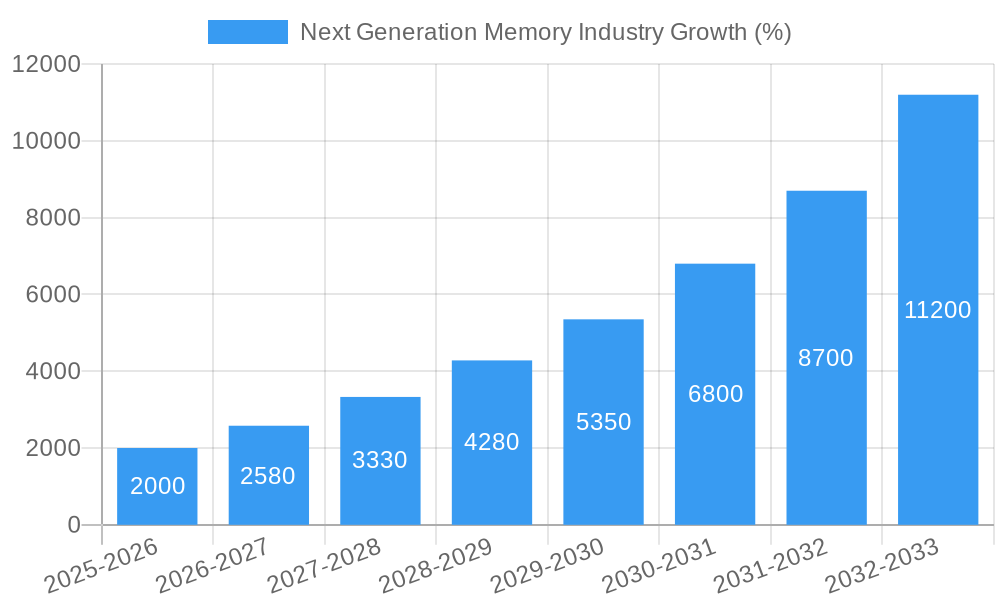
The Next Generation Memory (NGM) market is experiencing explosive growth, projected to reach a market size of $6.96 billion in 2025 and exhibiting a remarkable Compound Annual Growth Rate (CAGR) of 28.90%. This robust expansion is fueled by several key drivers. The increasing demand for high-performance computing, particularly in sectors like Artificial Intelligence (AI), machine learning, and high-performance computing (HPC), is a significant catalyst. Furthermore, the proliferation of mobile devices, IoT applications, and the burgeoning cloud computing infrastructure are creating a massive need for faster, denser, and more energy-efficient memory solutions. The shift towards advanced technologies like non-volatile memory (NVM), including Phase Change RAM (PCRAM) and STT-RAM, is further propelling market growth, as these technologies offer significant advantages in terms of speed, power consumption, and data retention compared to traditional volatile memory. The BFSI (Banking, Financial Services, and Insurance) sector is a key application area, driven by stringent data security and reliability requirements. Technological advancements, coupled with rising investments in research and development, are expected to sustain this growth trajectory.
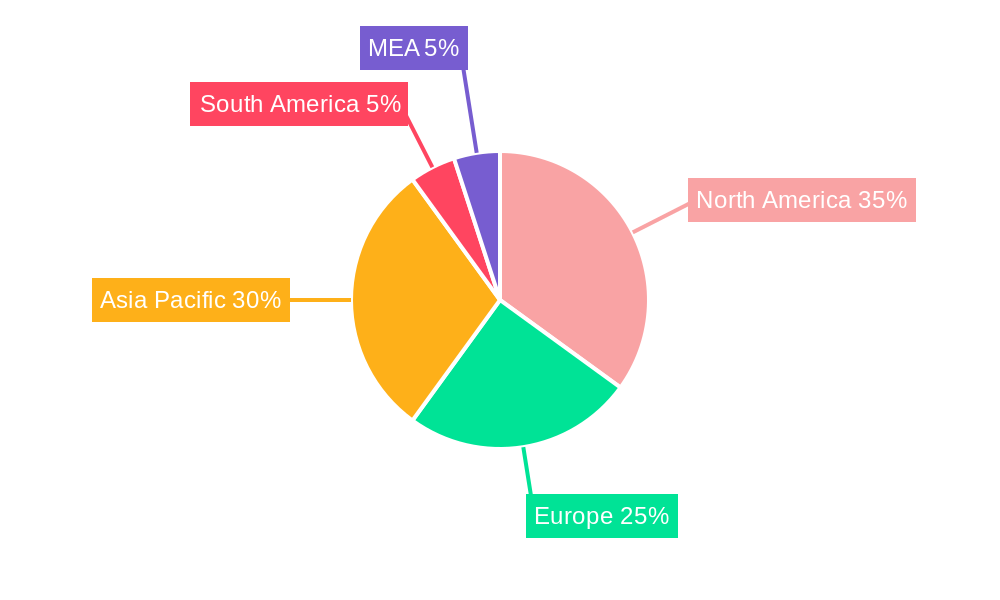
The NGM market is segmented by technology (volatile and non-volatile) and application (BFSI, consumer electronics, government, telecommunications, IT, and others). While non-volatile memory currently dominates the market, volatile memory continues to play a crucial role, particularly in high-speed applications. Geographical distribution shows strong growth across North America, Europe, and the Asia-Pacific region, with China, the United States, and Japan emerging as key markets. However, challenges remain, including high initial costs associated with some NGM technologies, which could hinder wider adoption in certain market segments. Competitive landscape analysis indicates major players like TSMC, Samsung, Micron, and Intel are heavily investing in research and development to capture significant market share. The ongoing innovation in materials science, chip architecture, and manufacturing processes will be crucial in shaping the future of the NGM market and ensuring its continued expansion throughout the forecast period (2025-2033).
Next Generation Memory Industry: A Comprehensive Market Report (2019-2033)
This comprehensive report provides an in-depth analysis of the Next Generation Memory industry, offering invaluable insights for businesses, investors, and stakeholders seeking to navigate this rapidly evolving landscape. With a study period spanning 2019-2033, a base year of 2025, and a forecast period of 2025-2033, this report presents a detailed overview of market size, segmentation, competitive dynamics, and future growth projections. The report incorporates data from the historical period (2019-2024) and the estimated year (2025) to provide a robust and reliable forecast. The global market size is projected to reach xx Million by 2033, exhibiting a CAGR of xx% during the forecast period.
Next Generation Memory Industry Market Structure & Competitive Dynamics
This section analyzes the competitive landscape of the next-generation memory market, examining market concentration, innovation ecosystems, regulatory frameworks, and key industry trends. The market is characterized by intense competition among a relatively small number of major players, with the top 5 companies holding approximately xx% of the market share in 2024. The industry exhibits a high degree of vertical integration, with some players controlling the entire value chain from design to manufacturing. Innovation ecosystems are crucial, driven by substantial R&D investments.
- Market Concentration: Highly concentrated, with significant market share held by a few dominant players.
- Innovation Ecosystems: Significant R&D investment fuels rapid technological advancements, particularly in areas like HBM and other non-volatile memory technologies.
- Regulatory Frameworks: Government policies and regulations concerning data security and intellectual property influence market dynamics.
- Product Substitutes: Emerging technologies constantly challenge existing memory solutions, creating competitive pressure.
- End-User Trends: The increasing demand for high-performance computing and data storage drives market growth.
- M&A Activities: Consolidation is anticipated, with significant M&A deals potentially reshaping the market landscape in the coming years. The total value of M&A deals in the next-generation memory sector is estimated at xx Million in 2024.
Next Generation Memory Industry Industry Trends & Insights
This section delves into the key trends shaping the next-generation memory market, including growth drivers, technological disruptions, and shifts in consumer preferences. The market is experiencing rapid growth fueled by the increasing demand for data storage and processing power across various applications. The widespread adoption of artificial intelligence (AI) and machine learning (ML) is a key driver, requiring high-bandwidth memory solutions to process vast amounts of data. Technological advancements, including the development of high-bandwidth memory (HBM), 3D NAND, and other non-volatile memory technologies, are constantly pushing the boundaries of performance and efficiency.
Technological disruptions, such as the development of new memory architectures and materials, are causing significant shifts in the competitive dynamics. Consumer preferences are shifting towards higher capacity, faster speeds, and lower power consumption. The market is expected to reach xx Million by 2033, with a CAGR of xx%. Market penetration for HBM technology is projected to reach xx% by 2033.
Dominant Markets & Segments in Next Generation Memory Industry
This section identifies the leading regions, countries, and market segments within the next-generation memory industry. The market is geographically diverse, with strong growth expected across several regions. By technology, non-volatile memory dominates the market, accounting for approximately xx% of the total market value. By application, the information technology segment is the largest, driven by the exponential growth of data centers and cloud computing. The telecommunications sector is also a significant driver, with considerable demand for high-bandwidth and low-latency memory solutions for 5G networks.
Key Drivers in Dominant Regions:
- North America: Strong technological innovation, significant investment in R&D, and a large consumer electronics market.
- Asia Pacific: High manufacturing capabilities, burgeoning electronics industry, and increasing adoption of AI and ML.
- Europe: Growing demand for high-performance computing, increasing data center infrastructure investments.
Dominant Segments:
- By Technology: Non-volatile memory solutions hold the largest market share.
- By Application: The Information Technology sector shows the highest growth.
Next Generation Memory Industry Product Innovations
Recent innovations are driving significant advancements in memory technology. The introduction of high-bandwidth memory (HBM) with significantly improved data transfer rates addresses the demanding needs of AI and high-performance computing applications. Other notable developments include advancements in 3D NAND technology, enabling higher densities and improved storage capabilities. These innovations enhance the performance, capacity, and energy efficiency of memory solutions, contributing to the overall growth of the market.
Report Segmentation & Scope
This report segments the next-generation memory market based on technology and application.
By Technology: The report analyzes the market for volatile memory (e.g., DRAM, SRAM) and non-volatile memory (e.g., NAND flash, NOR flash, emerging technologies like STT-RAM and Phase Change Memory). Each segment's growth projections, market sizes, and competitive dynamics are detailed.
By Application: The report analyzes various market applications, including BFSI, Consumer Electronics, Government, Telecommunications, Information Technology, and Other Applications. Each application segment's market size, growth rate, and key players are covered. Growth projections and competitive landscape analyses are provided for each segment.
Key Drivers of Next Generation Memory Industry Growth
Several factors propel the growth of the next-generation memory industry. Technological advancements in memory architectures (e.g., HBM) and materials are key drivers, enabling higher performance and density. The increasing demand for data storage and processing power across various industries fuels the need for advanced memory solutions. Government initiatives promoting technological innovation and investment in R&D further bolster market growth.
Challenges in the Next Generation Memory Industry Sector
The next-generation memory industry faces various challenges. Maintaining consistent supply chain operations amid global disruptions presents a significant hurdle. Intense competition from established and emerging players impacts profit margins. Regulatory changes related to data privacy and security necessitate considerable compliance efforts.
Leading Players in the Next Generation Memory Industry Market
- Taiwan Semiconductor Manufacturing Company Limited (TSMC)
- Everspin Technologies Inc
- Honeywell International Inc
- IBM Corporation
- Toshiba Corporation
- Fujitsu Ltd
- Adesto Technologies
- Cypress Semiconductor Corporation
- Samsung Electronics Co Ltd
- Crossbar Inc
- Micron Technologies Inc
- SK Hynix Inc
- Avalanche Technologies Inc
- Intel Corporation
- Sony Corporation
Key Developments in Next Generation Memory Industry Sector
- October 2023: Samsung unveiled next-generation memory solutions, including Shinebolt HBM3e memory, LPDDR5X CAMM2, and detachable AutoSSD, targeting AI applications and revolutionizing PC/laptop DRAM.
- August 2023: SK Hynix launched its 5th generation HBM3E DRAM, designed for high-performance AI applications, intensifying competition in the high-bandwidth memory market.
Strategic Next Generation Memory Industry Market Outlook
The next-generation memory market is poised for significant growth, driven by the increasing adoption of AI, 5G, and high-performance computing. Strategic opportunities exist for companies that can innovate, develop high-performance memory solutions, and secure supply chains. Expansion into emerging markets and strategic partnerships offer significant potential for future growth.
Next Generation Memory Industry Segmentation
-
1. Technology
-
1.1. Non-volatile
- 1.1.1. Magneto-Resistive Random-Access Memory (MRAM)
- 1.1.2. Ferroelectric RAM (FRAM)
- 1.1.3. Resistive Random-Access Memory (ReRAM)
- 1.1.4. 3D Xpoint
- 1.1.5. Nano RAM
- 1.1.6. Other No
-
1.2. Volatile
- 1.2.1. Hybrid Memory Cube (HMC)
- 1.2.2. High-bandwidth Memory (HBM)
-
1.1. Non-volatile
-
2. Application
- 2.1. BFSI
- 2.2. Consumer Electronics
- 2.3. Government
- 2.4. Telecommunications
- 2.5. Information Technology
- 2.6. Other Applications
Next Generation Memory Industry Segmentation By Geography
- 1. North America
- 2. Europe
- 3. Asia Pacific
- 4. Latin America
- 5. Middle East
Next Generation Memory Industry REPORT HIGHLIGHTS
| Aspects | Details |
|---|---|
| Study Period | 2019-2033 |
| Base Year | 2024 |
| Estimated Year | 2025 |
| Forecast Period | 2025-2033 |
| Historical Period | 2019-2024 |
| Growth Rate | CAGR of 28.90% from 2019-2033 |
| Segmentation |
|
Table of Contents
- 1. Introduction
- 1.1. Research Scope
- 1.2. Market Segmentation
- 1.3. Research Methodology
- 1.4. Definitions and Assumptions
- 2. Executive Summary
- 2.1. Introduction
- 3. Market Dynamics
- 3.1. Introduction
- 3.2. Market Drivers
- 3.2.1. Demand for Universal Memory Devices; Increasing Demand for Enterprise Storage Applications
- 3.3. Market Restrains
- 3.3.1. Lack of Stability Under Extreme Environmental Conditions
- 3.4. Market Trends
- 3.4.1. Information Technology Application will Have Significant Share in the Market
- 4. Market Factor Analysis
- 4.1. Porters Five Forces
- 4.2. Supply/Value Chain
- 4.3. PESTEL analysis
- 4.4. Market Entropy
- 4.5. Patent/Trademark Analysis
- 5. Global Next Generation Memory Industry Analysis, Insights and Forecast, 2019-2031
- 5.1. Market Analysis, Insights and Forecast - by Technology
- 5.1.1. Non-volatile
- 5.1.1.1. Magneto-Resistive Random-Access Memory (MRAM)
- 5.1.1.2. Ferroelectric RAM (FRAM)
- 5.1.1.3. Resistive Random-Access Memory (ReRAM)
- 5.1.1.4. 3D Xpoint
- 5.1.1.5. Nano RAM
- 5.1.1.6. Other No
- 5.1.2. Volatile
- 5.1.2.1. Hybrid Memory Cube (HMC)
- 5.1.2.2. High-bandwidth Memory (HBM)
- 5.1.1. Non-volatile
- 5.2. Market Analysis, Insights and Forecast - by Application
- 5.2.1. BFSI
- 5.2.2. Consumer Electronics
- 5.2.3. Government
- 5.2.4. Telecommunications
- 5.2.5. Information Technology
- 5.2.6. Other Applications
- 5.3. Market Analysis, Insights and Forecast - by Region
- 5.3.1. North America
- 5.3.2. Europe
- 5.3.3. Asia Pacific
- 5.3.4. Latin America
- 5.3.5. Middle East
- 5.1. Market Analysis, Insights and Forecast - by Technology
- 6. North America Next Generation Memory Industry Analysis, Insights and Forecast, 2019-2031
- 6.1. Market Analysis, Insights and Forecast - by Technology
- 6.1.1. Non-volatile
- 6.1.1.1. Magneto-Resistive Random-Access Memory (MRAM)
- 6.1.1.2. Ferroelectric RAM (FRAM)
- 6.1.1.3. Resistive Random-Access Memory (ReRAM)
- 6.1.1.4. 3D Xpoint
- 6.1.1.5. Nano RAM
- 6.1.1.6. Other No
- 6.1.2. Volatile
- 6.1.2.1. Hybrid Memory Cube (HMC)
- 6.1.2.2. High-bandwidth Memory (HBM)
- 6.1.1. Non-volatile
- 6.2. Market Analysis, Insights and Forecast - by Application
- 6.2.1. BFSI
- 6.2.2. Consumer Electronics
- 6.2.3. Government
- 6.2.4. Telecommunications
- 6.2.5. Information Technology
- 6.2.6. Other Applications
- 6.1. Market Analysis, Insights and Forecast - by Technology
- 7. Europe Next Generation Memory Industry Analysis, Insights and Forecast, 2019-2031
- 7.1. Market Analysis, Insights and Forecast - by Technology
- 7.1.1. Non-volatile
- 7.1.1.1. Magneto-Resistive Random-Access Memory (MRAM)
- 7.1.1.2. Ferroelectric RAM (FRAM)
- 7.1.1.3. Resistive Random-Access Memory (ReRAM)
- 7.1.1.4. 3D Xpoint
- 7.1.1.5. Nano RAM
- 7.1.1.6. Other No
- 7.1.2. Volatile
- 7.1.2.1. Hybrid Memory Cube (HMC)
- 7.1.2.2. High-bandwidth Memory (HBM)
- 7.1.1. Non-volatile
- 7.2. Market Analysis, Insights and Forecast - by Application
- 7.2.1. BFSI
- 7.2.2. Consumer Electronics
- 7.2.3. Government
- 7.2.4. Telecommunications
- 7.2.5. Information Technology
- 7.2.6. Other Applications
- 7.1. Market Analysis, Insights and Forecast - by Technology
- 8. Asia Pacific Next Generation Memory Industry Analysis, Insights and Forecast, 2019-2031
- 8.1. Market Analysis, Insights and Forecast - by Technology
- 8.1.1. Non-volatile
- 8.1.1.1. Magneto-Resistive Random-Access Memory (MRAM)
- 8.1.1.2. Ferroelectric RAM (FRAM)
- 8.1.1.3. Resistive Random-Access Memory (ReRAM)
- 8.1.1.4. 3D Xpoint
- 8.1.1.5. Nano RAM
- 8.1.1.6. Other No
- 8.1.2. Volatile
- 8.1.2.1. Hybrid Memory Cube (HMC)
- 8.1.2.2. High-bandwidth Memory (HBM)
- 8.1.1. Non-volatile
- 8.2. Market Analysis, Insights and Forecast - by Application
- 8.2.1. BFSI
- 8.2.2. Consumer Electronics
- 8.2.3. Government
- 8.2.4. Telecommunications
- 8.2.5. Information Technology
- 8.2.6. Other Applications
- 8.1. Market Analysis, Insights and Forecast - by Technology
- 9. Latin America Next Generation Memory Industry Analysis, Insights and Forecast, 2019-2031
- 9.1. Market Analysis, Insights and Forecast - by Technology
- 9.1.1. Non-volatile
- 9.1.1.1. Magneto-Resistive Random-Access Memory (MRAM)
- 9.1.1.2. Ferroelectric RAM (FRAM)
- 9.1.1.3. Resistive Random-Access Memory (ReRAM)
- 9.1.1.4. 3D Xpoint
- 9.1.1.5. Nano RAM
- 9.1.1.6. Other No
- 9.1.2. Volatile
- 9.1.2.1. Hybrid Memory Cube (HMC)
- 9.1.2.2. High-bandwidth Memory (HBM)
- 9.1.1. Non-volatile
- 9.2. Market Analysis, Insights and Forecast - by Application
- 9.2.1. BFSI
- 9.2.2. Consumer Electronics
- 9.2.3. Government
- 9.2.4. Telecommunications
- 9.2.5. Information Technology
- 9.2.6. Other Applications
- 9.1. Market Analysis, Insights and Forecast - by Technology
- 10. Middle East Next Generation Memory Industry Analysis, Insights and Forecast, 2019-2031
- 10.1. Market Analysis, Insights and Forecast - by Technology
- 10.1.1. Non-volatile
- 10.1.1.1. Magneto-Resistive Random-Access Memory (MRAM)
- 10.1.1.2. Ferroelectric RAM (FRAM)
- 10.1.1.3. Resistive Random-Access Memory (ReRAM)
- 10.1.1.4. 3D Xpoint
- 10.1.1.5. Nano RAM
- 10.1.1.6. Other No
- 10.1.2. Volatile
- 10.1.2.1. Hybrid Memory Cube (HMC)
- 10.1.2.2. High-bandwidth Memory (HBM)
- 10.1.1. Non-volatile
- 10.2. Market Analysis, Insights and Forecast - by Application
- 10.2.1. BFSI
- 10.2.2. Consumer Electronics
- 10.2.3. Government
- 10.2.4. Telecommunications
- 10.2.5. Information Technology
- 10.2.6. Other Applications
- 10.1. Market Analysis, Insights and Forecast - by Technology
- 11. North America Next Generation Memory Industry Analysis, Insights and Forecast, 2019-2031
- 11.1. Market Analysis, Insights and Forecast - By Country/Sub-region
- 11.1.1 United States
- 11.1.2 Canada
- 11.1.3 Mexico
- 12. Europe Next Generation Memory Industry Analysis, Insights and Forecast, 2019-2031
- 12.1. Market Analysis, Insights and Forecast - By Country/Sub-region
- 12.1.1 Germany
- 12.1.2 United Kingdom
- 12.1.3 France
- 12.1.4 Spain
- 12.1.5 Italy
- 12.1.6 Spain
- 12.1.7 Belgium
- 12.1.8 Netherland
- 12.1.9 Nordics
- 12.1.10 Rest of Europe
- 13. Asia Pacific Next Generation Memory Industry Analysis, Insights and Forecast, 2019-2031
- 13.1. Market Analysis, Insights and Forecast - By Country/Sub-region
- 13.1.1 China
- 13.1.2 Japan
- 13.1.3 India
- 13.1.4 South Korea
- 13.1.5 Southeast Asia
- 13.1.6 Australia
- 13.1.7 Indonesia
- 13.1.8 Phillipes
- 13.1.9 Singapore
- 13.1.10 Thailandc
- 13.1.11 Rest of Asia Pacific
- 14. South America Next Generation Memory Industry Analysis, Insights and Forecast, 2019-2031
- 14.1. Market Analysis, Insights and Forecast - By Country/Sub-region
- 14.1.1 Brazil
- 14.1.2 Argentina
- 14.1.3 Peru
- 14.1.4 Chile
- 14.1.5 Colombia
- 14.1.6 Ecuador
- 14.1.7 Venezuela
- 14.1.8 Rest of South America
- 15. North America Next Generation Memory Industry Analysis, Insights and Forecast, 2019-2031
- 15.1. Market Analysis, Insights and Forecast - By Country/Sub-region
- 15.1.1 United States
- 15.1.2 Canada
- 15.1.3 Mexico
- 16. MEA Next Generation Memory Industry Analysis, Insights and Forecast, 2019-2031
- 16.1. Market Analysis, Insights and Forecast - By Country/Sub-region
- 16.1.1 United Arab Emirates
- 16.1.2 Saudi Arabia
- 16.1.3 South Africa
- 16.1.4 Rest of Middle East and Africa
- 17. Competitive Analysis
- 17.1. Global Market Share Analysis 2024
- 17.2. Company Profiles
- 17.2.1 Taiwan Semiconductor Manufacturing Company Limited (TSMC)*List Not Exhaustive
- 17.2.1.1. Overview
- 17.2.1.2. Products
- 17.2.1.3. SWOT Analysis
- 17.2.1.4. Recent Developments
- 17.2.1.5. Financials (Based on Availability)
- 17.2.2 Everspin Technologies Inc
- 17.2.2.1. Overview
- 17.2.2.2. Products
- 17.2.2.3. SWOT Analysis
- 17.2.2.4. Recent Developments
- 17.2.2.5. Financials (Based on Availability)
- 17.2.3 Honeywell International Inc
- 17.2.3.1. Overview
- 17.2.3.2. Products
- 17.2.3.3. SWOT Analysis
- 17.2.3.4. Recent Developments
- 17.2.3.5. Financials (Based on Availability)
- 17.2.4 IBM Corporation
- 17.2.4.1. Overview
- 17.2.4.2. Products
- 17.2.4.3. SWOT Analysis
- 17.2.4.4. Recent Developments
- 17.2.4.5. Financials (Based on Availability)
- 17.2.5 Toshiba Corporation
- 17.2.5.1. Overview
- 17.2.5.2. Products
- 17.2.5.3. SWOT Analysis
- 17.2.5.4. Recent Developments
- 17.2.5.5. Financials (Based on Availability)
- 17.2.6 Fujitsu Ltd
- 17.2.6.1. Overview
- 17.2.6.2. Products
- 17.2.6.3. SWOT Analysis
- 17.2.6.4. Recent Developments
- 17.2.6.5. Financials (Based on Availability)
- 17.2.7 Adesto Technologies
- 17.2.7.1. Overview
- 17.2.7.2. Products
- 17.2.7.3. SWOT Analysis
- 17.2.7.4. Recent Developments
- 17.2.7.5. Financials (Based on Availability)
- 17.2.8 Cypress Semiconductor Corporation
- 17.2.8.1. Overview
- 17.2.8.2. Products
- 17.2.8.3. SWOT Analysis
- 17.2.8.4. Recent Developments
- 17.2.8.5. Financials (Based on Availability)
- 17.2.9 Samsung Electronics Co Ltd
- 17.2.9.1. Overview
- 17.2.9.2. Products
- 17.2.9.3. SWOT Analysis
- 17.2.9.4. Recent Developments
- 17.2.9.5. Financials (Based on Availability)
- 17.2.10 Crossbar Inc
- 17.2.10.1. Overview
- 17.2.10.2. Products
- 17.2.10.3. SWOT Analysis
- 17.2.10.4. Recent Developments
- 17.2.10.5. Financials (Based on Availability)
- 17.2.11 Micron Technologies Inc
- 17.2.11.1. Overview
- 17.2.11.2. Products
- 17.2.11.3. SWOT Analysis
- 17.2.11.4. Recent Developments
- 17.2.11.5. Financials (Based on Availability)
- 17.2.12 SK Hynix Inc
- 17.2.12.1. Overview
- 17.2.12.2. Products
- 17.2.12.3. SWOT Analysis
- 17.2.12.4. Recent Developments
- 17.2.12.5. Financials (Based on Availability)
- 17.2.13 Avalanche Technologies Inc
- 17.2.13.1. Overview
- 17.2.13.2. Products
- 17.2.13.3. SWOT Analysis
- 17.2.13.4. Recent Developments
- 17.2.13.5. Financials (Based on Availability)
- 17.2.14 Intel Corporation
- 17.2.14.1. Overview
- 17.2.14.2. Products
- 17.2.14.3. SWOT Analysis
- 17.2.14.4. Recent Developments
- 17.2.14.5. Financials (Based on Availability)
- 17.2.15 Sony Corporation
- 17.2.15.1. Overview
- 17.2.15.2. Products
- 17.2.15.3. SWOT Analysis
- 17.2.15.4. Recent Developments
- 17.2.15.5. Financials (Based on Availability)
- 17.2.1 Taiwan Semiconductor Manufacturing Company Limited (TSMC)*List Not Exhaustive
List of Figures
- Figure 1: Global Next Generation Memory Industry Revenue Breakdown (Million, %) by Region 2024 & 2032
- Figure 2: North America Next Generation Memory Industry Revenue (Million), by Country 2024 & 2032
- Figure 3: North America Next Generation Memory Industry Revenue Share (%), by Country 2024 & 2032
- Figure 4: Europe Next Generation Memory Industry Revenue (Million), by Country 2024 & 2032
- Figure 5: Europe Next Generation Memory Industry Revenue Share (%), by Country 2024 & 2032
- Figure 6: Asia Pacific Next Generation Memory Industry Revenue (Million), by Country 2024 & 2032
- Figure 7: Asia Pacific Next Generation Memory Industry Revenue Share (%), by Country 2024 & 2032
- Figure 8: South America Next Generation Memory Industry Revenue (Million), by Country 2024 & 2032
- Figure 9: South America Next Generation Memory Industry Revenue Share (%), by Country 2024 & 2032
- Figure 10: North America Next Generation Memory Industry Revenue (Million), by Country 2024 & 2032
- Figure 11: North America Next Generation Memory Industry Revenue Share (%), by Country 2024 & 2032
- Figure 12: MEA Next Generation Memory Industry Revenue (Million), by Country 2024 & 2032
- Figure 13: MEA Next Generation Memory Industry Revenue Share (%), by Country 2024 & 2032
- Figure 14: North America Next Generation Memory Industry Revenue (Million), by Technology 2024 & 2032
- Figure 15: North America Next Generation Memory Industry Revenue Share (%), by Technology 2024 & 2032
- Figure 16: North America Next Generation Memory Industry Revenue (Million), by Application 2024 & 2032
- Figure 17: North America Next Generation Memory Industry Revenue Share (%), by Application 2024 & 2032
- Figure 18: North America Next Generation Memory Industry Revenue (Million), by Country 2024 & 2032
- Figure 19: North America Next Generation Memory Industry Revenue Share (%), by Country 2024 & 2032
- Figure 20: Europe Next Generation Memory Industry Revenue (Million), by Technology 2024 & 2032
- Figure 21: Europe Next Generation Memory Industry Revenue Share (%), by Technology 2024 & 2032
- Figure 22: Europe Next Generation Memory Industry Revenue (Million), by Application 2024 & 2032
- Figure 23: Europe Next Generation Memory Industry Revenue Share (%), by Application 2024 & 2032
- Figure 24: Europe Next Generation Memory Industry Revenue (Million), by Country 2024 & 2032
- Figure 25: Europe Next Generation Memory Industry Revenue Share (%), by Country 2024 & 2032
- Figure 26: Asia Pacific Next Generation Memory Industry Revenue (Million), by Technology 2024 & 2032
- Figure 27: Asia Pacific Next Generation Memory Industry Revenue Share (%), by Technology 2024 & 2032
- Figure 28: Asia Pacific Next Generation Memory Industry Revenue (Million), by Application 2024 & 2032
- Figure 29: Asia Pacific Next Generation Memory Industry Revenue Share (%), by Application 2024 & 2032
- Figure 30: Asia Pacific Next Generation Memory Industry Revenue (Million), by Country 2024 & 2032
- Figure 31: Asia Pacific Next Generation Memory Industry Revenue Share (%), by Country 2024 & 2032
- Figure 32: Latin America Next Generation Memory Industry Revenue (Million), by Technology 2024 & 2032
- Figure 33: Latin America Next Generation Memory Industry Revenue Share (%), by Technology 2024 & 2032
- Figure 34: Latin America Next Generation Memory Industry Revenue (Million), by Application 2024 & 2032
- Figure 35: Latin America Next Generation Memory Industry Revenue Share (%), by Application 2024 & 2032
- Figure 36: Latin America Next Generation Memory Industry Revenue (Million), by Country 2024 & 2032
- Figure 37: Latin America Next Generation Memory Industry Revenue Share (%), by Country 2024 & 2032
- Figure 38: Middle East Next Generation Memory Industry Revenue (Million), by Technology 2024 & 2032
- Figure 39: Middle East Next Generation Memory Industry Revenue Share (%), by Technology 2024 & 2032
- Figure 40: Middle East Next Generation Memory Industry Revenue (Million), by Application 2024 & 2032
- Figure 41: Middle East Next Generation Memory Industry Revenue Share (%), by Application 2024 & 2032
- Figure 42: Middle East Next Generation Memory Industry Revenue (Million), by Country 2024 & 2032
- Figure 43: Middle East Next Generation Memory Industry Revenue Share (%), by Country 2024 & 2032
List of Tables
- Table 1: Global Next Generation Memory Industry Revenue Million Forecast, by Region 2019 & 2032
- Table 2: Global Next Generation Memory Industry Revenue Million Forecast, by Technology 2019 & 2032
- Table 3: Global Next Generation Memory Industry Revenue Million Forecast, by Application 2019 & 2032
- Table 4: Global Next Generation Memory Industry Revenue Million Forecast, by Region 2019 & 2032
- Table 5: Global Next Generation Memory Industry Revenue Million Forecast, by Country 2019 & 2032
- Table 6: United States Next Generation Memory Industry Revenue (Million) Forecast, by Application 2019 & 2032
- Table 7: Canada Next Generation Memory Industry Revenue (Million) Forecast, by Application 2019 & 2032
- Table 8: Mexico Next Generation Memory Industry Revenue (Million) Forecast, by Application 2019 & 2032
- Table 9: Global Next Generation Memory Industry Revenue Million Forecast, by Country 2019 & 2032
- Table 10: Germany Next Generation Memory Industry Revenue (Million) Forecast, by Application 2019 & 2032
- Table 11: United Kingdom Next Generation Memory Industry Revenue (Million) Forecast, by Application 2019 & 2032
- Table 12: France Next Generation Memory Industry Revenue (Million) Forecast, by Application 2019 & 2032
- Table 13: Spain Next Generation Memory Industry Revenue (Million) Forecast, by Application 2019 & 2032
- Table 14: Italy Next Generation Memory Industry Revenue (Million) Forecast, by Application 2019 & 2032
- Table 15: Spain Next Generation Memory Industry Revenue (Million) Forecast, by Application 2019 & 2032
- Table 16: Belgium Next Generation Memory Industry Revenue (Million) Forecast, by Application 2019 & 2032
- Table 17: Netherland Next Generation Memory Industry Revenue (Million) Forecast, by Application 2019 & 2032
- Table 18: Nordics Next Generation Memory Industry Revenue (Million) Forecast, by Application 2019 & 2032
- Table 19: Rest of Europe Next Generation Memory Industry Revenue (Million) Forecast, by Application 2019 & 2032
- Table 20: Global Next Generation Memory Industry Revenue Million Forecast, by Country 2019 & 2032
- Table 21: China Next Generation Memory Industry Revenue (Million) Forecast, by Application 2019 & 2032
- Table 22: Japan Next Generation Memory Industry Revenue (Million) Forecast, by Application 2019 & 2032
- Table 23: India Next Generation Memory Industry Revenue (Million) Forecast, by Application 2019 & 2032
- Table 24: South Korea Next Generation Memory Industry Revenue (Million) Forecast, by Application 2019 & 2032
- Table 25: Southeast Asia Next Generation Memory Industry Revenue (Million) Forecast, by Application 2019 & 2032
- Table 26: Australia Next Generation Memory Industry Revenue (Million) Forecast, by Application 2019 & 2032
- Table 27: Indonesia Next Generation Memory Industry Revenue (Million) Forecast, by Application 2019 & 2032
- Table 28: Phillipes Next Generation Memory Industry Revenue (Million) Forecast, by Application 2019 & 2032
- Table 29: Singapore Next Generation Memory Industry Revenue (Million) Forecast, by Application 2019 & 2032
- Table 30: Thailandc Next Generation Memory Industry Revenue (Million) Forecast, by Application 2019 & 2032
- Table 31: Rest of Asia Pacific Next Generation Memory Industry Revenue (Million) Forecast, by Application 2019 & 2032
- Table 32: Global Next Generation Memory Industry Revenue Million Forecast, by Country 2019 & 2032
- Table 33: Brazil Next Generation Memory Industry Revenue (Million) Forecast, by Application 2019 & 2032
- Table 34: Argentina Next Generation Memory Industry Revenue (Million) Forecast, by Application 2019 & 2032
- Table 35: Peru Next Generation Memory Industry Revenue (Million) Forecast, by Application 2019 & 2032
- Table 36: Chile Next Generation Memory Industry Revenue (Million) Forecast, by Application 2019 & 2032
- Table 37: Colombia Next Generation Memory Industry Revenue (Million) Forecast, by Application 2019 & 2032
- Table 38: Ecuador Next Generation Memory Industry Revenue (Million) Forecast, by Application 2019 & 2032
- Table 39: Venezuela Next Generation Memory Industry Revenue (Million) Forecast, by Application 2019 & 2032
- Table 40: Rest of South America Next Generation Memory Industry Revenue (Million) Forecast, by Application 2019 & 2032
- Table 41: Global Next Generation Memory Industry Revenue Million Forecast, by Country 2019 & 2032
- Table 42: United States Next Generation Memory Industry Revenue (Million) Forecast, by Application 2019 & 2032
- Table 43: Canada Next Generation Memory Industry Revenue (Million) Forecast, by Application 2019 & 2032
- Table 44: Mexico Next Generation Memory Industry Revenue (Million) Forecast, by Application 2019 & 2032
- Table 45: Global Next Generation Memory Industry Revenue Million Forecast, by Country 2019 & 2032
- Table 46: United Arab Emirates Next Generation Memory Industry Revenue (Million) Forecast, by Application 2019 & 2032
- Table 47: Saudi Arabia Next Generation Memory Industry Revenue (Million) Forecast, by Application 2019 & 2032
- Table 48: South Africa Next Generation Memory Industry Revenue (Million) Forecast, by Application 2019 & 2032
- Table 49: Rest of Middle East and Africa Next Generation Memory Industry Revenue (Million) Forecast, by Application 2019 & 2032
- Table 50: Global Next Generation Memory Industry Revenue Million Forecast, by Technology 2019 & 2032
- Table 51: Global Next Generation Memory Industry Revenue Million Forecast, by Application 2019 & 2032
- Table 52: Global Next Generation Memory Industry Revenue Million Forecast, by Country 2019 & 2032
- Table 53: Global Next Generation Memory Industry Revenue Million Forecast, by Technology 2019 & 2032
- Table 54: Global Next Generation Memory Industry Revenue Million Forecast, by Application 2019 & 2032
- Table 55: Global Next Generation Memory Industry Revenue Million Forecast, by Country 2019 & 2032
- Table 56: Global Next Generation Memory Industry Revenue Million Forecast, by Technology 2019 & 2032
- Table 57: Global Next Generation Memory Industry Revenue Million Forecast, by Application 2019 & 2032
- Table 58: Global Next Generation Memory Industry Revenue Million Forecast, by Country 2019 & 2032
- Table 59: Global Next Generation Memory Industry Revenue Million Forecast, by Technology 2019 & 2032
- Table 60: Global Next Generation Memory Industry Revenue Million Forecast, by Application 2019 & 2032
- Table 61: Global Next Generation Memory Industry Revenue Million Forecast, by Country 2019 & 2032
- Table 62: Global Next Generation Memory Industry Revenue Million Forecast, by Technology 2019 & 2032
- Table 63: Global Next Generation Memory Industry Revenue Million Forecast, by Application 2019 & 2032
- Table 64: Global Next Generation Memory Industry Revenue Million Forecast, by Country 2019 & 2032
Frequently Asked Questions
1. What is the projected Compound Annual Growth Rate (CAGR) of the Next Generation Memory Industry?
The projected CAGR is approximately 28.90%.
2. Which companies are prominent players in the Next Generation Memory Industry?
Key companies in the market include Taiwan Semiconductor Manufacturing Company Limited (TSMC)*List Not Exhaustive, Everspin Technologies Inc, Honeywell International Inc, IBM Corporation, Toshiba Corporation, Fujitsu Ltd, Adesto Technologies, Cypress Semiconductor Corporation, Samsung Electronics Co Ltd, Crossbar Inc, Micron Technologies Inc, SK Hynix Inc, Avalanche Technologies Inc, Intel Corporation, Sony Corporation.
3. What are the main segments of the Next Generation Memory Industry?
The market segments include Technology, Application.
4. Can you provide details about the market size?
The market size is estimated to be USD 6.96 Million as of 2022.
5. What are some drivers contributing to market growth?
Demand for Universal Memory Devices; Increasing Demand for Enterprise Storage Applications.
6. What are the notable trends driving market growth?
Information Technology Application will Have Significant Share in the Market.
7. Are there any restraints impacting market growth?
Lack of Stability Under Extreme Environmental Conditions.
8. Can you provide examples of recent developments in the market?
October 2023: Samsung introduced its next-generation memory solutions on Memory Tech Day, with the aim of playing a significant role in offering advanced artificial intelligence models for hyperscale applications. The company has unveiled a range of cutting-edge memory solutions, such as the latest Shinebolt HBM3e memory, the LPDDR5X CAMM2 solutions based on LPDDR package modules, and the detachable AutoSSD that can be conveniently used through storage virtualization. This innovative chip has the potential to revolutionize the future PC and laptop DRAM market.
9. What pricing options are available for accessing the report?
Pricing options include single-user, multi-user, and enterprise licenses priced at USD 4750, USD 5250, and USD 8750 respectively.
10. Is the market size provided in terms of value or volume?
The market size is provided in terms of value, measured in Million.
11. Are there any specific market keywords associated with the report?
Yes, the market keyword associated with the report is "Next Generation Memory Industry," which aids in identifying and referencing the specific market segment covered.
12. How do I determine which pricing option suits my needs best?
The pricing options vary based on user requirements and access needs. Individual users may opt for single-user licenses, while businesses requiring broader access may choose multi-user or enterprise licenses for cost-effective access to the report.
13. Are there any additional resources or data provided in the Next Generation Memory Industry report?
While the report offers comprehensive insights, it's advisable to review the specific contents or supplementary materials provided to ascertain if additional resources or data are available.
14. How can I stay updated on further developments or reports in the Next Generation Memory Industry?
To stay informed about further developments, trends, and reports in the Next Generation Memory Industry, consider subscribing to industry newsletters, following relevant companies and organizations, or regularly checking reputable industry news sources and publications.
Methodology
Step 1 - Identification of Relevant Samples Size from Population Database


Step 2 - Approaches for Defining Global Market Size (Value, Volume* & Price*)

Note*: In applicable scenarios
Step 3 - Data Sources
Primary Research
- Web Analytics
- Survey Reports
- Research Institute
- Latest Research Reports
- Opinion Leaders
Secondary Research
- Annual Reports
- White Paper
- Latest Press Release
- Industry Association
- Paid Database
- Investor Presentations

Step 4 - Data Triangulation
Involves using different sources of information in order to increase the validity of a study
These sources are likely to be stakeholders in a program - participants, other researchers, program staff, other community members, and so on.
Then we put all data in single framework & apply various statistical tools to find out the dynamic on the market.
During the analysis stage, feedback from the stakeholder groups would be compared to determine areas of agreement as well as areas of divergence


