
Key Insights
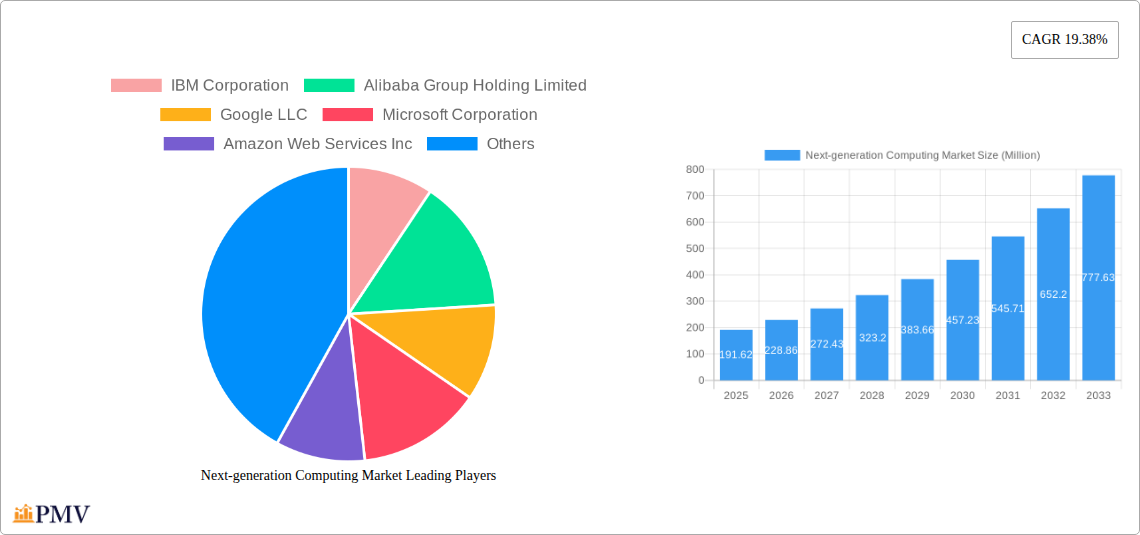
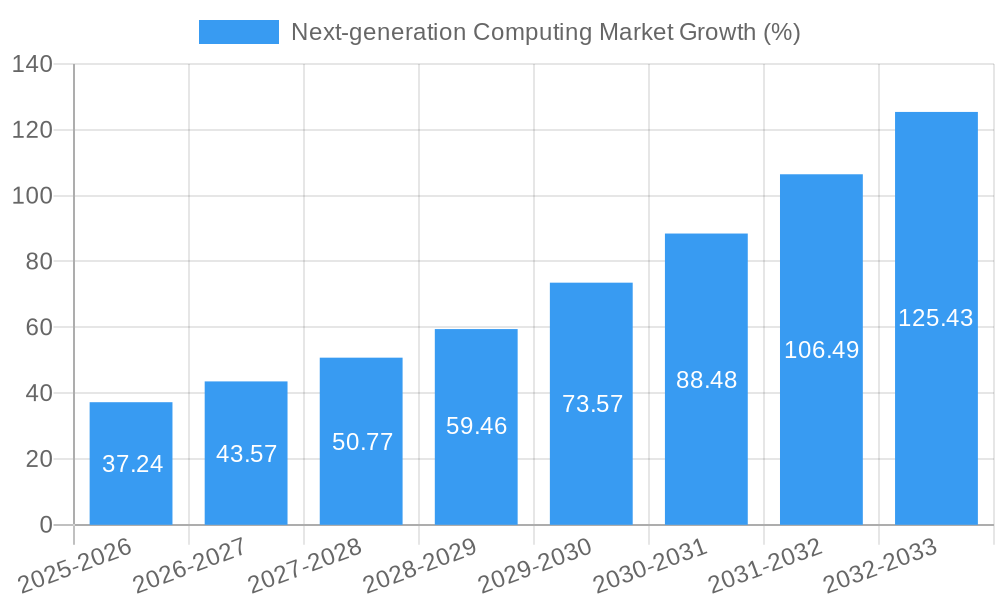
The next-generation computing market is experiencing explosive growth, projected to reach \$191.62 million in 2025 and exhibiting a robust Compound Annual Growth Rate (CAGR) of 19.38%. This expansion is fueled by several key drivers. The increasing demand for high-performance computing (HPC) in sectors like automotive, healthcare, and finance is a significant factor. Advancements in quantum computing and optical computing are opening new possibilities for complex problem-solving and data processing, attracting significant investment and driving market growth. Furthermore, the proliferation of edge computing, enabling real-time data processing closer to the source, is further accelerating market expansion. The shift towards cloud deployment models, offering scalability and cost-effectiveness, also contributes significantly to this growth. While the market faces certain restraints, such as the high initial investment costs associated with advanced computing technologies and the need for skilled professionals to manage these complex systems, these challenges are being steadily addressed through technological advancements and increased accessibility.
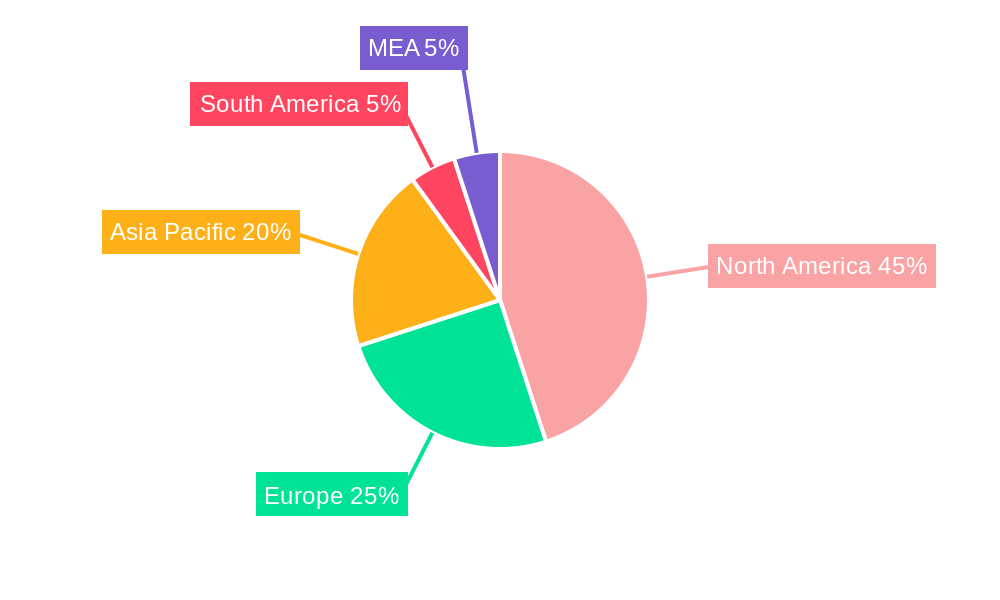
The market segmentation reveals a diverse landscape. Hardware constitutes a substantial portion of the market, with software and services playing increasingly important roles. High-performance computing currently dominates the computing type segment, but quantum and optical computing are rapidly gaining traction. North America currently holds a leading market share, driven by strong technological advancements and early adoption. However, Asia-Pacific is poised for significant growth, fueled by increasing digitalization and government initiatives. Major players like IBM, Google, and Microsoft are at the forefront of innovation, shaping the market's trajectory through continuous research and development, and strategic partnerships. The forecast period of 2025-2033 anticipates continued robust growth driven by ongoing technological advancements, increased adoption across various industries, and a growing need for faster, more efficient computing solutions. This expanding market presents significant opportunities for existing players and new entrants alike.
Next-Generation Computing Market: A Comprehensive Report (2019-2033)
This in-depth report provides a comprehensive analysis of the next-generation computing market, encompassing its structure, competitive landscape, dominant segments, and future outlook. With a study period spanning 2019-2033, a base year of 2025, and a forecast period of 2025-2033, this report offers invaluable insights for businesses and investors seeking to navigate this rapidly evolving market. The market is valued at xx Million in 2025 and is projected to reach xx Million by 2033, exhibiting a CAGR of xx%.
Next-generation Computing Market Market Structure & Competitive Dynamics
The next-generation computing market is characterized by a dynamic interplay of established tech giants and emerging players. Market concentration is moderate, with key players like IBM Corporation, IBM, Alibaba Group Holding Limited, Alibaba, Google LLC, Google, Microsoft Corporation, Microsoft, Amazon Web Services Inc, Amazon Web Services, NVIDIA Corp, NVIDIA, NEC Corporation, Oracle Corporation, Oracle, Cisco Systems, Cisco, and Intel Corporation, Intel holding significant market share. However, the emergence of specialized startups in quantum computing and edge computing is fostering innovation and increasing competition.
Regulatory frameworks, particularly concerning data privacy and security, significantly impact market dynamics. Product substitutes, such as traditional computing architectures, are gradually becoming less relevant as next-generation technologies offer superior performance and efficiency. End-user trends are shifting towards cloud-based deployments and the adoption of specialized computing solutions for specific industries. M&A activity is frequent, with deal values reaching xx Million annually, indicating consolidation and expansion within the sector. For instance, recent acquisitions have focused on strengthening capabilities in AI, quantum computing, and cloud services.
Next-generation Computing Market Industry Trends & Insights
The next-generation computing market is experiencing exponential growth driven by several factors. The increasing demand for high-performance computing (HPC) across various sectors, including scientific research, financial modeling, and AI development, is a major catalyst. Technological advancements in quantum computing, optical computing, and edge computing are further fueling market expansion. Consumer preferences are increasingly focused on faster processing speeds, enhanced security, and greater energy efficiency. The market is also witnessing a considerable shift toward cloud-based deployment models, owing to their scalability, cost-effectiveness, and accessibility. Competitive dynamics are shaped by continuous innovation, strategic partnerships, and the race to develop next-generation hardware and software solutions. The market's CAGR is projected at xx%, with market penetration steadily increasing across various industry verticals.
Dominant Markets & Segments in Next-generation Computing Market
By Component: The hardware segment currently dominates the market, driven by high demand for advanced processors, memory chips, and specialized hardware accelerators. However, the software and services segments are experiencing rapid growth, fueled by the increasing adoption of cloud-based solutions and AI-powered applications.
By Computing Type: High-performance computing (HPC) currently holds the largest market share, followed by edge computing, which is witnessing rapid adoption due to the increasing demand for real-time data processing and analysis. Quantum computing, while still in its nascent stage, is poised for substantial growth in the coming years.
By Deployment: Cloud-based deployments are gaining significant traction due to their scalability and cost-effectiveness. On-premise deployments remain prevalent in sectors requiring stringent data security and control.
By End-user: The BFSI (Banking, Financial Services, and Insurance) sector is a key adopter of next-generation computing technologies, followed by the healthcare, automotive, and IT & Telecom sectors. These industries require advanced computing capabilities for data analytics, simulation, and AI-powered applications. Strong economic policies and robust infrastructure in North America and Europe are significant drivers of market growth in these regions.
Next-generation Computing Market Product Innovations
Recent product innovations focus on developing more powerful and energy-efficient processors, advanced AI algorithms, and specialized hardware for quantum computing and edge computing. These innovations enhance processing speed, improve data security, and enable the development of new applications across various sectors. The focus is on creating solutions that are highly scalable, cost-effective, and tailored to specific industry needs. This market is characterized by a continuous cycle of innovation, with new products and technologies emerging regularly.
Report Segmentation & Scope
This report comprehensively segments the next-generation computing market by component (hardware, software, services), computing type (high-performance computing, quantum computing, optical computing, edge computing, other), deployment (cloud, on-premise), and end-user (automotive & transportation, energy & utilities, healthcare, BFSI, aerospace & defense, media & entertainment, IT & telecom, retail, manufacturing, other). Each segment's growth projections, market size, and competitive dynamics are analyzed in detail, providing a granular view of the market landscape. For example, the cloud deployment segment is projected to witness significant growth due to its scalability and cost-effectiveness, while the healthcare sector is expected to drive substantial demand for specialized computing solutions for medical imaging and drug discovery.
Key Drivers of Next-generation Computing Market Growth
Several factors are driving the growth of the next-generation computing market. Technological advancements, particularly in AI, machine learning, and quantum computing, are creating new opportunities. Economic growth and increased investment in R&D are also fueling market expansion. Favorable government policies and regulations promoting technological innovation further contribute to this growth. Specific examples include initiatives focused on developing quantum computing technologies and promoting the adoption of cloud-based solutions.
Challenges in the Next-generation Computing Market Sector
The next-generation computing market faces several challenges, including high initial investment costs for advanced technologies, complex integration processes, and the need for specialized expertise. Supply chain disruptions and potential regulatory hurdles related to data security and privacy also pose significant challenges. Furthermore, intense competition among established players and emerging startups can lead to price wars and margin pressures. These challenges, however, also present opportunities for innovation and strategic partnerships.
Leading Players in the Next-generation Computing Market Market
- IBM Corporation
- Alibaba Group Holding Limited
- Google LLC
- Microsoft Corporation
- Amazon Web Services Inc
- NVIDIA Corp
- NEC Corporation
- Oracle Corporation
- Cisco Systems
- Intel Corporation
Key Developments in Next-generation Computing Market Sector
- July 2023: Moody's and Microsoft partnered to develop next-generation data analytics solutions for financial services, leveraging Microsoft's Azure OpenAI Service and Moody's proprietary data. This collaboration significantly impacts the BFSI sector's adoption of next-generation computing.
- September 2022: General Atomics Aeronautical Systems partnered with 3rdiTech to develop next-gen integrated circuits, boosting the semiconductor sector and the overall market's growth trajectory.
Strategic Next-generation Computing Market Market Outlook
The next-generation computing market presents significant growth opportunities. Continued technological advancements, increasing digital transformation initiatives across various industries, and the growing demand for high-performance computing solutions will drive market expansion. Strategic partnerships, investments in R&D, and the development of innovative solutions are crucial for companies to capitalize on the market's vast potential. The focus on developing sustainable and energy-efficient computing technologies will also play a significant role in shaping the market's future.
Next-generation Computing Market Segmentation
-
1. Component
- 1.1. Hardware
- 1.2. Software
- 1.3. Services
-
2. Computing Type
- 2.1. High-Performance Computing
- 2.2. Quantum Computing
- 2.3. Optical Computing
- 2.4. Edge Computing
- 2.5. Other Computing Types
-
3. Deployement
- 3.1. Cloud
- 3.2. On-Premise
-
4. End-user
- 4.1. Automotive & Transportation
- 4.2. Energy & Utilities
- 4.3. Healthcare
- 4.4. BFSI
- 4.5. Aerospace & Defense
- 4.6. Media & Entertainment
- 4.7. IT & Telecom
- 4.8. Retail
- 4.9. Manufacturing
- 4.10. Other End Users
Next-generation Computing Market Segmentation By Geography
- 1. North America
- 2. Europe
- 3. Asia
- 4. Australia and New Zealand
- 5. Latin America
- 6. Middle East and Africa
Next-generation Computing Market REPORT HIGHLIGHTS
| Aspects | Details |
|---|---|
| Study Period | 2019-2033 |
| Base Year | 2024 |
| Estimated Year | 2025 |
| Forecast Period | 2025-2033 |
| Historical Period | 2019-2024 |
| Growth Rate | CAGR of 19.38% from 2019-2033 |
| Segmentation |
|
Table of Contents
- 1. Introduction
- 1.1. Research Scope
- 1.2. Market Segmentation
- 1.3. Research Methodology
- 1.4. Definitions and Assumptions
- 2. Executive Summary
- 2.1. Introduction
- 3. Market Dynamics
- 3.1. Introduction
- 3.2. Market Drivers
- 3.2.1. Growth in demand for high performance computing; Adoption of Advanced Analytics in SMEs
- 3.3. Market Restrains
- 3.3.1. Risk of Data Breach in Storing and Processing Large Data in Next-gen Computing; High operational challenges in Implementing the Solution
- 3.4. Market Trends
- 3.4.1. The Cloud Deployment of The Solutions Significantly Contributes to The Market Growth
- 4. Market Factor Analysis
- 4.1. Porters Five Forces
- 4.2. Supply/Value Chain
- 4.3. PESTEL analysis
- 4.4. Market Entropy
- 4.5. Patent/Trademark Analysis
- 5. Global Next-generation Computing Market Analysis, Insights and Forecast, 2019-2031
- 5.1. Market Analysis, Insights and Forecast - by Component
- 5.1.1. Hardware
- 5.1.2. Software
- 5.1.3. Services
- 5.2. Market Analysis, Insights and Forecast - by Computing Type
- 5.2.1. High-Performance Computing
- 5.2.2. Quantum Computing
- 5.2.3. Optical Computing
- 5.2.4. Edge Computing
- 5.2.5. Other Computing Types
- 5.3. Market Analysis, Insights and Forecast - by Deployement
- 5.3.1. Cloud
- 5.3.2. On-Premise
- 5.4. Market Analysis, Insights and Forecast - by End-user
- 5.4.1. Automotive & Transportation
- 5.4.2. Energy & Utilities
- 5.4.3. Healthcare
- 5.4.4. BFSI
- 5.4.5. Aerospace & Defense
- 5.4.6. Media & Entertainment
- 5.4.7. IT & Telecom
- 5.4.8. Retail
- 5.4.9. Manufacturing
- 5.4.10. Other End Users
- 5.5. Market Analysis, Insights and Forecast - by Region
- 5.5.1. North America
- 5.5.2. Europe
- 5.5.3. Asia
- 5.5.4. Australia and New Zealand
- 5.5.5. Latin America
- 5.5.6. Middle East and Africa
- 5.1. Market Analysis, Insights and Forecast - by Component
- 6. North America Next-generation Computing Market Analysis, Insights and Forecast, 2019-2031
- 6.1. Market Analysis, Insights and Forecast - by Component
- 6.1.1. Hardware
- 6.1.2. Software
- 6.1.3. Services
- 6.2. Market Analysis, Insights and Forecast - by Computing Type
- 6.2.1. High-Performance Computing
- 6.2.2. Quantum Computing
- 6.2.3. Optical Computing
- 6.2.4. Edge Computing
- 6.2.5. Other Computing Types
- 6.3. Market Analysis, Insights and Forecast - by Deployement
- 6.3.1. Cloud
- 6.3.2. On-Premise
- 6.4. Market Analysis, Insights and Forecast - by End-user
- 6.4.1. Automotive & Transportation
- 6.4.2. Energy & Utilities
- 6.4.3. Healthcare
- 6.4.4. BFSI
- 6.4.5. Aerospace & Defense
- 6.4.6. Media & Entertainment
- 6.4.7. IT & Telecom
- 6.4.8. Retail
- 6.4.9. Manufacturing
- 6.4.10. Other End Users
- 6.1. Market Analysis, Insights and Forecast - by Component
- 7. Europe Next-generation Computing Market Analysis, Insights and Forecast, 2019-2031
- 7.1. Market Analysis, Insights and Forecast - by Component
- 7.1.1. Hardware
- 7.1.2. Software
- 7.1.3. Services
- 7.2. Market Analysis, Insights and Forecast - by Computing Type
- 7.2.1. High-Performance Computing
- 7.2.2. Quantum Computing
- 7.2.3. Optical Computing
- 7.2.4. Edge Computing
- 7.2.5. Other Computing Types
- 7.3. Market Analysis, Insights and Forecast - by Deployement
- 7.3.1. Cloud
- 7.3.2. On-Premise
- 7.4. Market Analysis, Insights and Forecast - by End-user
- 7.4.1. Automotive & Transportation
- 7.4.2. Energy & Utilities
- 7.4.3. Healthcare
- 7.4.4. BFSI
- 7.4.5. Aerospace & Defense
- 7.4.6. Media & Entertainment
- 7.4.7. IT & Telecom
- 7.4.8. Retail
- 7.4.9. Manufacturing
- 7.4.10. Other End Users
- 7.1. Market Analysis, Insights and Forecast - by Component
- 8. Asia Next-generation Computing Market Analysis, Insights and Forecast, 2019-2031
- 8.1. Market Analysis, Insights and Forecast - by Component
- 8.1.1. Hardware
- 8.1.2. Software
- 8.1.3. Services
- 8.2. Market Analysis, Insights and Forecast - by Computing Type
- 8.2.1. High-Performance Computing
- 8.2.2. Quantum Computing
- 8.2.3. Optical Computing
- 8.2.4. Edge Computing
- 8.2.5. Other Computing Types
- 8.3. Market Analysis, Insights and Forecast - by Deployement
- 8.3.1. Cloud
- 8.3.2. On-Premise
- 8.4. Market Analysis, Insights and Forecast - by End-user
- 8.4.1. Automotive & Transportation
- 8.4.2. Energy & Utilities
- 8.4.3. Healthcare
- 8.4.4. BFSI
- 8.4.5. Aerospace & Defense
- 8.4.6. Media & Entertainment
- 8.4.7. IT & Telecom
- 8.4.8. Retail
- 8.4.9. Manufacturing
- 8.4.10. Other End Users
- 8.1. Market Analysis, Insights and Forecast - by Component
- 9. Australia and New Zealand Next-generation Computing Market Analysis, Insights and Forecast, 2019-2031
- 9.1. Market Analysis, Insights and Forecast - by Component
- 9.1.1. Hardware
- 9.1.2. Software
- 9.1.3. Services
- 9.2. Market Analysis, Insights and Forecast - by Computing Type
- 9.2.1. High-Performance Computing
- 9.2.2. Quantum Computing
- 9.2.3. Optical Computing
- 9.2.4. Edge Computing
- 9.2.5. Other Computing Types
- 9.3. Market Analysis, Insights and Forecast - by Deployement
- 9.3.1. Cloud
- 9.3.2. On-Premise
- 9.4. Market Analysis, Insights and Forecast - by End-user
- 9.4.1. Automotive & Transportation
- 9.4.2. Energy & Utilities
- 9.4.3. Healthcare
- 9.4.4. BFSI
- 9.4.5. Aerospace & Defense
- 9.4.6. Media & Entertainment
- 9.4.7. IT & Telecom
- 9.4.8. Retail
- 9.4.9. Manufacturing
- 9.4.10. Other End Users
- 9.1. Market Analysis, Insights and Forecast - by Component
- 10. Latin America Next-generation Computing Market Analysis, Insights and Forecast, 2019-2031
- 10.1. Market Analysis, Insights and Forecast - by Component
- 10.1.1. Hardware
- 10.1.2. Software
- 10.1.3. Services
- 10.2. Market Analysis, Insights and Forecast - by Computing Type
- 10.2.1. High-Performance Computing
- 10.2.2. Quantum Computing
- 10.2.3. Optical Computing
- 10.2.4. Edge Computing
- 10.2.5. Other Computing Types
- 10.3. Market Analysis, Insights and Forecast - by Deployement
- 10.3.1. Cloud
- 10.3.2. On-Premise
- 10.4. Market Analysis, Insights and Forecast - by End-user
- 10.4.1. Automotive & Transportation
- 10.4.2. Energy & Utilities
- 10.4.3. Healthcare
- 10.4.4. BFSI
- 10.4.5. Aerospace & Defense
- 10.4.6. Media & Entertainment
- 10.4.7. IT & Telecom
- 10.4.8. Retail
- 10.4.9. Manufacturing
- 10.4.10. Other End Users
- 10.1. Market Analysis, Insights and Forecast - by Component
- 11. Middle East and Africa Next-generation Computing Market Analysis, Insights and Forecast, 2019-2031
- 11.1. Market Analysis, Insights and Forecast - by Component
- 11.1.1. Hardware
- 11.1.2. Software
- 11.1.3. Services
- 11.2. Market Analysis, Insights and Forecast - by Computing Type
- 11.2.1. High-Performance Computing
- 11.2.2. Quantum Computing
- 11.2.3. Optical Computing
- 11.2.4. Edge Computing
- 11.2.5. Other Computing Types
- 11.3. Market Analysis, Insights and Forecast - by Deployement
- 11.3.1. Cloud
- 11.3.2. On-Premise
- 11.4. Market Analysis, Insights and Forecast - by End-user
- 11.4.1. Automotive & Transportation
- 11.4.2. Energy & Utilities
- 11.4.3. Healthcare
- 11.4.4. BFSI
- 11.4.5. Aerospace & Defense
- 11.4.6. Media & Entertainment
- 11.4.7. IT & Telecom
- 11.4.8. Retail
- 11.4.9. Manufacturing
- 11.4.10. Other End Users
- 11.1. Market Analysis, Insights and Forecast - by Component
- 12. North America Next-generation Computing Market Analysis, Insights and Forecast, 2019-2031
- 12.1. Market Analysis, Insights and Forecast - By Country/Sub-region
- 12.1.1 United States
- 12.1.2 Canada
- 12.1.3 Mexico
- 13. Europe Next-generation Computing Market Analysis, Insights and Forecast, 2019-2031
- 13.1. Market Analysis, Insights and Forecast - By Country/Sub-region
- 13.1.1 Germany
- 13.1.2 United Kingdom
- 13.1.3 France
- 13.1.4 Spain
- 13.1.5 Italy
- 13.1.6 Spain
- 13.1.7 Belgium
- 13.1.8 Netherland
- 13.1.9 Nordics
- 13.1.10 Rest of Europe
- 14. Asia Pacific Next-generation Computing Market Analysis, Insights and Forecast, 2019-2031
- 14.1. Market Analysis, Insights and Forecast - By Country/Sub-region
- 14.1.1 China
- 14.1.2 Japan
- 14.1.3 India
- 14.1.4 South Korea
- 14.1.5 Southeast Asia
- 14.1.6 Australia
- 14.1.7 Indonesia
- 14.1.8 Phillipes
- 14.1.9 Singapore
- 14.1.10 Thailandc
- 14.1.11 Rest of Asia Pacific
- 15. South America Next-generation Computing Market Analysis, Insights and Forecast, 2019-2031
- 15.1. Market Analysis, Insights and Forecast - By Country/Sub-region
- 15.1.1 Brazil
- 15.1.2 Argentina
- 15.1.3 Peru
- 15.1.4 Chile
- 15.1.5 Colombia
- 15.1.6 Ecuador
- 15.1.7 Venezuela
- 15.1.8 Rest of South America
- 16. North America Next-generation Computing Market Analysis, Insights and Forecast, 2019-2031
- 16.1. Market Analysis, Insights and Forecast - By Country/Sub-region
- 16.1.1 United States
- 16.1.2 Canada
- 16.1.3 Mexico
- 17. MEA Next-generation Computing Market Analysis, Insights and Forecast, 2019-2031
- 17.1. Market Analysis, Insights and Forecast - By Country/Sub-region
- 17.1.1 United Arab Emirates
- 17.1.2 Saudi Arabia
- 17.1.3 South Africa
- 17.1.4 Rest of Middle East and Africa
- 18. Competitive Analysis
- 18.1. Global Market Share Analysis 2024
- 18.2. Company Profiles
- 18.2.1 IBM Corporation
- 18.2.1.1. Overview
- 18.2.1.2. Products
- 18.2.1.3. SWOT Analysis
- 18.2.1.4. Recent Developments
- 18.2.1.5. Financials (Based on Availability)
- 18.2.2 Alibaba Group Holding Limited
- 18.2.2.1. Overview
- 18.2.2.2. Products
- 18.2.2.3. SWOT Analysis
- 18.2.2.4. Recent Developments
- 18.2.2.5. Financials (Based on Availability)
- 18.2.3 Google LLC
- 18.2.3.1. Overview
- 18.2.3.2. Products
- 18.2.3.3. SWOT Analysis
- 18.2.3.4. Recent Developments
- 18.2.3.5. Financials (Based on Availability)
- 18.2.4 Microsoft Corporation
- 18.2.4.1. Overview
- 18.2.4.2. Products
- 18.2.4.3. SWOT Analysis
- 18.2.4.4. Recent Developments
- 18.2.4.5. Financials (Based on Availability)
- 18.2.5 Amazon Web Services Inc
- 18.2.5.1. Overview
- 18.2.5.2. Products
- 18.2.5.3. SWOT Analysis
- 18.2.5.4. Recent Developments
- 18.2.5.5. Financials (Based on Availability)
- 18.2.6 NVIDIA Corp
- 18.2.6.1. Overview
- 18.2.6.2. Products
- 18.2.6.3. SWOT Analysis
- 18.2.6.4. Recent Developments
- 18.2.6.5. Financials (Based on Availability)
- 18.2.7 NEC Corporation
- 18.2.7.1. Overview
- 18.2.7.2. Products
- 18.2.7.3. SWOT Analysis
- 18.2.7.4. Recent Developments
- 18.2.7.5. Financials (Based on Availability)
- 18.2.8 Oracle Corporation
- 18.2.8.1. Overview
- 18.2.8.2. Products
- 18.2.8.3. SWOT Analysis
- 18.2.8.4. Recent Developments
- 18.2.8.5. Financials (Based on Availability)
- 18.2.9 Cisco Systems
- 18.2.9.1. Overview
- 18.2.9.2. Products
- 18.2.9.3. SWOT Analysis
- 18.2.9.4. Recent Developments
- 18.2.9.5. Financials (Based on Availability)
- 18.2.10 Intel Corporation
- 18.2.10.1. Overview
- 18.2.10.2. Products
- 18.2.10.3. SWOT Analysis
- 18.2.10.4. Recent Developments
- 18.2.10.5. Financials (Based on Availability)
- 18.2.1 IBM Corporation
List of Figures
- Figure 1: Global Next-generation Computing Market Revenue Breakdown (Million, %) by Region 2024 & 2032
- Figure 2: Global Next-generation Computing Market Volume Breakdown (K Unit, %) by Region 2024 & 2032
- Figure 3: North America Next-generation Computing Market Revenue (Million), by Country 2024 & 2032
- Figure 4: North America Next-generation Computing Market Volume (K Unit), by Country 2024 & 2032
- Figure 5: North America Next-generation Computing Market Revenue Share (%), by Country 2024 & 2032
- Figure 6: North America Next-generation Computing Market Volume Share (%), by Country 2024 & 2032
- Figure 7: Europe Next-generation Computing Market Revenue (Million), by Country 2024 & 2032
- Figure 8: Europe Next-generation Computing Market Volume (K Unit), by Country 2024 & 2032
- Figure 9: Europe Next-generation Computing Market Revenue Share (%), by Country 2024 & 2032
- Figure 10: Europe Next-generation Computing Market Volume Share (%), by Country 2024 & 2032
- Figure 11: Asia Pacific Next-generation Computing Market Revenue (Million), by Country 2024 & 2032
- Figure 12: Asia Pacific Next-generation Computing Market Volume (K Unit), by Country 2024 & 2032
- Figure 13: Asia Pacific Next-generation Computing Market Revenue Share (%), by Country 2024 & 2032
- Figure 14: Asia Pacific Next-generation Computing Market Volume Share (%), by Country 2024 & 2032
- Figure 15: South America Next-generation Computing Market Revenue (Million), by Country 2024 & 2032
- Figure 16: South America Next-generation Computing Market Volume (K Unit), by Country 2024 & 2032
- Figure 17: South America Next-generation Computing Market Revenue Share (%), by Country 2024 & 2032
- Figure 18: South America Next-generation Computing Market Volume Share (%), by Country 2024 & 2032
- Figure 19: North America Next-generation Computing Market Revenue (Million), by Country 2024 & 2032
- Figure 20: North America Next-generation Computing Market Volume (K Unit), by Country 2024 & 2032
- Figure 21: North America Next-generation Computing Market Revenue Share (%), by Country 2024 & 2032
- Figure 22: North America Next-generation Computing Market Volume Share (%), by Country 2024 & 2032
- Figure 23: MEA Next-generation Computing Market Revenue (Million), by Country 2024 & 2032
- Figure 24: MEA Next-generation Computing Market Volume (K Unit), by Country 2024 & 2032
- Figure 25: MEA Next-generation Computing Market Revenue Share (%), by Country 2024 & 2032
- Figure 26: MEA Next-generation Computing Market Volume Share (%), by Country 2024 & 2032
- Figure 27: North America Next-generation Computing Market Revenue (Million), by Component 2024 & 2032
- Figure 28: North America Next-generation Computing Market Volume (K Unit), by Component 2024 & 2032
- Figure 29: North America Next-generation Computing Market Revenue Share (%), by Component 2024 & 2032
- Figure 30: North America Next-generation Computing Market Volume Share (%), by Component 2024 & 2032
- Figure 31: North America Next-generation Computing Market Revenue (Million), by Computing Type 2024 & 2032
- Figure 32: North America Next-generation Computing Market Volume (K Unit), by Computing Type 2024 & 2032
- Figure 33: North America Next-generation Computing Market Revenue Share (%), by Computing Type 2024 & 2032
- Figure 34: North America Next-generation Computing Market Volume Share (%), by Computing Type 2024 & 2032
- Figure 35: North America Next-generation Computing Market Revenue (Million), by Deployement 2024 & 2032
- Figure 36: North America Next-generation Computing Market Volume (K Unit), by Deployement 2024 & 2032
- Figure 37: North America Next-generation Computing Market Revenue Share (%), by Deployement 2024 & 2032
- Figure 38: North America Next-generation Computing Market Volume Share (%), by Deployement 2024 & 2032
- Figure 39: North America Next-generation Computing Market Revenue (Million), by End-user 2024 & 2032
- Figure 40: North America Next-generation Computing Market Volume (K Unit), by End-user 2024 & 2032
- Figure 41: North America Next-generation Computing Market Revenue Share (%), by End-user 2024 & 2032
- Figure 42: North America Next-generation Computing Market Volume Share (%), by End-user 2024 & 2032
- Figure 43: North America Next-generation Computing Market Revenue (Million), by Country 2024 & 2032
- Figure 44: North America Next-generation Computing Market Volume (K Unit), by Country 2024 & 2032
- Figure 45: North America Next-generation Computing Market Revenue Share (%), by Country 2024 & 2032
- Figure 46: North America Next-generation Computing Market Volume Share (%), by Country 2024 & 2032
- Figure 47: Europe Next-generation Computing Market Revenue (Million), by Component 2024 & 2032
- Figure 48: Europe Next-generation Computing Market Volume (K Unit), by Component 2024 & 2032
- Figure 49: Europe Next-generation Computing Market Revenue Share (%), by Component 2024 & 2032
- Figure 50: Europe Next-generation Computing Market Volume Share (%), by Component 2024 & 2032
- Figure 51: Europe Next-generation Computing Market Revenue (Million), by Computing Type 2024 & 2032
- Figure 52: Europe Next-generation Computing Market Volume (K Unit), by Computing Type 2024 & 2032
- Figure 53: Europe Next-generation Computing Market Revenue Share (%), by Computing Type 2024 & 2032
- Figure 54: Europe Next-generation Computing Market Volume Share (%), by Computing Type 2024 & 2032
- Figure 55: Europe Next-generation Computing Market Revenue (Million), by Deployement 2024 & 2032
- Figure 56: Europe Next-generation Computing Market Volume (K Unit), by Deployement 2024 & 2032
- Figure 57: Europe Next-generation Computing Market Revenue Share (%), by Deployement 2024 & 2032
- Figure 58: Europe Next-generation Computing Market Volume Share (%), by Deployement 2024 & 2032
- Figure 59: Europe Next-generation Computing Market Revenue (Million), by End-user 2024 & 2032
- Figure 60: Europe Next-generation Computing Market Volume (K Unit), by End-user 2024 & 2032
- Figure 61: Europe Next-generation Computing Market Revenue Share (%), by End-user 2024 & 2032
- Figure 62: Europe Next-generation Computing Market Volume Share (%), by End-user 2024 & 2032
- Figure 63: Europe Next-generation Computing Market Revenue (Million), by Country 2024 & 2032
- Figure 64: Europe Next-generation Computing Market Volume (K Unit), by Country 2024 & 2032
- Figure 65: Europe Next-generation Computing Market Revenue Share (%), by Country 2024 & 2032
- Figure 66: Europe Next-generation Computing Market Volume Share (%), by Country 2024 & 2032
- Figure 67: Asia Next-generation Computing Market Revenue (Million), by Component 2024 & 2032
- Figure 68: Asia Next-generation Computing Market Volume (K Unit), by Component 2024 & 2032
- Figure 69: Asia Next-generation Computing Market Revenue Share (%), by Component 2024 & 2032
- Figure 70: Asia Next-generation Computing Market Volume Share (%), by Component 2024 & 2032
- Figure 71: Asia Next-generation Computing Market Revenue (Million), by Computing Type 2024 & 2032
- Figure 72: Asia Next-generation Computing Market Volume (K Unit), by Computing Type 2024 & 2032
- Figure 73: Asia Next-generation Computing Market Revenue Share (%), by Computing Type 2024 & 2032
- Figure 74: Asia Next-generation Computing Market Volume Share (%), by Computing Type 2024 & 2032
- Figure 75: Asia Next-generation Computing Market Revenue (Million), by Deployement 2024 & 2032
- Figure 76: Asia Next-generation Computing Market Volume (K Unit), by Deployement 2024 & 2032
- Figure 77: Asia Next-generation Computing Market Revenue Share (%), by Deployement 2024 & 2032
- Figure 78: Asia Next-generation Computing Market Volume Share (%), by Deployement 2024 & 2032
- Figure 79: Asia Next-generation Computing Market Revenue (Million), by End-user 2024 & 2032
- Figure 80: Asia Next-generation Computing Market Volume (K Unit), by End-user 2024 & 2032
- Figure 81: Asia Next-generation Computing Market Revenue Share (%), by End-user 2024 & 2032
- Figure 82: Asia Next-generation Computing Market Volume Share (%), by End-user 2024 & 2032
- Figure 83: Asia Next-generation Computing Market Revenue (Million), by Country 2024 & 2032
- Figure 84: Asia Next-generation Computing Market Volume (K Unit), by Country 2024 & 2032
- Figure 85: Asia Next-generation Computing Market Revenue Share (%), by Country 2024 & 2032
- Figure 86: Asia Next-generation Computing Market Volume Share (%), by Country 2024 & 2032
- Figure 87: Australia and New Zealand Next-generation Computing Market Revenue (Million), by Component 2024 & 2032
- Figure 88: Australia and New Zealand Next-generation Computing Market Volume (K Unit), by Component 2024 & 2032
- Figure 89: Australia and New Zealand Next-generation Computing Market Revenue Share (%), by Component 2024 & 2032
- Figure 90: Australia and New Zealand Next-generation Computing Market Volume Share (%), by Component 2024 & 2032
- Figure 91: Australia and New Zealand Next-generation Computing Market Revenue (Million), by Computing Type 2024 & 2032
- Figure 92: Australia and New Zealand Next-generation Computing Market Volume (K Unit), by Computing Type 2024 & 2032
- Figure 93: Australia and New Zealand Next-generation Computing Market Revenue Share (%), by Computing Type 2024 & 2032
- Figure 94: Australia and New Zealand Next-generation Computing Market Volume Share (%), by Computing Type 2024 & 2032
- Figure 95: Australia and New Zealand Next-generation Computing Market Revenue (Million), by Deployement 2024 & 2032
- Figure 96: Australia and New Zealand Next-generation Computing Market Volume (K Unit), by Deployement 2024 & 2032
- Figure 97: Australia and New Zealand Next-generation Computing Market Revenue Share (%), by Deployement 2024 & 2032
- Figure 98: Australia and New Zealand Next-generation Computing Market Volume Share (%), by Deployement 2024 & 2032
- Figure 99: Australia and New Zealand Next-generation Computing Market Revenue (Million), by End-user 2024 & 2032
- Figure 100: Australia and New Zealand Next-generation Computing Market Volume (K Unit), by End-user 2024 & 2032
- Figure 101: Australia and New Zealand Next-generation Computing Market Revenue Share (%), by End-user 2024 & 2032
- Figure 102: Australia and New Zealand Next-generation Computing Market Volume Share (%), by End-user 2024 & 2032
- Figure 103: Australia and New Zealand Next-generation Computing Market Revenue (Million), by Country 2024 & 2032
- Figure 104: Australia and New Zealand Next-generation Computing Market Volume (K Unit), by Country 2024 & 2032
- Figure 105: Australia and New Zealand Next-generation Computing Market Revenue Share (%), by Country 2024 & 2032
- Figure 106: Australia and New Zealand Next-generation Computing Market Volume Share (%), by Country 2024 & 2032
- Figure 107: Latin America Next-generation Computing Market Revenue (Million), by Component 2024 & 2032
- Figure 108: Latin America Next-generation Computing Market Volume (K Unit), by Component 2024 & 2032
- Figure 109: Latin America Next-generation Computing Market Revenue Share (%), by Component 2024 & 2032
- Figure 110: Latin America Next-generation Computing Market Volume Share (%), by Component 2024 & 2032
- Figure 111: Latin America Next-generation Computing Market Revenue (Million), by Computing Type 2024 & 2032
- Figure 112: Latin America Next-generation Computing Market Volume (K Unit), by Computing Type 2024 & 2032
- Figure 113: Latin America Next-generation Computing Market Revenue Share (%), by Computing Type 2024 & 2032
- Figure 114: Latin America Next-generation Computing Market Volume Share (%), by Computing Type 2024 & 2032
- Figure 115: Latin America Next-generation Computing Market Revenue (Million), by Deployement 2024 & 2032
- Figure 116: Latin America Next-generation Computing Market Volume (K Unit), by Deployement 2024 & 2032
- Figure 117: Latin America Next-generation Computing Market Revenue Share (%), by Deployement 2024 & 2032
- Figure 118: Latin America Next-generation Computing Market Volume Share (%), by Deployement 2024 & 2032
- Figure 119: Latin America Next-generation Computing Market Revenue (Million), by End-user 2024 & 2032
- Figure 120: Latin America Next-generation Computing Market Volume (K Unit), by End-user 2024 & 2032
- Figure 121: Latin America Next-generation Computing Market Revenue Share (%), by End-user 2024 & 2032
- Figure 122: Latin America Next-generation Computing Market Volume Share (%), by End-user 2024 & 2032
- Figure 123: Latin America Next-generation Computing Market Revenue (Million), by Country 2024 & 2032
- Figure 124: Latin America Next-generation Computing Market Volume (K Unit), by Country 2024 & 2032
- Figure 125: Latin America Next-generation Computing Market Revenue Share (%), by Country 2024 & 2032
- Figure 126: Latin America Next-generation Computing Market Volume Share (%), by Country 2024 & 2032
- Figure 127: Middle East and Africa Next-generation Computing Market Revenue (Million), by Component 2024 & 2032
- Figure 128: Middle East and Africa Next-generation Computing Market Volume (K Unit), by Component 2024 & 2032
- Figure 129: Middle East and Africa Next-generation Computing Market Revenue Share (%), by Component 2024 & 2032
- Figure 130: Middle East and Africa Next-generation Computing Market Volume Share (%), by Component 2024 & 2032
- Figure 131: Middle East and Africa Next-generation Computing Market Revenue (Million), by Computing Type 2024 & 2032
- Figure 132: Middle East and Africa Next-generation Computing Market Volume (K Unit), by Computing Type 2024 & 2032
- Figure 133: Middle East and Africa Next-generation Computing Market Revenue Share (%), by Computing Type 2024 & 2032
- Figure 134: Middle East and Africa Next-generation Computing Market Volume Share (%), by Computing Type 2024 & 2032
- Figure 135: Middle East and Africa Next-generation Computing Market Revenue (Million), by Deployement 2024 & 2032
- Figure 136: Middle East and Africa Next-generation Computing Market Volume (K Unit), by Deployement 2024 & 2032
- Figure 137: Middle East and Africa Next-generation Computing Market Revenue Share (%), by Deployement 2024 & 2032
- Figure 138: Middle East and Africa Next-generation Computing Market Volume Share (%), by Deployement 2024 & 2032
- Figure 139: Middle East and Africa Next-generation Computing Market Revenue (Million), by End-user 2024 & 2032
- Figure 140: Middle East and Africa Next-generation Computing Market Volume (K Unit), by End-user 2024 & 2032
- Figure 141: Middle East and Africa Next-generation Computing Market Revenue Share (%), by End-user 2024 & 2032
- Figure 142: Middle East and Africa Next-generation Computing Market Volume Share (%), by End-user 2024 & 2032
- Figure 143: Middle East and Africa Next-generation Computing Market Revenue (Million), by Country 2024 & 2032
- Figure 144: Middle East and Africa Next-generation Computing Market Volume (K Unit), by Country 2024 & 2032
- Figure 145: Middle East and Africa Next-generation Computing Market Revenue Share (%), by Country 2024 & 2032
- Figure 146: Middle East and Africa Next-generation Computing Market Volume Share (%), by Country 2024 & 2032
List of Tables
- Table 1: Global Next-generation Computing Market Revenue Million Forecast, by Region 2019 & 2032
- Table 2: Global Next-generation Computing Market Volume K Unit Forecast, by Region 2019 & 2032
- Table 3: Global Next-generation Computing Market Revenue Million Forecast, by Component 2019 & 2032
- Table 4: Global Next-generation Computing Market Volume K Unit Forecast, by Component 2019 & 2032
- Table 5: Global Next-generation Computing Market Revenue Million Forecast, by Computing Type 2019 & 2032
- Table 6: Global Next-generation Computing Market Volume K Unit Forecast, by Computing Type 2019 & 2032
- Table 7: Global Next-generation Computing Market Revenue Million Forecast, by Deployement 2019 & 2032
- Table 8: Global Next-generation Computing Market Volume K Unit Forecast, by Deployement 2019 & 2032
- Table 9: Global Next-generation Computing Market Revenue Million Forecast, by End-user 2019 & 2032
- Table 10: Global Next-generation Computing Market Volume K Unit Forecast, by End-user 2019 & 2032
- Table 11: Global Next-generation Computing Market Revenue Million Forecast, by Region 2019 & 2032
- Table 12: Global Next-generation Computing Market Volume K Unit Forecast, by Region 2019 & 2032
- Table 13: Global Next-generation Computing Market Revenue Million Forecast, by Country 2019 & 2032
- Table 14: Global Next-generation Computing Market Volume K Unit Forecast, by Country 2019 & 2032
- Table 15: United States Next-generation Computing Market Revenue (Million) Forecast, by Application 2019 & 2032
- Table 16: United States Next-generation Computing Market Volume (K Unit) Forecast, by Application 2019 & 2032
- Table 17: Canada Next-generation Computing Market Revenue (Million) Forecast, by Application 2019 & 2032
- Table 18: Canada Next-generation Computing Market Volume (K Unit) Forecast, by Application 2019 & 2032
- Table 19: Mexico Next-generation Computing Market Revenue (Million) Forecast, by Application 2019 & 2032
- Table 20: Mexico Next-generation Computing Market Volume (K Unit) Forecast, by Application 2019 & 2032
- Table 21: Global Next-generation Computing Market Revenue Million Forecast, by Country 2019 & 2032
- Table 22: Global Next-generation Computing Market Volume K Unit Forecast, by Country 2019 & 2032
- Table 23: Germany Next-generation Computing Market Revenue (Million) Forecast, by Application 2019 & 2032
- Table 24: Germany Next-generation Computing Market Volume (K Unit) Forecast, by Application 2019 & 2032
- Table 25: United Kingdom Next-generation Computing Market Revenue (Million) Forecast, by Application 2019 & 2032
- Table 26: United Kingdom Next-generation Computing Market Volume (K Unit) Forecast, by Application 2019 & 2032
- Table 27: France Next-generation Computing Market Revenue (Million) Forecast, by Application 2019 & 2032
- Table 28: France Next-generation Computing Market Volume (K Unit) Forecast, by Application 2019 & 2032
- Table 29: Spain Next-generation Computing Market Revenue (Million) Forecast, by Application 2019 & 2032
- Table 30: Spain Next-generation Computing Market Volume (K Unit) Forecast, by Application 2019 & 2032
- Table 31: Italy Next-generation Computing Market Revenue (Million) Forecast, by Application 2019 & 2032
- Table 32: Italy Next-generation Computing Market Volume (K Unit) Forecast, by Application 2019 & 2032
- Table 33: Spain Next-generation Computing Market Revenue (Million) Forecast, by Application 2019 & 2032
- Table 34: Spain Next-generation Computing Market Volume (K Unit) Forecast, by Application 2019 & 2032
- Table 35: Belgium Next-generation Computing Market Revenue (Million) Forecast, by Application 2019 & 2032
- Table 36: Belgium Next-generation Computing Market Volume (K Unit) Forecast, by Application 2019 & 2032
- Table 37: Netherland Next-generation Computing Market Revenue (Million) Forecast, by Application 2019 & 2032
- Table 38: Netherland Next-generation Computing Market Volume (K Unit) Forecast, by Application 2019 & 2032
- Table 39: Nordics Next-generation Computing Market Revenue (Million) Forecast, by Application 2019 & 2032
- Table 40: Nordics Next-generation Computing Market Volume (K Unit) Forecast, by Application 2019 & 2032
- Table 41: Rest of Europe Next-generation Computing Market Revenue (Million) Forecast, by Application 2019 & 2032
- Table 42: Rest of Europe Next-generation Computing Market Volume (K Unit) Forecast, by Application 2019 & 2032
- Table 43: Global Next-generation Computing Market Revenue Million Forecast, by Country 2019 & 2032
- Table 44: Global Next-generation Computing Market Volume K Unit Forecast, by Country 2019 & 2032
- Table 45: China Next-generation Computing Market Revenue (Million) Forecast, by Application 2019 & 2032
- Table 46: China Next-generation Computing Market Volume (K Unit) Forecast, by Application 2019 & 2032
- Table 47: Japan Next-generation Computing Market Revenue (Million) Forecast, by Application 2019 & 2032
- Table 48: Japan Next-generation Computing Market Volume (K Unit) Forecast, by Application 2019 & 2032
- Table 49: India Next-generation Computing Market Revenue (Million) Forecast, by Application 2019 & 2032
- Table 50: India Next-generation Computing Market Volume (K Unit) Forecast, by Application 2019 & 2032
- Table 51: South Korea Next-generation Computing Market Revenue (Million) Forecast, by Application 2019 & 2032
- Table 52: South Korea Next-generation Computing Market Volume (K Unit) Forecast, by Application 2019 & 2032
- Table 53: Southeast Asia Next-generation Computing Market Revenue (Million) Forecast, by Application 2019 & 2032
- Table 54: Southeast Asia Next-generation Computing Market Volume (K Unit) Forecast, by Application 2019 & 2032
- Table 55: Australia Next-generation Computing Market Revenue (Million) Forecast, by Application 2019 & 2032
- Table 56: Australia Next-generation Computing Market Volume (K Unit) Forecast, by Application 2019 & 2032
- Table 57: Indonesia Next-generation Computing Market Revenue (Million) Forecast, by Application 2019 & 2032
- Table 58: Indonesia Next-generation Computing Market Volume (K Unit) Forecast, by Application 2019 & 2032
- Table 59: Phillipes Next-generation Computing Market Revenue (Million) Forecast, by Application 2019 & 2032
- Table 60: Phillipes Next-generation Computing Market Volume (K Unit) Forecast, by Application 2019 & 2032
- Table 61: Singapore Next-generation Computing Market Revenue (Million) Forecast, by Application 2019 & 2032
- Table 62: Singapore Next-generation Computing Market Volume (K Unit) Forecast, by Application 2019 & 2032
- Table 63: Thailandc Next-generation Computing Market Revenue (Million) Forecast, by Application 2019 & 2032
- Table 64: Thailandc Next-generation Computing Market Volume (K Unit) Forecast, by Application 2019 & 2032
- Table 65: Rest of Asia Pacific Next-generation Computing Market Revenue (Million) Forecast, by Application 2019 & 2032
- Table 66: Rest of Asia Pacific Next-generation Computing Market Volume (K Unit) Forecast, by Application 2019 & 2032
- Table 67: Global Next-generation Computing Market Revenue Million Forecast, by Country 2019 & 2032
- Table 68: Global Next-generation Computing Market Volume K Unit Forecast, by Country 2019 & 2032
- Table 69: Brazil Next-generation Computing Market Revenue (Million) Forecast, by Application 2019 & 2032
- Table 70: Brazil Next-generation Computing Market Volume (K Unit) Forecast, by Application 2019 & 2032
- Table 71: Argentina Next-generation Computing Market Revenue (Million) Forecast, by Application 2019 & 2032
- Table 72: Argentina Next-generation Computing Market Volume (K Unit) Forecast, by Application 2019 & 2032
- Table 73: Peru Next-generation Computing Market Revenue (Million) Forecast, by Application 2019 & 2032
- Table 74: Peru Next-generation Computing Market Volume (K Unit) Forecast, by Application 2019 & 2032
- Table 75: Chile Next-generation Computing Market Revenue (Million) Forecast, by Application 2019 & 2032
- Table 76: Chile Next-generation Computing Market Volume (K Unit) Forecast, by Application 2019 & 2032
- Table 77: Colombia Next-generation Computing Market Revenue (Million) Forecast, by Application 2019 & 2032
- Table 78: Colombia Next-generation Computing Market Volume (K Unit) Forecast, by Application 2019 & 2032
- Table 79: Ecuador Next-generation Computing Market Revenue (Million) Forecast, by Application 2019 & 2032
- Table 80: Ecuador Next-generation Computing Market Volume (K Unit) Forecast, by Application 2019 & 2032
- Table 81: Venezuela Next-generation Computing Market Revenue (Million) Forecast, by Application 2019 & 2032
- Table 82: Venezuela Next-generation Computing Market Volume (K Unit) Forecast, by Application 2019 & 2032
- Table 83: Rest of South America Next-generation Computing Market Revenue (Million) Forecast, by Application 2019 & 2032
- Table 84: Rest of South America Next-generation Computing Market Volume (K Unit) Forecast, by Application 2019 & 2032
- Table 85: Global Next-generation Computing Market Revenue Million Forecast, by Country 2019 & 2032
- Table 86: Global Next-generation Computing Market Volume K Unit Forecast, by Country 2019 & 2032
- Table 87: United States Next-generation Computing Market Revenue (Million) Forecast, by Application 2019 & 2032
- Table 88: United States Next-generation Computing Market Volume (K Unit) Forecast, by Application 2019 & 2032
- Table 89: Canada Next-generation Computing Market Revenue (Million) Forecast, by Application 2019 & 2032
- Table 90: Canada Next-generation Computing Market Volume (K Unit) Forecast, by Application 2019 & 2032
- Table 91: Mexico Next-generation Computing Market Revenue (Million) Forecast, by Application 2019 & 2032
- Table 92: Mexico Next-generation Computing Market Volume (K Unit) Forecast, by Application 2019 & 2032
- Table 93: Global Next-generation Computing Market Revenue Million Forecast, by Country 2019 & 2032
- Table 94: Global Next-generation Computing Market Volume K Unit Forecast, by Country 2019 & 2032
- Table 95: United Arab Emirates Next-generation Computing Market Revenue (Million) Forecast, by Application 2019 & 2032
- Table 96: United Arab Emirates Next-generation Computing Market Volume (K Unit) Forecast, by Application 2019 & 2032
- Table 97: Saudi Arabia Next-generation Computing Market Revenue (Million) Forecast, by Application 2019 & 2032
- Table 98: Saudi Arabia Next-generation Computing Market Volume (K Unit) Forecast, by Application 2019 & 2032
- Table 99: South Africa Next-generation Computing Market Revenue (Million) Forecast, by Application 2019 & 2032
- Table 100: South Africa Next-generation Computing Market Volume (K Unit) Forecast, by Application 2019 & 2032
- Table 101: Rest of Middle East and Africa Next-generation Computing Market Revenue (Million) Forecast, by Application 2019 & 2032
- Table 102: Rest of Middle East and Africa Next-generation Computing Market Volume (K Unit) Forecast, by Application 2019 & 2032
- Table 103: Global Next-generation Computing Market Revenue Million Forecast, by Component 2019 & 2032
- Table 104: Global Next-generation Computing Market Volume K Unit Forecast, by Component 2019 & 2032
- Table 105: Global Next-generation Computing Market Revenue Million Forecast, by Computing Type 2019 & 2032
- Table 106: Global Next-generation Computing Market Volume K Unit Forecast, by Computing Type 2019 & 2032
- Table 107: Global Next-generation Computing Market Revenue Million Forecast, by Deployement 2019 & 2032
- Table 108: Global Next-generation Computing Market Volume K Unit Forecast, by Deployement 2019 & 2032
- Table 109: Global Next-generation Computing Market Revenue Million Forecast, by End-user 2019 & 2032
- Table 110: Global Next-generation Computing Market Volume K Unit Forecast, by End-user 2019 & 2032
- Table 111: Global Next-generation Computing Market Revenue Million Forecast, by Country 2019 & 2032
- Table 112: Global Next-generation Computing Market Volume K Unit Forecast, by Country 2019 & 2032
- Table 113: Global Next-generation Computing Market Revenue Million Forecast, by Component 2019 & 2032
- Table 114: Global Next-generation Computing Market Volume K Unit Forecast, by Component 2019 & 2032
- Table 115: Global Next-generation Computing Market Revenue Million Forecast, by Computing Type 2019 & 2032
- Table 116: Global Next-generation Computing Market Volume K Unit Forecast, by Computing Type 2019 & 2032
- Table 117: Global Next-generation Computing Market Revenue Million Forecast, by Deployement 2019 & 2032
- Table 118: Global Next-generation Computing Market Volume K Unit Forecast, by Deployement 2019 & 2032
- Table 119: Global Next-generation Computing Market Revenue Million Forecast, by End-user 2019 & 2032
- Table 120: Global Next-generation Computing Market Volume K Unit Forecast, by End-user 2019 & 2032
- Table 121: Global Next-generation Computing Market Revenue Million Forecast, by Country 2019 & 2032
- Table 122: Global Next-generation Computing Market Volume K Unit Forecast, by Country 2019 & 2032
- Table 123: Global Next-generation Computing Market Revenue Million Forecast, by Component 2019 & 2032
- Table 124: Global Next-generation Computing Market Volume K Unit Forecast, by Component 2019 & 2032
- Table 125: Global Next-generation Computing Market Revenue Million Forecast, by Computing Type 2019 & 2032
- Table 126: Global Next-generation Computing Market Volume K Unit Forecast, by Computing Type 2019 & 2032
- Table 127: Global Next-generation Computing Market Revenue Million Forecast, by Deployement 2019 & 2032
- Table 128: Global Next-generation Computing Market Volume K Unit Forecast, by Deployement 2019 & 2032
- Table 129: Global Next-generation Computing Market Revenue Million Forecast, by End-user 2019 & 2032
- Table 130: Global Next-generation Computing Market Volume K Unit Forecast, by End-user 2019 & 2032
- Table 131: Global Next-generation Computing Market Revenue Million Forecast, by Country 2019 & 2032
- Table 132: Global Next-generation Computing Market Volume K Unit Forecast, by Country 2019 & 2032
- Table 133: Global Next-generation Computing Market Revenue Million Forecast, by Component 2019 & 2032
- Table 134: Global Next-generation Computing Market Volume K Unit Forecast, by Component 2019 & 2032
- Table 135: Global Next-generation Computing Market Revenue Million Forecast, by Computing Type 2019 & 2032
- Table 136: Global Next-generation Computing Market Volume K Unit Forecast, by Computing Type 2019 & 2032
- Table 137: Global Next-generation Computing Market Revenue Million Forecast, by Deployement 2019 & 2032
- Table 138: Global Next-generation Computing Market Volume K Unit Forecast, by Deployement 2019 & 2032
- Table 139: Global Next-generation Computing Market Revenue Million Forecast, by End-user 2019 & 2032
- Table 140: Global Next-generation Computing Market Volume K Unit Forecast, by End-user 2019 & 2032
- Table 141: Global Next-generation Computing Market Revenue Million Forecast, by Country 2019 & 2032
- Table 142: Global Next-generation Computing Market Volume K Unit Forecast, by Country 2019 & 2032
- Table 143: Global Next-generation Computing Market Revenue Million Forecast, by Component 2019 & 2032
- Table 144: Global Next-generation Computing Market Volume K Unit Forecast, by Component 2019 & 2032
- Table 145: Global Next-generation Computing Market Revenue Million Forecast, by Computing Type 2019 & 2032
- Table 146: Global Next-generation Computing Market Volume K Unit Forecast, by Computing Type 2019 & 2032
- Table 147: Global Next-generation Computing Market Revenue Million Forecast, by Deployement 2019 & 2032
- Table 148: Global Next-generation Computing Market Volume K Unit Forecast, by Deployement 2019 & 2032
- Table 149: Global Next-generation Computing Market Revenue Million Forecast, by End-user 2019 & 2032
- Table 150: Global Next-generation Computing Market Volume K Unit Forecast, by End-user 2019 & 2032
- Table 151: Global Next-generation Computing Market Revenue Million Forecast, by Country 2019 & 2032
- Table 152: Global Next-generation Computing Market Volume K Unit Forecast, by Country 2019 & 2032
- Table 153: Global Next-generation Computing Market Revenue Million Forecast, by Component 2019 & 2032
- Table 154: Global Next-generation Computing Market Volume K Unit Forecast, by Component 2019 & 2032
- Table 155: Global Next-generation Computing Market Revenue Million Forecast, by Computing Type 2019 & 2032
- Table 156: Global Next-generation Computing Market Volume K Unit Forecast, by Computing Type 2019 & 2032
- Table 157: Global Next-generation Computing Market Revenue Million Forecast, by Deployement 2019 & 2032
- Table 158: Global Next-generation Computing Market Volume K Unit Forecast, by Deployement 2019 & 2032
- Table 159: Global Next-generation Computing Market Revenue Million Forecast, by End-user 2019 & 2032
- Table 160: Global Next-generation Computing Market Volume K Unit Forecast, by End-user 2019 & 2032
- Table 161: Global Next-generation Computing Market Revenue Million Forecast, by Country 2019 & 2032
- Table 162: Global Next-generation Computing Market Volume K Unit Forecast, by Country 2019 & 2032
Frequently Asked Questions
1. What is the projected Compound Annual Growth Rate (CAGR) of the Next-generation Computing Market?
The projected CAGR is approximately 19.38%.
2. Which companies are prominent players in the Next-generation Computing Market?
Key companies in the market include IBM Corporation, Alibaba Group Holding Limited, Google LLC, Microsoft Corporation, Amazon Web Services Inc, NVIDIA Corp, NEC Corporation, Oracle Corporation, Cisco Systems, Intel Corporation.
3. What are the main segments of the Next-generation Computing Market?
The market segments include Component, Computing Type, Deployement, End-user.
4. Can you provide details about the market size?
The market size is estimated to be USD 191.62 Million as of 2022.
5. What are some drivers contributing to market growth?
Growth in demand for high performance computing; Adoption of Advanced Analytics in SMEs.
6. What are the notable trends driving market growth?
The Cloud Deployment of The Solutions Significantly Contributes to The Market Growth.
7. Are there any restraints impacting market growth?
Risk of Data Breach in Storing and Processing Large Data in Next-gen Computing; High operational challenges in Implementing the Solution.
8. Can you provide examples of recent developments in the market?
July 2023: Moody's and Microsoft have partnered strategically to co-create next-generation data, analytics, research, collaboration, and risk solutions for financial services, which would be built by combining Microsoft's Azure OpenAI Service, Fabric, and Teams with Moody's proprietary data, analytics, and research and has been designed to enhance insights into corporate intelligence and risk assessment.
9. What pricing options are available for accessing the report?
Pricing options include single-user, multi-user, and enterprise licenses priced at USD 4750, USD 5250, and USD 8750 respectively.
10. Is the market size provided in terms of value or volume?
The market size is provided in terms of value, measured in Million and volume, measured in K Unit.
11. Are there any specific market keywords associated with the report?
Yes, the market keyword associated with the report is "Next-generation Computing Market," which aids in identifying and referencing the specific market segment covered.
12. How do I determine which pricing option suits my needs best?
The pricing options vary based on user requirements and access needs. Individual users may opt for single-user licenses, while businesses requiring broader access may choose multi-user or enterprise licenses for cost-effective access to the report.
13. Are there any additional resources or data provided in the Next-generation Computing Market report?
While the report offers comprehensive insights, it's advisable to review the specific contents or supplementary materials provided to ascertain if additional resources or data are available.
14. How can I stay updated on further developments or reports in the Next-generation Computing Market?
To stay informed about further developments, trends, and reports in the Next-generation Computing Market, consider subscribing to industry newsletters, following relevant companies and organizations, or regularly checking reputable industry news sources and publications.
Methodology
Step 1 - Identification of Relevant Samples Size from Population Database


Step 2 - Approaches for Defining Global Market Size (Value, Volume* & Price*)

Note*: In applicable scenarios
Step 3 - Data Sources
Primary Research
- Web Analytics
- Survey Reports
- Research Institute
- Latest Research Reports
- Opinion Leaders
Secondary Research
- Annual Reports
- White Paper
- Latest Press Release
- Industry Association
- Paid Database
- Investor Presentations

Step 4 - Data Triangulation
Involves using different sources of information in order to increase the validity of a study
These sources are likely to be stakeholders in a program - participants, other researchers, program staff, other community members, and so on.
Then we put all data in single framework & apply various statistical tools to find out the dynamic on the market.
During the analysis stage, feedback from the stakeholder groups would be compared to determine areas of agreement as well as areas of divergence


