
Key Insights
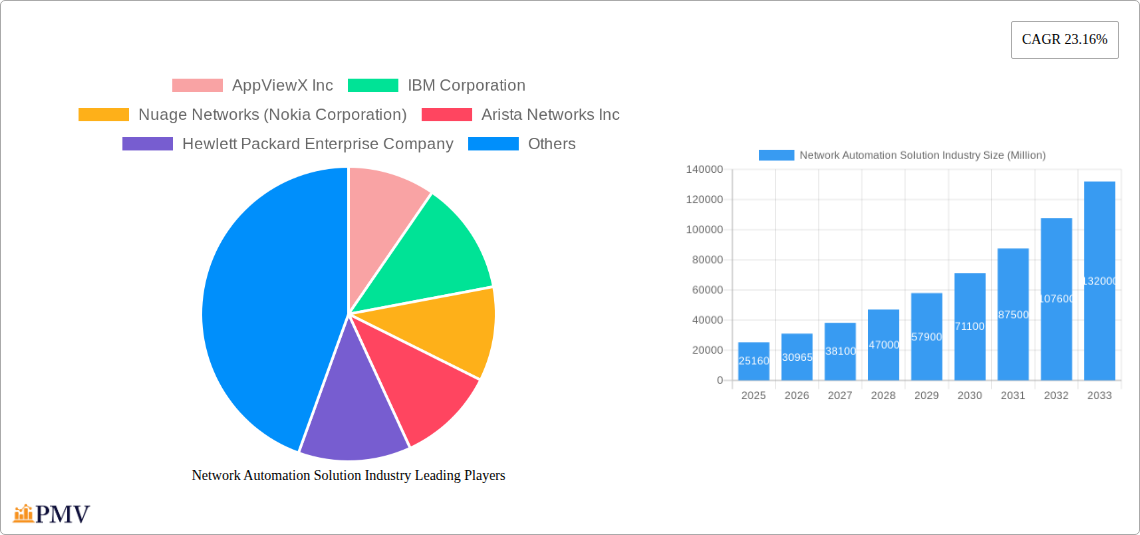
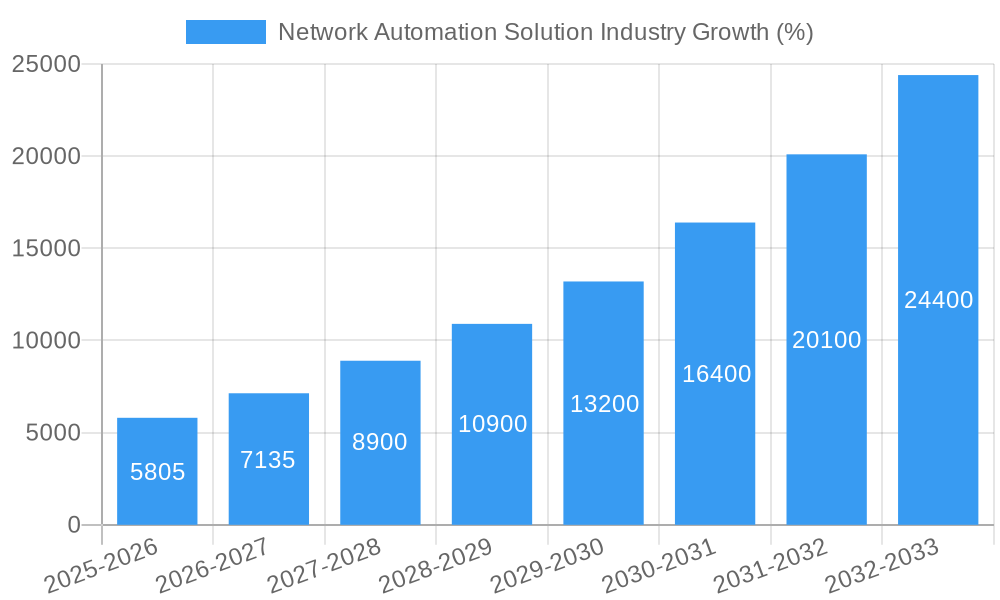
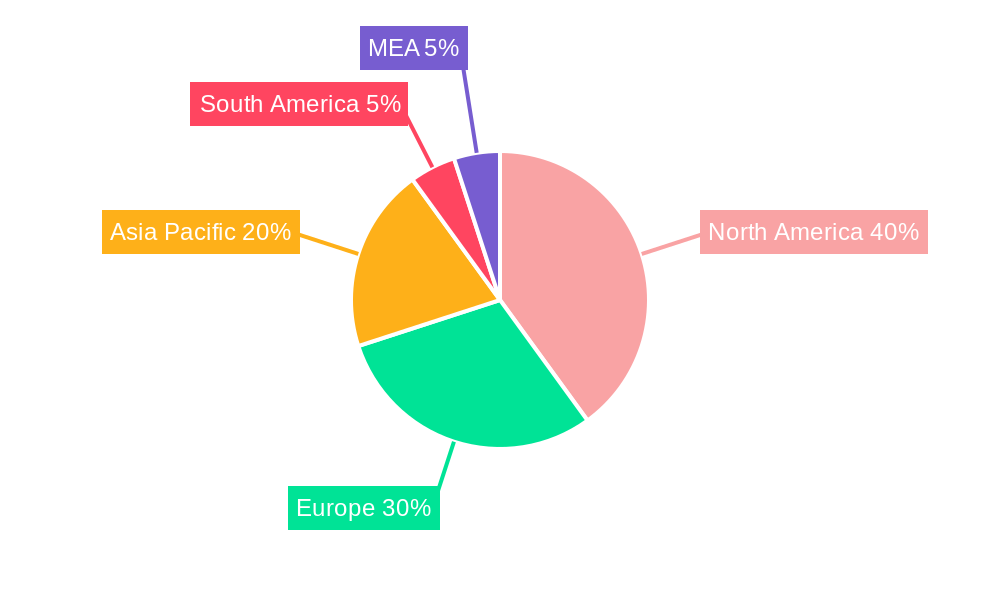
The Network Automation Solutions market is experiencing robust growth, projected to reach \$25.16 billion in 2025 and exhibiting a Compound Annual Growth Rate (CAGR) of 23.16% from 2025 to 2033. This expansion is fueled by several key drivers. The increasing complexity of modern networks, driven by cloud adoption, IoT proliferation, and the rise of 5G, necessitates automated solutions for efficient management and optimization. Businesses are seeking to reduce operational costs, improve network performance, and enhance security posture through automation, creating significant demand for these solutions. Furthermore, the shift towards software-defined networking (SDN) and network function virtualization (NFV) is creating new opportunities for network automation vendors, enabling more agile and scalable network infrastructures. While the initial investment in network automation can be substantial, the long-term cost savings and improved operational efficiency outweigh the upfront expenses. This is particularly true for large enterprises and service providers managing extensive and geographically dispersed networks. The market is segmented by component (solution type, service type), deployment (cloud, on-premise, hybrid), end-user industry (IT & Telecom, Manufacturing, Energy & Utility, Banking & Financial Services, Education), and network type (physical, virtual, hybrid). North America currently holds a significant market share, but regions like Asia-Pacific are witnessing rapid growth due to increasing digital transformation initiatives and infrastructure development.
Competitive dynamics are intense, with established players like Cisco, IBM, and Juniper Networks competing alongside emerging technology providers. The market is witnessing a trend towards integrated solutions that combine network automation with other IT operations management tools, offering holistic management capabilities. The ongoing development of artificial intelligence (AI) and machine learning (ML) technologies is further enhancing the capabilities of network automation solutions, enabling predictive analytics, proactive troubleshooting, and autonomous network management. However, challenges remain, including the integration complexities with existing legacy systems and the need for skilled professionals to implement and manage these advanced solutions. Nevertheless, the long-term outlook for the Network Automation Solutions market remains positive, driven by continued technological advancements and the growing need for efficient and scalable network management in an increasingly digital world.
Network Automation Solution Industry: A Comprehensive Market Report (2019-2033)
This in-depth report provides a comprehensive analysis of the Network Automation Solution industry, offering invaluable insights for stakeholders seeking to understand market dynamics, competitive landscapes, and future growth opportunities. The study period spans from 2019 to 2033, with 2025 serving as the base and estimated year. The report projects robust growth, reaching a market value of xx Million by 2033.
Network Automation Solution Industry Market Structure & Competitive Dynamics
The Network Automation Solution market exhibits a moderately consolidated structure, with several key players commanding significant market share. The industry is characterized by intense competition, driven by continuous innovation and a focus on delivering advanced solutions. The leading companies, including IBM Corporation, Cisco Systems Inc, Juniper Networks Inc, and Arista Networks Inc., are engaged in strategic partnerships, acquisitions, and product development to maintain their competitive edge. Market share among the top five players is estimated at 60% in 2025, while the remaining share is dispersed among numerous smaller players and niche providers.
Regulatory frameworks, particularly concerning data privacy and cybersecurity, are shaping industry practices and influencing investment decisions. The increasing adoption of cloud-based solutions and the rise of intent-based networking are further impacting the competitive landscape. M&A activity is significant, with several multi-million-dollar deals recorded in recent years. For instance, the xx Million acquisition of [Company Name] by [Acquiring Company Name] in 2023 demonstrates the consolidation trend within the sector. The total M&A deal value in 2024 is estimated at xx Million. End-user trends toward automation and digital transformation are driving industry growth, along with a growing preference for hybrid deployment models.
Network Automation Solution Industry Industry Trends & Insights
The Network Automation Solution market is experiencing substantial growth, fueled by the increasing demand for efficient and scalable network management solutions across various industries. The market's Compound Annual Growth Rate (CAGR) is projected to be xx% during the forecast period (2025-2033). This growth is primarily attributed to the rising adoption of cloud computing, the expanding deployment of 5G networks, and the increasing need for improved network security. The market penetration of network automation solutions in key sectors like IT and Telecom is already high, exceeding xx%, while other sectors like Manufacturing and Energy are witnessing faster adoption rates. Technological advancements such as artificial intelligence (AI), machine learning (ML), and Software Defined Networking (SDN) are further accelerating the market's expansion. However, challenges such as the complexity of network environments, the need for skilled professionals, and concerns regarding security and interoperability continue to restrain market growth to some extent. Consumer preferences are shifting towards solutions that offer seamless integration, enhanced scalability, and robust security features.
Dominant Markets & Segments in Network Automation Solution Industry
Leading Region: North America is currently the dominant market, driven by high technology adoption rates and a robust IT infrastructure. Europe and Asia-Pacific are also experiencing significant growth.
Dominant Segments:
- By Component: The Solution Type segment currently holds the largest market share, primarily driven by strong demand for network management and monitoring tools. The Intent-based Networking segment is anticipated to exhibit higher growth during the forecast period due to its ability to simplify network operations and improve efficiency.
- By Deployment: The Cloud deployment model is rapidly gaining traction, owing to its scalability, flexibility, and cost-effectiveness. However, the On-premise segment still holds a significant market share in certain sectors and retains importance for legacy systems. Hybrid deployment models are seeing increased adoption due to their capacity to bridge the gap between traditional infrastructure and newer cloud-based approaches.
- By End-user Industry: The IT and Telecom sector continues to be the largest consumer of Network Automation Solutions, primarily due to their need for high network reliability and operational efficiency. However, the Manufacturing, Energy and Utility, and Banking and Financial Services sectors are experiencing significant growth in adoption, further propelled by automation initiatives and enhanced cybersecurity measures.
- By Network Type: The Hybrid Network type dominates the market, reflecting the current trend towards integrated network architectures. As cloud adoption accelerates, the Virtual Network segment is predicted to demonstrate significant growth in the coming years.
Key Drivers for Dominant Segments:
- Economic Policies: Government initiatives promoting digital transformation and infrastructure development are fostering market growth in several regions.
- Infrastructure Development: Investments in 5G networks and data centers are creating significant opportunities for network automation solutions.
- Technological Advancements: Innovations in AI, ML, and SDN are continuously enhancing the capabilities of network automation solutions.
Network Automation Solution Industry Product Innovations
Recent advancements in network automation solutions focus on AI-powered analytics, enhanced security features, and seamless integration with cloud platforms. Products are increasingly incorporating machine learning algorithms to proactively identify and resolve network issues, improve operational efficiency, and optimize resource allocation. This trend aligns well with industry demands for reduced operational costs and improved network performance. The development of intent-based networking solutions simplifies network management, accelerating the deployment of increasingly complex network architectures.
Report Segmentation & Scope
This report provides a granular segmentation of the Network Automation Solution market across various parameters. The By Component segment is further divided into Solution Type (e.g., Network Management Systems, Network Monitoring Tools, Network Configuration and Provisioning Tools) and Intent-based Networking (e.g., Network Optimization, Network Security). The By Deployment segment includes Cloud, On-premise, and Hybrid deployment models. The By End-user Industry segment covers IT and Telecom, Manufacturing, Energy and Utility, Banking and Financial Services, Education, and Other End-user Industries. The By Network Type segment includes Physical, Virtual, and Hybrid networks. Each segment's growth projections, market size estimations, and competitive dynamics are comprehensively analyzed within the full report.
Key Drivers of Network Automation Solution Industry Growth
The Network Automation Solution market is propelled by several key factors. Technological advancements, particularly in AI and ML, are enabling more sophisticated and efficient network management solutions. The rising adoption of cloud computing and the expanding deployment of 5G networks are creating immense demand for scalable and secure network automation solutions. Economic factors, such as increased investments in digital infrastructure and growing IT spending, are further driving market expansion. Regulatory frameworks mandating improved network security and compliance standards are also contributing to the growth of the market.
Challenges in the Network Automation Solution Industry Sector
The industry faces several challenges, including the complexity of integrating diverse network technologies, the high cost of implementation, the need for specialized expertise, and potential security vulnerabilities associated with automation solutions. Supply chain disruptions can also impact the availability and pricing of hardware and software components. Furthermore, intense competition from established players and new entrants presents significant challenges. The estimated impact of these challenges on market growth is approximately xx% reduction in CAGR by 2033.
Leading Players in the Network Automation Solution Industry Market
- AppViewX Inc
- IBM Corporation
- Nuage Networks (Nokia Corporation)
- Arista Networks Inc
- Hewlett Packard Enterprise Company
- Cisco Systems Inc
- Broadcom Inc
- Fujitsu Limited
- Juniper Networks Inc
- BMC Software Inc
- Extreme Networks Inc
- NetBrain Technologies Inc
- Forward Networks Inc
- Solarwinds Corporation
- Open Text Corporation
- Fortra LLC
Key Developments in Network Automation Solution Industry Sector
March 2024: Arista Networks Inc. announced a new network observability software, CloudVision Universal Network Observability (CV UNOTM), enhancing network automation and visibility. This significantly improves network performance monitoring and troubleshooting capabilities, increasing the appeal of Arista’s solutions within the market.
March 2024: Nokia enhanced its WaveSuite optical network automation platform, addressing customer demands for increased bandwidth and reliability. This upgrade allows for better network optimization and increased capacity, driving competitiveness and market share gains for Nokia.
Strategic Network Automation Solution Industry Market Outlook
The Network Automation Solution market is poised for sustained growth, driven by continuous technological advancements, increasing adoption of cloud and 5G technologies, and heightened demand for secure and efficient network management across various sectors. Strategic opportunities lie in developing AI-powered solutions, enhancing security capabilities, and providing seamless integration with cloud platforms. Companies that focus on innovation, strategic partnerships, and customer-centric approaches are best positioned to capitalize on the expanding market potential. The market is expected to witness significant consolidation through mergers and acquisitions in the coming years.
Network Automation Solution Industry Segmentation
-
1. Network Type
- 1.1. Physical
- 1.2. Virtual
- 1.3. Hybrid
-
2. Component
-
2.1. Solution Type
- 2.1.1. Network Automation Tools
- 2.1.2. SD-WAN and Network Virtualization
- 2.1.3. Intent-based Networking
-
2.2. Service Type
- 2.2.1. Managed Service
- 2.2.2. Professional Service
-
2.1. Solution Type
-
3. Deployment
- 3.1. Cloud
- 3.2. On-premise
- 3.3. Hybrid
-
4. End-user Industry
- 4.1. IT and Telecom
- 4.2. Manufacturing
- 4.3. Energy and Utility
- 4.4. Banking and Financial Services
- 4.5. Education
- 4.6. Other End-user Industries
Network Automation Solution Industry Segmentation By Geography
- 1. North America
- 2. Europe
- 3. Asia
- 4. Australia and New Zealand
- 5. Latin America
- 6. Middle East and Africa
Network Automation Solution Industry REPORT HIGHLIGHTS
| Aspects | Details |
|---|---|
| Study Period | 2019-2033 |
| Base Year | 2024 |
| Estimated Year | 2025 |
| Forecast Period | 2025-2033 |
| Historical Period | 2019-2024 |
| Growth Rate | CAGR of 23.16% from 2019-2033 |
| Segmentation |
|
Table of Contents
- 1. Introduction
- 1.1. Research Scope
- 1.2. Market Segmentation
- 1.3. Research Methodology
- 1.4. Definitions and Assumptions
- 2. Executive Summary
- 2.1. Introduction
- 3. Market Dynamics
- 3.1. Introduction
- 3.2. Market Drivers
- 3.2.1. Increasing Demand for Data Center Network; Rising Trend of Connected Devices
- 3.3. Market Restrains
- 3.3.1. Lack of Skilled Professional Across Industries
- 3.4. Market Trends
- 3.4.1. IT and Telecom End-user Industry is Expected to Hold Significant Market Share
- 4. Market Factor Analysis
- 4.1. Porters Five Forces
- 4.2. Supply/Value Chain
- 4.3. PESTEL analysis
- 4.4. Market Entropy
- 4.5. Patent/Trademark Analysis
- 5. Global Network Automation Solution Industry Analysis, Insights and Forecast, 2019-2031
- 5.1. Market Analysis, Insights and Forecast - by Network Type
- 5.1.1. Physical
- 5.1.2. Virtual
- 5.1.3. Hybrid
- 5.2. Market Analysis, Insights and Forecast - by Component
- 5.2.1. Solution Type
- 5.2.1.1. Network Automation Tools
- 5.2.1.2. SD-WAN and Network Virtualization
- 5.2.1.3. Intent-based Networking
- 5.2.2. Service Type
- 5.2.2.1. Managed Service
- 5.2.2.2. Professional Service
- 5.2.1. Solution Type
- 5.3. Market Analysis, Insights and Forecast - by Deployment
- 5.3.1. Cloud
- 5.3.2. On-premise
- 5.3.3. Hybrid
- 5.4. Market Analysis, Insights and Forecast - by End-user Industry
- 5.4.1. IT and Telecom
- 5.4.2. Manufacturing
- 5.4.3. Energy and Utility
- 5.4.4. Banking and Financial Services
- 5.4.5. Education
- 5.4.6. Other End-user Industries
- 5.5. Market Analysis, Insights and Forecast - by Region
- 5.5.1. North America
- 5.5.2. Europe
- 5.5.3. Asia
- 5.5.4. Australia and New Zealand
- 5.5.5. Latin America
- 5.5.6. Middle East and Africa
- 5.1. Market Analysis, Insights and Forecast - by Network Type
- 6. North America Network Automation Solution Industry Analysis, Insights and Forecast, 2019-2031
- 6.1. Market Analysis, Insights and Forecast - by Network Type
- 6.1.1. Physical
- 6.1.2. Virtual
- 6.1.3. Hybrid
- 6.2. Market Analysis, Insights and Forecast - by Component
- 6.2.1. Solution Type
- 6.2.1.1. Network Automation Tools
- 6.2.1.2. SD-WAN and Network Virtualization
- 6.2.1.3. Intent-based Networking
- 6.2.2. Service Type
- 6.2.2.1. Managed Service
- 6.2.2.2. Professional Service
- 6.2.1. Solution Type
- 6.3. Market Analysis, Insights and Forecast - by Deployment
- 6.3.1. Cloud
- 6.3.2. On-premise
- 6.3.3. Hybrid
- 6.4. Market Analysis, Insights and Forecast - by End-user Industry
- 6.4.1. IT and Telecom
- 6.4.2. Manufacturing
- 6.4.3. Energy and Utility
- 6.4.4. Banking and Financial Services
- 6.4.5. Education
- 6.4.6. Other End-user Industries
- 6.1. Market Analysis, Insights and Forecast - by Network Type
- 7. Europe Network Automation Solution Industry Analysis, Insights and Forecast, 2019-2031
- 7.1. Market Analysis, Insights and Forecast - by Network Type
- 7.1.1. Physical
- 7.1.2. Virtual
- 7.1.3. Hybrid
- 7.2. Market Analysis, Insights and Forecast - by Component
- 7.2.1. Solution Type
- 7.2.1.1. Network Automation Tools
- 7.2.1.2. SD-WAN and Network Virtualization
- 7.2.1.3. Intent-based Networking
- 7.2.2. Service Type
- 7.2.2.1. Managed Service
- 7.2.2.2. Professional Service
- 7.2.1. Solution Type
- 7.3. Market Analysis, Insights and Forecast - by Deployment
- 7.3.1. Cloud
- 7.3.2. On-premise
- 7.3.3. Hybrid
- 7.4. Market Analysis, Insights and Forecast - by End-user Industry
- 7.4.1. IT and Telecom
- 7.4.2. Manufacturing
- 7.4.3. Energy and Utility
- 7.4.4. Banking and Financial Services
- 7.4.5. Education
- 7.4.6. Other End-user Industries
- 7.1. Market Analysis, Insights and Forecast - by Network Type
- 8. Asia Network Automation Solution Industry Analysis, Insights and Forecast, 2019-2031
- 8.1. Market Analysis, Insights and Forecast - by Network Type
- 8.1.1. Physical
- 8.1.2. Virtual
- 8.1.3. Hybrid
- 8.2. Market Analysis, Insights and Forecast - by Component
- 8.2.1. Solution Type
- 8.2.1.1. Network Automation Tools
- 8.2.1.2. SD-WAN and Network Virtualization
- 8.2.1.3. Intent-based Networking
- 8.2.2. Service Type
- 8.2.2.1. Managed Service
- 8.2.2.2. Professional Service
- 8.2.1. Solution Type
- 8.3. Market Analysis, Insights and Forecast - by Deployment
- 8.3.1. Cloud
- 8.3.2. On-premise
- 8.3.3. Hybrid
- 8.4. Market Analysis, Insights and Forecast - by End-user Industry
- 8.4.1. IT and Telecom
- 8.4.2. Manufacturing
- 8.4.3. Energy and Utility
- 8.4.4. Banking and Financial Services
- 8.4.5. Education
- 8.4.6. Other End-user Industries
- 8.1. Market Analysis, Insights and Forecast - by Network Type
- 9. Australia and New Zealand Network Automation Solution Industry Analysis, Insights and Forecast, 2019-2031
- 9.1. Market Analysis, Insights and Forecast - by Network Type
- 9.1.1. Physical
- 9.1.2. Virtual
- 9.1.3. Hybrid
- 9.2. Market Analysis, Insights and Forecast - by Component
- 9.2.1. Solution Type
- 9.2.1.1. Network Automation Tools
- 9.2.1.2. SD-WAN and Network Virtualization
- 9.2.1.3. Intent-based Networking
- 9.2.2. Service Type
- 9.2.2.1. Managed Service
- 9.2.2.2. Professional Service
- 9.2.1. Solution Type
- 9.3. Market Analysis, Insights and Forecast - by Deployment
- 9.3.1. Cloud
- 9.3.2. On-premise
- 9.3.3. Hybrid
- 9.4. Market Analysis, Insights and Forecast - by End-user Industry
- 9.4.1. IT and Telecom
- 9.4.2. Manufacturing
- 9.4.3. Energy and Utility
- 9.4.4. Banking and Financial Services
- 9.4.5. Education
- 9.4.6. Other End-user Industries
- 9.1. Market Analysis, Insights and Forecast - by Network Type
- 10. Latin America Network Automation Solution Industry Analysis, Insights and Forecast, 2019-2031
- 10.1. Market Analysis, Insights and Forecast - by Network Type
- 10.1.1. Physical
- 10.1.2. Virtual
- 10.1.3. Hybrid
- 10.2. Market Analysis, Insights and Forecast - by Component
- 10.2.1. Solution Type
- 10.2.1.1. Network Automation Tools
- 10.2.1.2. SD-WAN and Network Virtualization
- 10.2.1.3. Intent-based Networking
- 10.2.2. Service Type
- 10.2.2.1. Managed Service
- 10.2.2.2. Professional Service
- 10.2.1. Solution Type
- 10.3. Market Analysis, Insights and Forecast - by Deployment
- 10.3.1. Cloud
- 10.3.2. On-premise
- 10.3.3. Hybrid
- 10.4. Market Analysis, Insights and Forecast - by End-user Industry
- 10.4.1. IT and Telecom
- 10.4.2. Manufacturing
- 10.4.3. Energy and Utility
- 10.4.4. Banking and Financial Services
- 10.4.5. Education
- 10.4.6. Other End-user Industries
- 10.1. Market Analysis, Insights and Forecast - by Network Type
- 11. Middle East and Africa Network Automation Solution Industry Analysis, Insights and Forecast, 2019-2031
- 11.1. Market Analysis, Insights and Forecast - by Network Type
- 11.1.1. Physical
- 11.1.2. Virtual
- 11.1.3. Hybrid
- 11.2. Market Analysis, Insights and Forecast - by Component
- 11.2.1. Solution Type
- 11.2.1.1. Network Automation Tools
- 11.2.1.2. SD-WAN and Network Virtualization
- 11.2.1.3. Intent-based Networking
- 11.2.2. Service Type
- 11.2.2.1. Managed Service
- 11.2.2.2. Professional Service
- 11.2.1. Solution Type
- 11.3. Market Analysis, Insights and Forecast - by Deployment
- 11.3.1. Cloud
- 11.3.2. On-premise
- 11.3.3. Hybrid
- 11.4. Market Analysis, Insights and Forecast - by End-user Industry
- 11.4.1. IT and Telecom
- 11.4.2. Manufacturing
- 11.4.3. Energy and Utility
- 11.4.4. Banking and Financial Services
- 11.4.5. Education
- 11.4.6. Other End-user Industries
- 11.1. Market Analysis, Insights and Forecast - by Network Type
- 12. North America Network Automation Solution Industry Analysis, Insights and Forecast, 2019-2031
- 12.1. Market Analysis, Insights and Forecast - By Country/Sub-region
- 12.1.1 United States
- 12.1.2 Canada
- 12.1.3 Mexico
- 13. Europe Network Automation Solution Industry Analysis, Insights and Forecast, 2019-2031
- 13.1. Market Analysis, Insights and Forecast - By Country/Sub-region
- 13.1.1 Germany
- 13.1.2 United Kingdom
- 13.1.3 France
- 13.1.4 Spain
- 13.1.5 Italy
- 13.1.6 Spain
- 13.1.7 Belgium
- 13.1.8 Netherland
- 13.1.9 Nordics
- 13.1.10 Rest of Europe
- 14. Asia Pacific Network Automation Solution Industry Analysis, Insights and Forecast, 2019-2031
- 14.1. Market Analysis, Insights and Forecast - By Country/Sub-region
- 14.1.1 China
- 14.1.2 Japan
- 14.1.3 India
- 14.1.4 South Korea
- 14.1.5 Southeast Asia
- 14.1.6 Australia
- 14.1.7 Indonesia
- 14.1.8 Phillipes
- 14.1.9 Singapore
- 14.1.10 Thailandc
- 14.1.11 Rest of Asia Pacific
- 15. South America Network Automation Solution Industry Analysis, Insights and Forecast, 2019-2031
- 15.1. Market Analysis, Insights and Forecast - By Country/Sub-region
- 15.1.1 Brazil
- 15.1.2 Argentina
- 15.1.3 Peru
- 15.1.4 Chile
- 15.1.5 Colombia
- 15.1.6 Ecuador
- 15.1.7 Venezuela
- 15.1.8 Rest of South America
- 16. North America Network Automation Solution Industry Analysis, Insights and Forecast, 2019-2031
- 16.1. Market Analysis, Insights and Forecast - By Country/Sub-region
- 16.1.1 United States
- 16.1.2 Canada
- 16.1.3 Mexico
- 17. MEA Network Automation Solution Industry Analysis, Insights and Forecast, 2019-2031
- 17.1. Market Analysis, Insights and Forecast - By Country/Sub-region
- 17.1.1 United Arab Emirates
- 17.1.2 Saudi Arabia
- 17.1.3 South Africa
- 17.1.4 Rest of Middle East and Africa
- 18. Competitive Analysis
- 18.1. Global Market Share Analysis 2024
- 18.2. Company Profiles
- 18.2.1 AppViewX Inc
- 18.2.1.1. Overview
- 18.2.1.2. Products
- 18.2.1.3. SWOT Analysis
- 18.2.1.4. Recent Developments
- 18.2.1.5. Financials (Based on Availability)
- 18.2.2 IBM Corporation
- 18.2.2.1. Overview
- 18.2.2.2. Products
- 18.2.2.3. SWOT Analysis
- 18.2.2.4. Recent Developments
- 18.2.2.5. Financials (Based on Availability)
- 18.2.3 Nuage Networks (Nokia Corporation)
- 18.2.3.1. Overview
- 18.2.3.2. Products
- 18.2.3.3. SWOT Analysis
- 18.2.3.4. Recent Developments
- 18.2.3.5. Financials (Based on Availability)
- 18.2.4 Arista Networks Inc
- 18.2.4.1. Overview
- 18.2.4.2. Products
- 18.2.4.3. SWOT Analysis
- 18.2.4.4. Recent Developments
- 18.2.4.5. Financials (Based on Availability)
- 18.2.5 Hewlett Packard Enterprise Company
- 18.2.5.1. Overview
- 18.2.5.2. Products
- 18.2.5.3. SWOT Analysis
- 18.2.5.4. Recent Developments
- 18.2.5.5. Financials (Based on Availability)
- 18.2.6 Cisco Systems Inc
- 18.2.6.1. Overview
- 18.2.6.2. Products
- 18.2.6.3. SWOT Analysis
- 18.2.6.4. Recent Developments
- 18.2.6.5. Financials (Based on Availability)
- 18.2.7 Broadcom Inc
- 18.2.7.1. Overview
- 18.2.7.2. Products
- 18.2.7.3. SWOT Analysis
- 18.2.7.4. Recent Developments
- 18.2.7.5. Financials (Based on Availability)
- 18.2.8 Fujitsu Limited
- 18.2.8.1. Overview
- 18.2.8.2. Products
- 18.2.8.3. SWOT Analysis
- 18.2.8.4. Recent Developments
- 18.2.8.5. Financials (Based on Availability)
- 18.2.9 Juniper Networks Inc
- 18.2.9.1. Overview
- 18.2.9.2. Products
- 18.2.9.3. SWOT Analysis
- 18.2.9.4. Recent Developments
- 18.2.9.5. Financials (Based on Availability)
- 18.2.10 BMC Software Inc
- 18.2.10.1. Overview
- 18.2.10.2. Products
- 18.2.10.3. SWOT Analysis
- 18.2.10.4. Recent Developments
- 18.2.10.5. Financials (Based on Availability)
- 18.2.11 Extreme Networks Inc
- 18.2.11.1. Overview
- 18.2.11.2. Products
- 18.2.11.3. SWOT Analysis
- 18.2.11.4. Recent Developments
- 18.2.11.5. Financials (Based on Availability)
- 18.2.12 NetBrain Technologies Inc
- 18.2.12.1. Overview
- 18.2.12.2. Products
- 18.2.12.3. SWOT Analysis
- 18.2.12.4. Recent Developments
- 18.2.12.5. Financials (Based on Availability)
- 18.2.13 Forward Networks Inc
- 18.2.13.1. Overview
- 18.2.13.2. Products
- 18.2.13.3. SWOT Analysis
- 18.2.13.4. Recent Developments
- 18.2.13.5. Financials (Based on Availability)
- 18.2.14 Solarwinds Corporation
- 18.2.14.1. Overview
- 18.2.14.2. Products
- 18.2.14.3. SWOT Analysis
- 18.2.14.4. Recent Developments
- 18.2.14.5. Financials (Based on Availability)
- 18.2.15 Open Text Corporation
- 18.2.15.1. Overview
- 18.2.15.2. Products
- 18.2.15.3. SWOT Analysis
- 18.2.15.4. Recent Developments
- 18.2.15.5. Financials (Based on Availability)
- 18.2.16 Fortra LLC
- 18.2.16.1. Overview
- 18.2.16.2. Products
- 18.2.16.3. SWOT Analysis
- 18.2.16.4. Recent Developments
- 18.2.16.5. Financials (Based on Availability)
- 18.2.1 AppViewX Inc
List of Figures
- Figure 1: Global Network Automation Solution Industry Revenue Breakdown (Million, %) by Region 2024 & 2032
- Figure 2: North America Network Automation Solution Industry Revenue (Million), by Country 2024 & 2032
- Figure 3: North America Network Automation Solution Industry Revenue Share (%), by Country 2024 & 2032
- Figure 4: Europe Network Automation Solution Industry Revenue (Million), by Country 2024 & 2032
- Figure 5: Europe Network Automation Solution Industry Revenue Share (%), by Country 2024 & 2032
- Figure 6: Asia Pacific Network Automation Solution Industry Revenue (Million), by Country 2024 & 2032
- Figure 7: Asia Pacific Network Automation Solution Industry Revenue Share (%), by Country 2024 & 2032
- Figure 8: South America Network Automation Solution Industry Revenue (Million), by Country 2024 & 2032
- Figure 9: South America Network Automation Solution Industry Revenue Share (%), by Country 2024 & 2032
- Figure 10: North America Network Automation Solution Industry Revenue (Million), by Country 2024 & 2032
- Figure 11: North America Network Automation Solution Industry Revenue Share (%), by Country 2024 & 2032
- Figure 12: MEA Network Automation Solution Industry Revenue (Million), by Country 2024 & 2032
- Figure 13: MEA Network Automation Solution Industry Revenue Share (%), by Country 2024 & 2032
- Figure 14: North America Network Automation Solution Industry Revenue (Million), by Network Type 2024 & 2032
- Figure 15: North America Network Automation Solution Industry Revenue Share (%), by Network Type 2024 & 2032
- Figure 16: North America Network Automation Solution Industry Revenue (Million), by Component 2024 & 2032
- Figure 17: North America Network Automation Solution Industry Revenue Share (%), by Component 2024 & 2032
- Figure 18: North America Network Automation Solution Industry Revenue (Million), by Deployment 2024 & 2032
- Figure 19: North America Network Automation Solution Industry Revenue Share (%), by Deployment 2024 & 2032
- Figure 20: North America Network Automation Solution Industry Revenue (Million), by End-user Industry 2024 & 2032
- Figure 21: North America Network Automation Solution Industry Revenue Share (%), by End-user Industry 2024 & 2032
- Figure 22: North America Network Automation Solution Industry Revenue (Million), by Country 2024 & 2032
- Figure 23: North America Network Automation Solution Industry Revenue Share (%), by Country 2024 & 2032
- Figure 24: Europe Network Automation Solution Industry Revenue (Million), by Network Type 2024 & 2032
- Figure 25: Europe Network Automation Solution Industry Revenue Share (%), by Network Type 2024 & 2032
- Figure 26: Europe Network Automation Solution Industry Revenue (Million), by Component 2024 & 2032
- Figure 27: Europe Network Automation Solution Industry Revenue Share (%), by Component 2024 & 2032
- Figure 28: Europe Network Automation Solution Industry Revenue (Million), by Deployment 2024 & 2032
- Figure 29: Europe Network Automation Solution Industry Revenue Share (%), by Deployment 2024 & 2032
- Figure 30: Europe Network Automation Solution Industry Revenue (Million), by End-user Industry 2024 & 2032
- Figure 31: Europe Network Automation Solution Industry Revenue Share (%), by End-user Industry 2024 & 2032
- Figure 32: Europe Network Automation Solution Industry Revenue (Million), by Country 2024 & 2032
- Figure 33: Europe Network Automation Solution Industry Revenue Share (%), by Country 2024 & 2032
- Figure 34: Asia Network Automation Solution Industry Revenue (Million), by Network Type 2024 & 2032
- Figure 35: Asia Network Automation Solution Industry Revenue Share (%), by Network Type 2024 & 2032
- Figure 36: Asia Network Automation Solution Industry Revenue (Million), by Component 2024 & 2032
- Figure 37: Asia Network Automation Solution Industry Revenue Share (%), by Component 2024 & 2032
- Figure 38: Asia Network Automation Solution Industry Revenue (Million), by Deployment 2024 & 2032
- Figure 39: Asia Network Automation Solution Industry Revenue Share (%), by Deployment 2024 & 2032
- Figure 40: Asia Network Automation Solution Industry Revenue (Million), by End-user Industry 2024 & 2032
- Figure 41: Asia Network Automation Solution Industry Revenue Share (%), by End-user Industry 2024 & 2032
- Figure 42: Asia Network Automation Solution Industry Revenue (Million), by Country 2024 & 2032
- Figure 43: Asia Network Automation Solution Industry Revenue Share (%), by Country 2024 & 2032
- Figure 44: Australia and New Zealand Network Automation Solution Industry Revenue (Million), by Network Type 2024 & 2032
- Figure 45: Australia and New Zealand Network Automation Solution Industry Revenue Share (%), by Network Type 2024 & 2032
- Figure 46: Australia and New Zealand Network Automation Solution Industry Revenue (Million), by Component 2024 & 2032
- Figure 47: Australia and New Zealand Network Automation Solution Industry Revenue Share (%), by Component 2024 & 2032
- Figure 48: Australia and New Zealand Network Automation Solution Industry Revenue (Million), by Deployment 2024 & 2032
- Figure 49: Australia and New Zealand Network Automation Solution Industry Revenue Share (%), by Deployment 2024 & 2032
- Figure 50: Australia and New Zealand Network Automation Solution Industry Revenue (Million), by End-user Industry 2024 & 2032
- Figure 51: Australia and New Zealand Network Automation Solution Industry Revenue Share (%), by End-user Industry 2024 & 2032
- Figure 52: Australia and New Zealand Network Automation Solution Industry Revenue (Million), by Country 2024 & 2032
- Figure 53: Australia and New Zealand Network Automation Solution Industry Revenue Share (%), by Country 2024 & 2032
- Figure 54: Latin America Network Automation Solution Industry Revenue (Million), by Network Type 2024 & 2032
- Figure 55: Latin America Network Automation Solution Industry Revenue Share (%), by Network Type 2024 & 2032
- Figure 56: Latin America Network Automation Solution Industry Revenue (Million), by Component 2024 & 2032
- Figure 57: Latin America Network Automation Solution Industry Revenue Share (%), by Component 2024 & 2032
- Figure 58: Latin America Network Automation Solution Industry Revenue (Million), by Deployment 2024 & 2032
- Figure 59: Latin America Network Automation Solution Industry Revenue Share (%), by Deployment 2024 & 2032
- Figure 60: Latin America Network Automation Solution Industry Revenue (Million), by End-user Industry 2024 & 2032
- Figure 61: Latin America Network Automation Solution Industry Revenue Share (%), by End-user Industry 2024 & 2032
- Figure 62: Latin America Network Automation Solution Industry Revenue (Million), by Country 2024 & 2032
- Figure 63: Latin America Network Automation Solution Industry Revenue Share (%), by Country 2024 & 2032
- Figure 64: Middle East and Africa Network Automation Solution Industry Revenue (Million), by Network Type 2024 & 2032
- Figure 65: Middle East and Africa Network Automation Solution Industry Revenue Share (%), by Network Type 2024 & 2032
- Figure 66: Middle East and Africa Network Automation Solution Industry Revenue (Million), by Component 2024 & 2032
- Figure 67: Middle East and Africa Network Automation Solution Industry Revenue Share (%), by Component 2024 & 2032
- Figure 68: Middle East and Africa Network Automation Solution Industry Revenue (Million), by Deployment 2024 & 2032
- Figure 69: Middle East and Africa Network Automation Solution Industry Revenue Share (%), by Deployment 2024 & 2032
- Figure 70: Middle East and Africa Network Automation Solution Industry Revenue (Million), by End-user Industry 2024 & 2032
- Figure 71: Middle East and Africa Network Automation Solution Industry Revenue Share (%), by End-user Industry 2024 & 2032
- Figure 72: Middle East and Africa Network Automation Solution Industry Revenue (Million), by Country 2024 & 2032
- Figure 73: Middle East and Africa Network Automation Solution Industry Revenue Share (%), by Country 2024 & 2032
List of Tables
- Table 1: Global Network Automation Solution Industry Revenue Million Forecast, by Region 2019 & 2032
- Table 2: Global Network Automation Solution Industry Revenue Million Forecast, by Network Type 2019 & 2032
- Table 3: Global Network Automation Solution Industry Revenue Million Forecast, by Component 2019 & 2032
- Table 4: Global Network Automation Solution Industry Revenue Million Forecast, by Deployment 2019 & 2032
- Table 5: Global Network Automation Solution Industry Revenue Million Forecast, by End-user Industry 2019 & 2032
- Table 6: Global Network Automation Solution Industry Revenue Million Forecast, by Region 2019 & 2032
- Table 7: Global Network Automation Solution Industry Revenue Million Forecast, by Country 2019 & 2032
- Table 8: United States Network Automation Solution Industry Revenue (Million) Forecast, by Application 2019 & 2032
- Table 9: Canada Network Automation Solution Industry Revenue (Million) Forecast, by Application 2019 & 2032
- Table 10: Mexico Network Automation Solution Industry Revenue (Million) Forecast, by Application 2019 & 2032
- Table 11: Global Network Automation Solution Industry Revenue Million Forecast, by Country 2019 & 2032
- Table 12: Germany Network Automation Solution Industry Revenue (Million) Forecast, by Application 2019 & 2032
- Table 13: United Kingdom Network Automation Solution Industry Revenue (Million) Forecast, by Application 2019 & 2032
- Table 14: France Network Automation Solution Industry Revenue (Million) Forecast, by Application 2019 & 2032
- Table 15: Spain Network Automation Solution Industry Revenue (Million) Forecast, by Application 2019 & 2032
- Table 16: Italy Network Automation Solution Industry Revenue (Million) Forecast, by Application 2019 & 2032
- Table 17: Spain Network Automation Solution Industry Revenue (Million) Forecast, by Application 2019 & 2032
- Table 18: Belgium Network Automation Solution Industry Revenue (Million) Forecast, by Application 2019 & 2032
- Table 19: Netherland Network Automation Solution Industry Revenue (Million) Forecast, by Application 2019 & 2032
- Table 20: Nordics Network Automation Solution Industry Revenue (Million) Forecast, by Application 2019 & 2032
- Table 21: Rest of Europe Network Automation Solution Industry Revenue (Million) Forecast, by Application 2019 & 2032
- Table 22: Global Network Automation Solution Industry Revenue Million Forecast, by Country 2019 & 2032
- Table 23: China Network Automation Solution Industry Revenue (Million) Forecast, by Application 2019 & 2032
- Table 24: Japan Network Automation Solution Industry Revenue (Million) Forecast, by Application 2019 & 2032
- Table 25: India Network Automation Solution Industry Revenue (Million) Forecast, by Application 2019 & 2032
- Table 26: South Korea Network Automation Solution Industry Revenue (Million) Forecast, by Application 2019 & 2032
- Table 27: Southeast Asia Network Automation Solution Industry Revenue (Million) Forecast, by Application 2019 & 2032
- Table 28: Australia Network Automation Solution Industry Revenue (Million) Forecast, by Application 2019 & 2032
- Table 29: Indonesia Network Automation Solution Industry Revenue (Million) Forecast, by Application 2019 & 2032
- Table 30: Phillipes Network Automation Solution Industry Revenue (Million) Forecast, by Application 2019 & 2032
- Table 31: Singapore Network Automation Solution Industry Revenue (Million) Forecast, by Application 2019 & 2032
- Table 32: Thailandc Network Automation Solution Industry Revenue (Million) Forecast, by Application 2019 & 2032
- Table 33: Rest of Asia Pacific Network Automation Solution Industry Revenue (Million) Forecast, by Application 2019 & 2032
- Table 34: Global Network Automation Solution Industry Revenue Million Forecast, by Country 2019 & 2032
- Table 35: Brazil Network Automation Solution Industry Revenue (Million) Forecast, by Application 2019 & 2032
- Table 36: Argentina Network Automation Solution Industry Revenue (Million) Forecast, by Application 2019 & 2032
- Table 37: Peru Network Automation Solution Industry Revenue (Million) Forecast, by Application 2019 & 2032
- Table 38: Chile Network Automation Solution Industry Revenue (Million) Forecast, by Application 2019 & 2032
- Table 39: Colombia Network Automation Solution Industry Revenue (Million) Forecast, by Application 2019 & 2032
- Table 40: Ecuador Network Automation Solution Industry Revenue (Million) Forecast, by Application 2019 & 2032
- Table 41: Venezuela Network Automation Solution Industry Revenue (Million) Forecast, by Application 2019 & 2032
- Table 42: Rest of South America Network Automation Solution Industry Revenue (Million) Forecast, by Application 2019 & 2032
- Table 43: Global Network Automation Solution Industry Revenue Million Forecast, by Country 2019 & 2032
- Table 44: United States Network Automation Solution Industry Revenue (Million) Forecast, by Application 2019 & 2032
- Table 45: Canada Network Automation Solution Industry Revenue (Million) Forecast, by Application 2019 & 2032
- Table 46: Mexico Network Automation Solution Industry Revenue (Million) Forecast, by Application 2019 & 2032
- Table 47: Global Network Automation Solution Industry Revenue Million Forecast, by Country 2019 & 2032
- Table 48: United Arab Emirates Network Automation Solution Industry Revenue (Million) Forecast, by Application 2019 & 2032
- Table 49: Saudi Arabia Network Automation Solution Industry Revenue (Million) Forecast, by Application 2019 & 2032
- Table 50: South Africa Network Automation Solution Industry Revenue (Million) Forecast, by Application 2019 & 2032
- Table 51: Rest of Middle East and Africa Network Automation Solution Industry Revenue (Million) Forecast, by Application 2019 & 2032
- Table 52: Global Network Automation Solution Industry Revenue Million Forecast, by Network Type 2019 & 2032
- Table 53: Global Network Automation Solution Industry Revenue Million Forecast, by Component 2019 & 2032
- Table 54: Global Network Automation Solution Industry Revenue Million Forecast, by Deployment 2019 & 2032
- Table 55: Global Network Automation Solution Industry Revenue Million Forecast, by End-user Industry 2019 & 2032
- Table 56: Global Network Automation Solution Industry Revenue Million Forecast, by Country 2019 & 2032
- Table 57: Global Network Automation Solution Industry Revenue Million Forecast, by Network Type 2019 & 2032
- Table 58: Global Network Automation Solution Industry Revenue Million Forecast, by Component 2019 & 2032
- Table 59: Global Network Automation Solution Industry Revenue Million Forecast, by Deployment 2019 & 2032
- Table 60: Global Network Automation Solution Industry Revenue Million Forecast, by End-user Industry 2019 & 2032
- Table 61: Global Network Automation Solution Industry Revenue Million Forecast, by Country 2019 & 2032
- Table 62: Global Network Automation Solution Industry Revenue Million Forecast, by Network Type 2019 & 2032
- Table 63: Global Network Automation Solution Industry Revenue Million Forecast, by Component 2019 & 2032
- Table 64: Global Network Automation Solution Industry Revenue Million Forecast, by Deployment 2019 & 2032
- Table 65: Global Network Automation Solution Industry Revenue Million Forecast, by End-user Industry 2019 & 2032
- Table 66: Global Network Automation Solution Industry Revenue Million Forecast, by Country 2019 & 2032
- Table 67: Global Network Automation Solution Industry Revenue Million Forecast, by Network Type 2019 & 2032
- Table 68: Global Network Automation Solution Industry Revenue Million Forecast, by Component 2019 & 2032
- Table 69: Global Network Automation Solution Industry Revenue Million Forecast, by Deployment 2019 & 2032
- Table 70: Global Network Automation Solution Industry Revenue Million Forecast, by End-user Industry 2019 & 2032
- Table 71: Global Network Automation Solution Industry Revenue Million Forecast, by Country 2019 & 2032
- Table 72: Global Network Automation Solution Industry Revenue Million Forecast, by Network Type 2019 & 2032
- Table 73: Global Network Automation Solution Industry Revenue Million Forecast, by Component 2019 & 2032
- Table 74: Global Network Automation Solution Industry Revenue Million Forecast, by Deployment 2019 & 2032
- Table 75: Global Network Automation Solution Industry Revenue Million Forecast, by End-user Industry 2019 & 2032
- Table 76: Global Network Automation Solution Industry Revenue Million Forecast, by Country 2019 & 2032
- Table 77: Global Network Automation Solution Industry Revenue Million Forecast, by Network Type 2019 & 2032
- Table 78: Global Network Automation Solution Industry Revenue Million Forecast, by Component 2019 & 2032
- Table 79: Global Network Automation Solution Industry Revenue Million Forecast, by Deployment 2019 & 2032
- Table 80: Global Network Automation Solution Industry Revenue Million Forecast, by End-user Industry 2019 & 2032
- Table 81: Global Network Automation Solution Industry Revenue Million Forecast, by Country 2019 & 2032
Frequently Asked Questions
1. What is the projected Compound Annual Growth Rate (CAGR) of the Network Automation Solution Industry?
The projected CAGR is approximately 23.16%.
2. Which companies are prominent players in the Network Automation Solution Industry?
Key companies in the market include AppViewX Inc, IBM Corporation, Nuage Networks (Nokia Corporation), Arista Networks Inc, Hewlett Packard Enterprise Company, Cisco Systems Inc, Broadcom Inc, Fujitsu Limited, Juniper Networks Inc, BMC Software Inc, Extreme Networks Inc, NetBrain Technologies Inc, Forward Networks Inc, Solarwinds Corporation, Open Text Corporation, Fortra LLC.
3. What are the main segments of the Network Automation Solution Industry?
The market segments include Network Type, Component, Deployment, End-user Industry.
4. Can you provide details about the market size?
The market size is estimated to be USD 25.16 Million as of 2022.
5. What are some drivers contributing to market growth?
Increasing Demand for Data Center Network; Rising Trend of Connected Devices.
6. What are the notable trends driving market growth?
IT and Telecom End-user Industry is Expected to Hold Significant Market Share.
7. Are there any restraints impacting market growth?
Lack of Skilled Professional Across Industries.
8. Can you provide examples of recent developments in the market?
March 2024: Arista announced a new network observability software. This offering integrates data from network infrastructure performance with insights from compute and server systems to provide comprehensive insights into application and workload performance across data centers, campuses, and wide-area networks. Arista’s CloudVision Universal Network ObservabilityTM (CV UNOTM) system, available as a premium feature on Arista CloudVision, facilitates network automation, systems, and application visibility.
9. What pricing options are available for accessing the report?
Pricing options include single-user, multi-user, and enterprise licenses priced at USD 4750, USD 5250, and USD 8750 respectively.
10. Is the market size provided in terms of value or volume?
The market size is provided in terms of value, measured in Million.
11. Are there any specific market keywords associated with the report?
Yes, the market keyword associated with the report is "Network Automation Solution Industry," which aids in identifying and referencing the specific market segment covered.
12. How do I determine which pricing option suits my needs best?
The pricing options vary based on user requirements and access needs. Individual users may opt for single-user licenses, while businesses requiring broader access may choose multi-user or enterprise licenses for cost-effective access to the report.
13. Are there any additional resources or data provided in the Network Automation Solution Industry report?
While the report offers comprehensive insights, it's advisable to review the specific contents or supplementary materials provided to ascertain if additional resources or data are available.
14. How can I stay updated on further developments or reports in the Network Automation Solution Industry?
To stay informed about further developments, trends, and reports in the Network Automation Solution Industry, consider subscribing to industry newsletters, following relevant companies and organizations, or regularly checking reputable industry news sources and publications.
Methodology
Step 1 - Identification of Relevant Samples Size from Population Database


Step 2 - Approaches for Defining Global Market Size (Value, Volume* & Price*)

Note*: In applicable scenarios
Step 3 - Data Sources
Primary Research
- Web Analytics
- Survey Reports
- Research Institute
- Latest Research Reports
- Opinion Leaders
Secondary Research
- Annual Reports
- White Paper
- Latest Press Release
- Industry Association
- Paid Database
- Investor Presentations

Step 4 - Data Triangulation
Involves using different sources of information in order to increase the validity of a study
These sources are likely to be stakeholders in a program - participants, other researchers, program staff, other community members, and so on.
Then we put all data in single framework & apply various statistical tools to find out the dynamic on the market.
During the analysis stage, feedback from the stakeholder groups would be compared to determine areas of agreement as well as areas of divergence


