
Key Insights
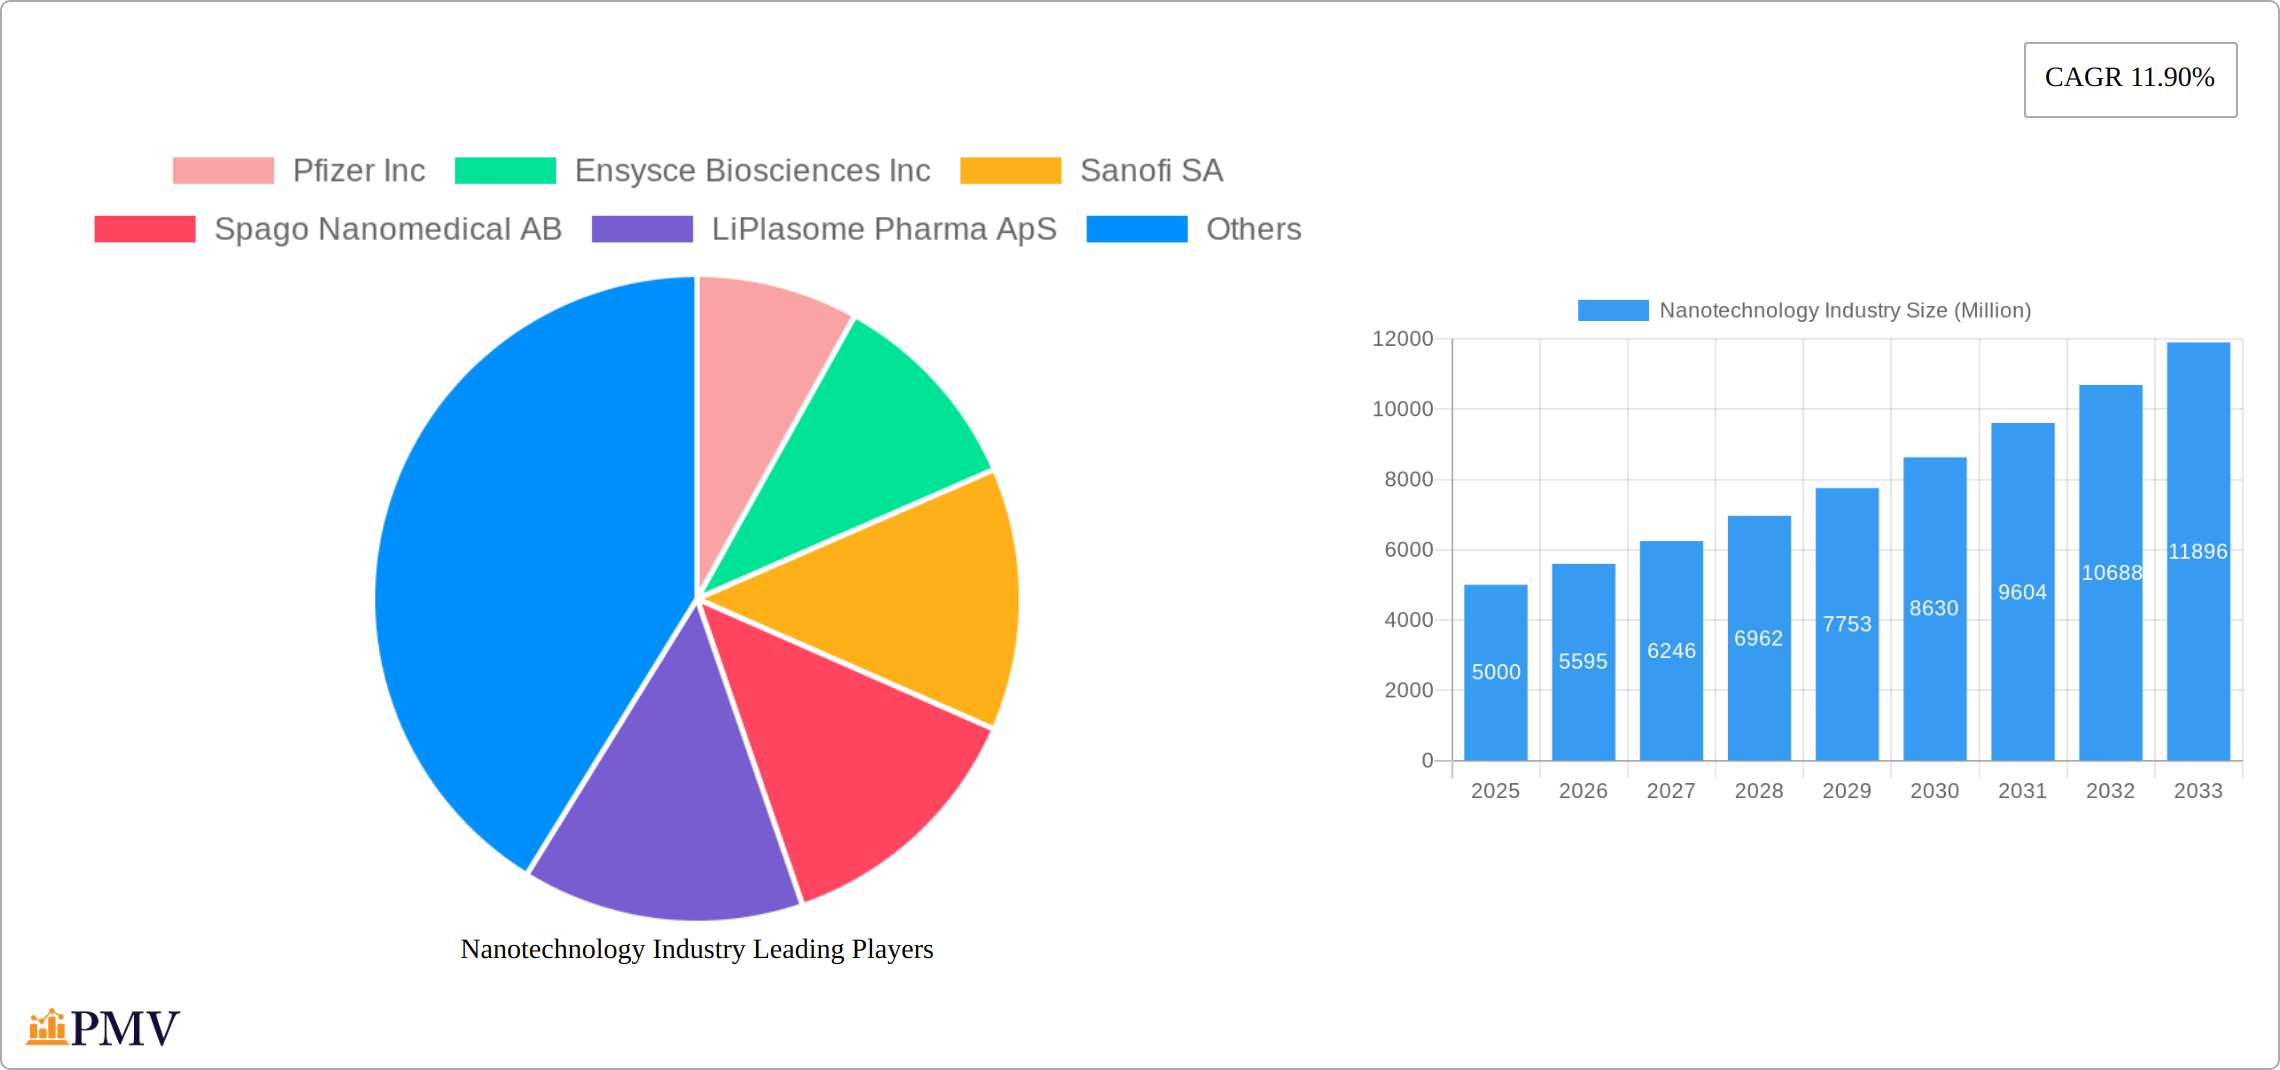
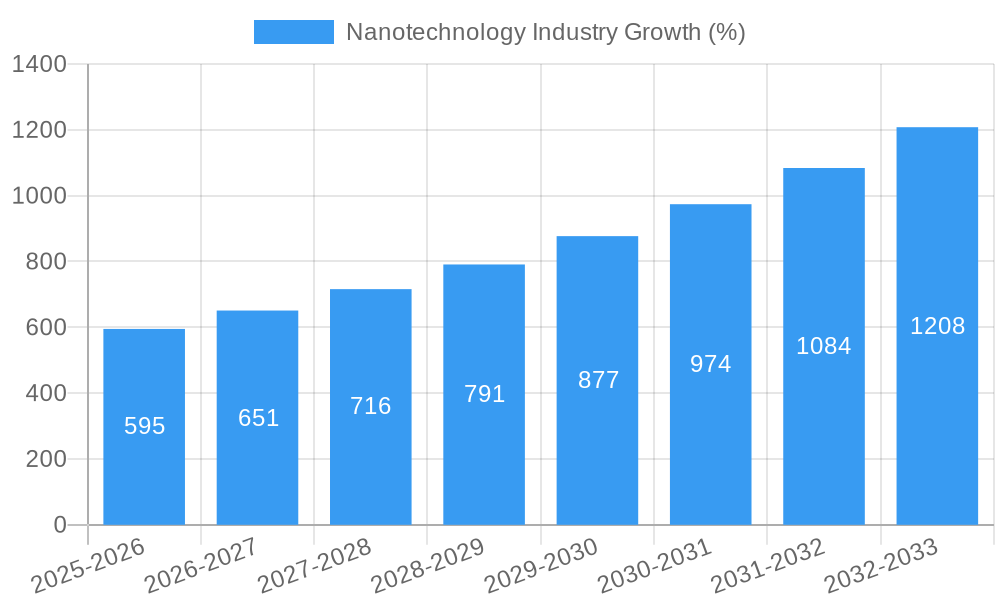
The nanotechnology market, exhibiting a robust Compound Annual Growth Rate (CAGR) of 11.90%, is poised for significant expansion, projected to reach a substantial market value in the coming years. Driven by advancements in drug delivery systems, biomaterials, and medical imaging technologies, the industry is experiencing rapid growth across diverse applications. The increasing prevalence of chronic diseases like cardiovascular diseases, cancer, and neurological disorders fuels demand for innovative nanotechnology-based therapies and diagnostic tools. Furthermore, the ongoing research and development efforts focused on tissue regeneration and improved efficacy of existing treatments are key growth drivers. While regulatory hurdles and high research and development costs present some challenges, the potential benefits of nanotechnology in improving healthcare outcomes are undeniable, attracting significant investment from both private and public sectors.
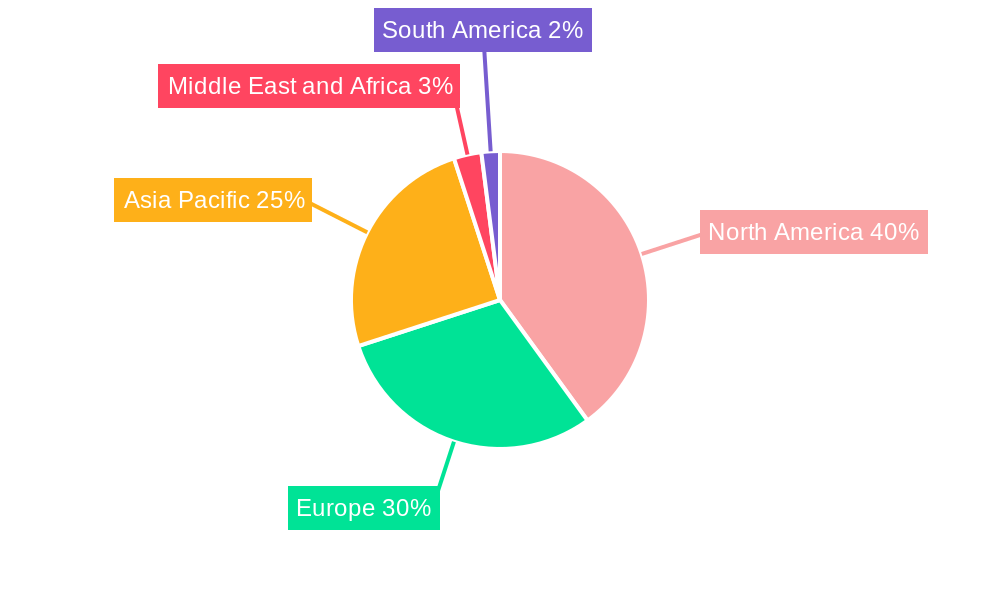
The market segmentation reveals a strong emphasis on applications within the healthcare sector, with drug delivery and diagnostic imaging leading the way. Geographically, North America currently holds a significant market share due to substantial investments in research and development, alongside the presence of major players like Pfizer and Johnson & Johnson. However, the Asia-Pacific region, particularly China and India, is projected to witness accelerated growth due to rising healthcare expenditure and increasing adoption of advanced technologies. The competitive landscape is dynamic, with a mix of established pharmaceutical giants and emerging biotechnology companies vying for market share. Strategic collaborations and mergers and acquisitions are expected to further shape the industry's evolution, accelerating innovation and market penetration. Considering the CAGR and anticipated market expansion, a conservative estimate suggests the market size could reach several billion dollars by 2033.
Nanotechnology Industry: A Comprehensive Market Report (2019-2033)
This comprehensive report provides an in-depth analysis of the nanotechnology industry, encompassing market structure, competitive dynamics, dominant segments, and future growth projections. The study period covers 2019-2033, with 2025 serving as the base and estimated year. The forecast period extends from 2025 to 2033, while the historical period encompasses 2019-2024. This report is crucial for stakeholders seeking actionable insights into this rapidly evolving sector, valued at xx Million in 2025 and projected to reach xx Million by 2033.
Nanotechnology Industry Market Structure & Competitive Dynamics
The nanotechnology industry exhibits a moderately concentrated market structure, with several key players holding significant market share. However, the landscape is characterized by intense competition, driven by continuous innovation and a growing number of smaller, specialized companies. Market share analysis reveals that Pfizer Inc., Johnson & Johnson, and Merck & Co. Inc. collectively account for approximately xx% of the global market, while smaller players focus on niche applications and therapeutic areas. The industry's innovation ecosystem is robust, with extensive R&D investments and numerous collaborations between academic institutions, research organizations, and companies. Regulatory frameworks, varying significantly across geographical regions, influence market access and product approvals. Product substitutes, while limited in certain applications, pose a growing threat as alternative technologies mature. End-user trends, such as increasing demand for personalized medicine and improved diagnostic tools, are shaping the industry's growth trajectory. Furthermore, mergers and acquisitions (M&A) activities are frequent, with deal values exceeding xx Million in recent years, reflecting the industry's consolidation and strategic expansion efforts.
- Market Concentration: Moderately concentrated, with a few dominant players and numerous smaller companies.
- Innovation Ecosystem: Robust, fueled by significant R&D investments and collaborations.
- Regulatory Frameworks: Varied across regions, impacting market access and approvals.
- Product Substitutes: Limited but increasingly competitive in some areas.
- M&A Activity: High, with deals valued at over xx Million in recent years.
Nanotechnology Industry Industry Trends & Insights
The nanotechnology industry is experiencing robust growth, driven by several key factors. Technological advancements, particularly in nanomaterials synthesis and characterization, are continuously expanding the potential applications of nanotechnology. The rising prevalence of chronic diseases, such as cardiovascular diseases and cancer, is fueling demand for innovative diagnostic and therapeutic tools. Consumer preferences are shifting towards personalized and targeted therapies, aligning well with the capabilities of nanotechnology-based solutions. The industry's competitive dynamics are characterized by intense R&D activities, strategic collaborations, and aggressive marketing efforts. The market is projected to experience a compound annual growth rate (CAGR) of xx% during the forecast period (2025-2033), driven by increasing market penetration of nanotechnology-based products across various sectors. This growth is further enhanced by government initiatives promoting nanotechnology research and development, as well as growing investments from venture capitalists and private equity firms. Market penetration is particularly strong in drug delivery systems (xx%), showcasing the significant potential across healthcare applications.
Dominant Markets & Segments in Nanotechnology Industry
The North American region currently dominates the global nanotechnology industry, driven by factors such as robust research and development infrastructure, substantial government funding, and a strong presence of major pharmaceutical and biotechnology companies. Within applications, Drug Delivery represents the largest segment, accounting for approximately xx% of the market in 2025, followed by Biomaterials and Diagnostic Imaging. In disease-specific segments, Oncological Diseases lead due to the high unmet medical needs and significant investment in cancer nanomedicine.
Key Drivers for Dominant Markets:
- North America: Strong R&D infrastructure, government funding, and presence of major players.
- Drug Delivery Applications: High demand for targeted therapies and improved drug efficacy.
- Oncological Diseases: Significant unmet medical needs and substantial investment in cancer nanomedicine.
Detailed Dominance Analysis: The dominance of North America is projected to continue throughout the forecast period, driven by continued innovation and strong regulatory support. However, rapidly developing economies in Asia are expected to show substantial growth, increasing their market share. The Drug Delivery segment will maintain its leadership position as nanotechnology continues to address challenges in targeted drug delivery and enhanced bioavailability.
Nanotechnology Industry Product Innovations
Recent years have witnessed significant advancements in nanotechnology-based products. Innovations include novel drug delivery systems using liposomes and nanoparticles for enhanced therapeutic efficacy, advanced biomaterials with improved biocompatibility and functionalities, and sophisticated diagnostic imaging agents with improved sensitivity and resolution. These innovations offer significant competitive advantages by addressing unmet medical needs and improving patient outcomes. Technological trends, such as the increasing use of AI and machine learning in nanomaterials design and characterization, are further driving product innovation and improving market fit.
Report Segmentation & Scope
This report segments the nanotechnology industry by application (Drug Delivery, Biomaterials, Active Implants, Diagnostic Imaging, Tissue Regeneration) and disease (Cardiovascular Diseases, Oncological Diseases, Neurological Diseases, Orthopedic Diseases, Infectious Diseases, Other Diseases). Each segment includes detailed analysis of market size, growth projections, and competitive dynamics. For instance, the drug delivery segment is projected to experience significant growth driven by increasing demand for targeted therapies and personalized medicine. Similarly, the oncological disease segment is expected to grow substantially due to the high prevalence of cancer and the need for advanced treatment options.
Key Drivers of Nanotechnology Industry Growth
Several factors are driving the growth of the nanotechnology industry, including advancements in nanomaterials synthesis and characterization, increased investment in R&D from both public and private sectors, and increasing prevalence of chronic diseases. Government initiatives promoting nanotechnology, such as funding research grants and tax incentives, are accelerating growth. Additionally, the growing demand for personalized medicine and improved diagnostics is driving the adoption of nanotechnology-based solutions.
Challenges in the Nanotechnology Industry Sector
Despite substantial growth potential, the nanotechnology industry faces challenges, including stringent regulatory hurdles for product approval, concerns regarding the potential toxicity of certain nanomaterials, and ensuring consistent supply chains. The high cost of R&D and manufacturing can also limit market accessibility. These challenges, if not effectively addressed, could impede the industry's growth trajectory. For example, regulatory delays can cost companies xx Million in lost revenue annually.
Leading Players in the Nanotechnology Industry Market
- Pfizer Inc
- Ensysce Biosciences Inc
- Sanofi SA
- Spago Nanomedical AB
- LiPlasome Pharma ApS
- CytImmune Sciences
- Genetic Immunity
- NanoCarrier Co Ltd
- Copernicus Therapeutics Inc
- Merck & Co Inc
- Nanobiotix
- Nanospectra Biosciences
- CytImmune Sciences Inc
- Starpharma Holdings Limited
- Nami Therapeutics Corp
- Taiwan Liposome Company Ltd
- Johnson & Johnson
- Ocuphire Pharma Inc
- Luminex Corporation
- Bristol-Myers Squibb Company
Key Developments in Nanotechnology Industry Sector
- January 2022: NaNotics LLC partnered with Mayo Clinic to develop a nanotechnology-based therapy targeting PD-L1.
- March 2021: A European collaboration received EUR 12 Million in funding for advancements in medical nanotechnology.
Strategic Nanotechnology Industry Market Outlook
The future of the nanotechnology industry is promising, with significant growth potential across diverse applications. Strategic opportunities exist in developing innovative nanomaterials with improved properties, expanding applications in personalized medicine and diagnostics, and strengthening collaborations between academia and industry. Addressing regulatory challenges and enhancing public understanding of nanotechnology's safety profile are crucial for unlocking the industry's full potential. The market is poised for continued expansion, driven by increasing demand, technological breakthroughs, and sustained investment.
Nanotechnology Industry Segmentation
-
1. Application
- 1.1. Drug Delivery
- 1.2. Biomaterials
- 1.3. Active Implants
- 1.4. Diagnostic Imaging
- 1.5. Tissue Regeneration
-
2. Disease
- 2.1. Cardiovascular Diseases
- 2.2. Oncological Diseases
- 2.3. Neurological Diseases
- 2.4. Orthopedic Diseases
- 2.5. Infectious Diseases
- 2.6. Other Diseases
Nanotechnology Industry Segmentation By Geography
-
1. North America
- 1.1. United States
- 1.2. Canada
- 1.3. Mexico
-
2. Europe
- 2.1. France
- 2.2. Germany
- 2.3. United Kingdom
- 2.4. Italy
- 2.5. Spain
- 2.6. Rest of Europe
-
3. Asia Pacific
- 3.1. China
- 3.2. Japan
- 3.3. India
- 3.4. Australia
- 3.5. South Korea
- 3.6. Rest of Asia Pacific
-
4. Middle East and Africa
- 4.1. GCC
- 4.2. South Africa
- 4.3. Rest of Middle East and Africa
-
5. South America
- 5.1. Brazil
- 5.2. Argentina
- 5.3. Rest of South America
Nanotechnology Industry REPORT HIGHLIGHTS
| Aspects | Details |
|---|---|
| Study Period | 2019-2033 |
| Base Year | 2024 |
| Estimated Year | 2025 |
| Forecast Period | 2025-2033 |
| Historical Period | 2019-2024 |
| Growth Rate | CAGR of 11.90% from 2019-2033 |
| Segmentation |
|
Table of Contents
- 1. Introduction
- 1.1. Research Scope
- 1.2. Market Segmentation
- 1.3. Research Methodology
- 1.4. Definitions and Assumptions
- 2. Executive Summary
- 2.1. Introduction
- 3. Market Dynamics
- 3.1. Introduction
- 3.2. Market Drivers
- 3.2.1. Growing Prevalence of Cancer and Genetic and Cardiovascular Diseases; Increasing Advancements in Nanoscale Technologies for Diagnostic Procedures; Growing Preference for Personalized Medicines
- 3.3. Market Restrains
- 3.3.1. High Costs; Stringent Regulations for Commercial Introduction
- 3.4. Market Trends
- 3.4.1. The Oncological Diseases Segment is Expected to Show Better Growth During the Forecast Period
- 4. Market Factor Analysis
- 4.1. Porters Five Forces
- 4.2. Supply/Value Chain
- 4.3. PESTEL analysis
- 4.4. Market Entropy
- 4.5. Patent/Trademark Analysis
- 5. Global Nanotechnology Industry Analysis, Insights and Forecast, 2019-2031
- 5.1. Market Analysis, Insights and Forecast - by Application
- 5.1.1. Drug Delivery
- 5.1.2. Biomaterials
- 5.1.3. Active Implants
- 5.1.4. Diagnostic Imaging
- 5.1.5. Tissue Regeneration
- 5.2. Market Analysis, Insights and Forecast - by Disease
- 5.2.1. Cardiovascular Diseases
- 5.2.2. Oncological Diseases
- 5.2.3. Neurological Diseases
- 5.2.4. Orthopedic Diseases
- 5.2.5. Infectious Diseases
- 5.2.6. Other Diseases
- 5.3. Market Analysis, Insights and Forecast - by Region
- 5.3.1. North America
- 5.3.2. Europe
- 5.3.3. Asia Pacific
- 5.3.4. Middle East and Africa
- 5.3.5. South America
- 5.1. Market Analysis, Insights and Forecast - by Application
- 6. North America Nanotechnology Industry Analysis, Insights and Forecast, 2019-2031
- 6.1. Market Analysis, Insights and Forecast - by Application
- 6.1.1. Drug Delivery
- 6.1.2. Biomaterials
- 6.1.3. Active Implants
- 6.1.4. Diagnostic Imaging
- 6.1.5. Tissue Regeneration
- 6.2. Market Analysis, Insights and Forecast - by Disease
- 6.2.1. Cardiovascular Diseases
- 6.2.2. Oncological Diseases
- 6.2.3. Neurological Diseases
- 6.2.4. Orthopedic Diseases
- 6.2.5. Infectious Diseases
- 6.2.6. Other Diseases
- 6.1. Market Analysis, Insights and Forecast - by Application
- 7. Europe Nanotechnology Industry Analysis, Insights and Forecast, 2019-2031
- 7.1. Market Analysis, Insights and Forecast - by Application
- 7.1.1. Drug Delivery
- 7.1.2. Biomaterials
- 7.1.3. Active Implants
- 7.1.4. Diagnostic Imaging
- 7.1.5. Tissue Regeneration
- 7.2. Market Analysis, Insights and Forecast - by Disease
- 7.2.1. Cardiovascular Diseases
- 7.2.2. Oncological Diseases
- 7.2.3. Neurological Diseases
- 7.2.4. Orthopedic Diseases
- 7.2.5. Infectious Diseases
- 7.2.6. Other Diseases
- 7.1. Market Analysis, Insights and Forecast - by Application
- 8. Asia Pacific Nanotechnology Industry Analysis, Insights and Forecast, 2019-2031
- 8.1. Market Analysis, Insights and Forecast - by Application
- 8.1.1. Drug Delivery
- 8.1.2. Biomaterials
- 8.1.3. Active Implants
- 8.1.4. Diagnostic Imaging
- 8.1.5. Tissue Regeneration
- 8.2. Market Analysis, Insights and Forecast - by Disease
- 8.2.1. Cardiovascular Diseases
- 8.2.2. Oncological Diseases
- 8.2.3. Neurological Diseases
- 8.2.4. Orthopedic Diseases
- 8.2.5. Infectious Diseases
- 8.2.6. Other Diseases
- 8.1. Market Analysis, Insights and Forecast - by Application
- 9. Middle East and Africa Nanotechnology Industry Analysis, Insights and Forecast, 2019-2031
- 9.1. Market Analysis, Insights and Forecast - by Application
- 9.1.1. Drug Delivery
- 9.1.2. Biomaterials
- 9.1.3. Active Implants
- 9.1.4. Diagnostic Imaging
- 9.1.5. Tissue Regeneration
- 9.2. Market Analysis, Insights and Forecast - by Disease
- 9.2.1. Cardiovascular Diseases
- 9.2.2. Oncological Diseases
- 9.2.3. Neurological Diseases
- 9.2.4. Orthopedic Diseases
- 9.2.5. Infectious Diseases
- 9.2.6. Other Diseases
- 9.1. Market Analysis, Insights and Forecast - by Application
- 10. South America Nanotechnology Industry Analysis, Insights and Forecast, 2019-2031
- 10.1. Market Analysis, Insights and Forecast - by Application
- 10.1.1. Drug Delivery
- 10.1.2. Biomaterials
- 10.1.3. Active Implants
- 10.1.4. Diagnostic Imaging
- 10.1.5. Tissue Regeneration
- 10.2. Market Analysis, Insights and Forecast - by Disease
- 10.2.1. Cardiovascular Diseases
- 10.2.2. Oncological Diseases
- 10.2.3. Neurological Diseases
- 10.2.4. Orthopedic Diseases
- 10.2.5. Infectious Diseases
- 10.2.6. Other Diseases
- 10.1. Market Analysis, Insights and Forecast - by Application
- 11. North America Nanotechnology Industry Analysis, Insights and Forecast, 2019-2031
- 11.1. Market Analysis, Insights and Forecast - By Country/Sub-region
- 11.1.1 United States
- 11.1.2 Canada
- 11.1.3 Mexico
- 12. Europe Nanotechnology Industry Analysis, Insights and Forecast, 2019-2031
- 12.1. Market Analysis, Insights and Forecast - By Country/Sub-region
- 12.1.1 France
- 12.1.2 Germany
- 12.1.3 United Kingdom
- 12.1.4 Italy
- 12.1.5 Spain
- 12.1.6 Rest of Europe
- 13. Asia Pacific Nanotechnology Industry Analysis, Insights and Forecast, 2019-2031
- 13.1. Market Analysis, Insights and Forecast - By Country/Sub-region
- 13.1.1 China
- 13.1.2 Japan
- 13.1.3 India
- 13.1.4 Australia
- 13.1.5 South Korea
- 13.1.6 Rest of Asia Pacific
- 14. Middle East and Africa Nanotechnology Industry Analysis, Insights and Forecast, 2019-2031
- 14.1. Market Analysis, Insights and Forecast - By Country/Sub-region
- 14.1.1 GCC
- 14.1.2 South Africa
- 14.1.3 Rest of Middle East and Africa
- 15. South America Nanotechnology Industry Analysis, Insights and Forecast, 2019-2031
- 15.1. Market Analysis, Insights and Forecast - By Country/Sub-region
- 15.1.1 Brazil
- 15.1.2 Argentina
- 15.1.3 Rest of South America
- 16. Competitive Analysis
- 16.1. Global Market Share Analysis 2024
- 16.2. Company Profiles
- 16.2.1 Pfizer Inc
- 16.2.1.1. Overview
- 16.2.1.2. Products
- 16.2.1.3. SWOT Analysis
- 16.2.1.4. Recent Developments
- 16.2.1.5. Financials (Based on Availability)
- 16.2.2 Ensysce Biosciences Inc
- 16.2.2.1. Overview
- 16.2.2.2. Products
- 16.2.2.3. SWOT Analysis
- 16.2.2.4. Recent Developments
- 16.2.2.5. Financials (Based on Availability)
- 16.2.3 Sanofi SA
- 16.2.3.1. Overview
- 16.2.3.2. Products
- 16.2.3.3. SWOT Analysis
- 16.2.3.4. Recent Developments
- 16.2.3.5. Financials (Based on Availability)
- 16.2.4 Spago Nanomedical AB
- 16.2.4.1. Overview
- 16.2.4.2. Products
- 16.2.4.3. SWOT Analysis
- 16.2.4.4. Recent Developments
- 16.2.4.5. Financials (Based on Availability)
- 16.2.5 LiPlasome Pharma ApS
- 16.2.5.1. Overview
- 16.2.5.2. Products
- 16.2.5.3. SWOT Analysis
- 16.2.5.4. Recent Developments
- 16.2.5.5. Financials (Based on Availability)
- 16.2.6 CytImmune Sciences
- 16.2.6.1. Overview
- 16.2.6.2. Products
- 16.2.6.3. SWOT Analysis
- 16.2.6.4. Recent Developments
- 16.2.6.5. Financials (Based on Availability)
- 16.2.7 Genetic Immunity
- 16.2.7.1. Overview
- 16.2.7.2. Products
- 16.2.7.3. SWOT Analysis
- 16.2.7.4. Recent Developments
- 16.2.7.5. Financials (Based on Availability)
- 16.2.8 NanoCarrier Co Ltd
- 16.2.8.1. Overview
- 16.2.8.2. Products
- 16.2.8.3. SWOT Analysis
- 16.2.8.4. Recent Developments
- 16.2.8.5. Financials (Based on Availability)
- 16.2.9 Copernicus Therapeutics Inc
- 16.2.9.1. Overview
- 16.2.9.2. Products
- 16.2.9.3. SWOT Analysis
- 16.2.9.4. Recent Developments
- 16.2.9.5. Financials (Based on Availability)
- 16.2.10 Merck & Co Inc
- 16.2.10.1. Overview
- 16.2.10.2. Products
- 16.2.10.3. SWOT Analysis
- 16.2.10.4. Recent Developments
- 16.2.10.5. Financials (Based on Availability)
- 16.2.11 Nanobiotix
- 16.2.11.1. Overview
- 16.2.11.2. Products
- 16.2.11.3. SWOT Analysis
- 16.2.11.4. Recent Developments
- 16.2.11.5. Financials (Based on Availability)
- 16.2.12 Nanospectra Biosciences
- 16.2.12.1. Overview
- 16.2.12.2. Products
- 16.2.12.3. SWOT Analysis
- 16.2.12.4. Recent Developments
- 16.2.12.5. Financials (Based on Availability)
- 16.2.13 CytImmune Sciences Inc
- 16.2.13.1. Overview
- 16.2.13.2. Products
- 16.2.13.3. SWOT Analysis
- 16.2.13.4. Recent Developments
- 16.2.13.5. Financials (Based on Availability)
- 16.2.14 Starpharma Holdings Limited
- 16.2.14.1. Overview
- 16.2.14.2. Products
- 16.2.14.3. SWOT Analysis
- 16.2.14.4. Recent Developments
- 16.2.14.5. Financials (Based on Availability)
- 16.2.15 Nami Therapeutics Corp
- 16.2.15.1. Overview
- 16.2.15.2. Products
- 16.2.15.3. SWOT Analysis
- 16.2.15.4. Recent Developments
- 16.2.15.5. Financials (Based on Availability)
- 16.2.16 Taiwan Liposome Company Ltd
- 16.2.16.1. Overview
- 16.2.16.2. Products
- 16.2.16.3. SWOT Analysis
- 16.2.16.4. Recent Developments
- 16.2.16.5. Financials (Based on Availability)
- 16.2.17 Johnson & Johnson
- 16.2.17.1. Overview
- 16.2.17.2. Products
- 16.2.17.3. SWOT Analysis
- 16.2.17.4. Recent Developments
- 16.2.17.5. Financials (Based on Availability)
- 16.2.18 Ocuphire Pharma Inc
- 16.2.18.1. Overview
- 16.2.18.2. Products
- 16.2.18.3. SWOT Analysis
- 16.2.18.4. Recent Developments
- 16.2.18.5. Financials (Based on Availability)
- 16.2.19 Luminex Corporation
- 16.2.19.1. Overview
- 16.2.19.2. Products
- 16.2.19.3. SWOT Analysis
- 16.2.19.4. Recent Developments
- 16.2.19.5. Financials (Based on Availability)
- 16.2.20 Bristol-Myers Squibb Company
- 16.2.20.1. Overview
- 16.2.20.2. Products
- 16.2.20.3. SWOT Analysis
- 16.2.20.4. Recent Developments
- 16.2.20.5. Financials (Based on Availability)
- 16.2.1 Pfizer Inc
List of Figures
- Figure 1: Global Nanotechnology Industry Revenue Breakdown (Million, %) by Region 2024 & 2032
- Figure 2: North America Nanotechnology Industry Revenue (Million), by Country 2024 & 2032
- Figure 3: North America Nanotechnology Industry Revenue Share (%), by Country 2024 & 2032
- Figure 4: Europe Nanotechnology Industry Revenue (Million), by Country 2024 & 2032
- Figure 5: Europe Nanotechnology Industry Revenue Share (%), by Country 2024 & 2032
- Figure 6: Asia Pacific Nanotechnology Industry Revenue (Million), by Country 2024 & 2032
- Figure 7: Asia Pacific Nanotechnology Industry Revenue Share (%), by Country 2024 & 2032
- Figure 8: Middle East and Africa Nanotechnology Industry Revenue (Million), by Country 2024 & 2032
- Figure 9: Middle East and Africa Nanotechnology Industry Revenue Share (%), by Country 2024 & 2032
- Figure 10: South America Nanotechnology Industry Revenue (Million), by Country 2024 & 2032
- Figure 11: South America Nanotechnology Industry Revenue Share (%), by Country 2024 & 2032
- Figure 12: North America Nanotechnology Industry Revenue (Million), by Application 2024 & 2032
- Figure 13: North America Nanotechnology Industry Revenue Share (%), by Application 2024 & 2032
- Figure 14: North America Nanotechnology Industry Revenue (Million), by Disease 2024 & 2032
- Figure 15: North America Nanotechnology Industry Revenue Share (%), by Disease 2024 & 2032
- Figure 16: North America Nanotechnology Industry Revenue (Million), by Country 2024 & 2032
- Figure 17: North America Nanotechnology Industry Revenue Share (%), by Country 2024 & 2032
- Figure 18: Europe Nanotechnology Industry Revenue (Million), by Application 2024 & 2032
- Figure 19: Europe Nanotechnology Industry Revenue Share (%), by Application 2024 & 2032
- Figure 20: Europe Nanotechnology Industry Revenue (Million), by Disease 2024 & 2032
- Figure 21: Europe Nanotechnology Industry Revenue Share (%), by Disease 2024 & 2032
- Figure 22: Europe Nanotechnology Industry Revenue (Million), by Country 2024 & 2032
- Figure 23: Europe Nanotechnology Industry Revenue Share (%), by Country 2024 & 2032
- Figure 24: Asia Pacific Nanotechnology Industry Revenue (Million), by Application 2024 & 2032
- Figure 25: Asia Pacific Nanotechnology Industry Revenue Share (%), by Application 2024 & 2032
- Figure 26: Asia Pacific Nanotechnology Industry Revenue (Million), by Disease 2024 & 2032
- Figure 27: Asia Pacific Nanotechnology Industry Revenue Share (%), by Disease 2024 & 2032
- Figure 28: Asia Pacific Nanotechnology Industry Revenue (Million), by Country 2024 & 2032
- Figure 29: Asia Pacific Nanotechnology Industry Revenue Share (%), by Country 2024 & 2032
- Figure 30: Middle East and Africa Nanotechnology Industry Revenue (Million), by Application 2024 & 2032
- Figure 31: Middle East and Africa Nanotechnology Industry Revenue Share (%), by Application 2024 & 2032
- Figure 32: Middle East and Africa Nanotechnology Industry Revenue (Million), by Disease 2024 & 2032
- Figure 33: Middle East and Africa Nanotechnology Industry Revenue Share (%), by Disease 2024 & 2032
- Figure 34: Middle East and Africa Nanotechnology Industry Revenue (Million), by Country 2024 & 2032
- Figure 35: Middle East and Africa Nanotechnology Industry Revenue Share (%), by Country 2024 & 2032
- Figure 36: South America Nanotechnology Industry Revenue (Million), by Application 2024 & 2032
- Figure 37: South America Nanotechnology Industry Revenue Share (%), by Application 2024 & 2032
- Figure 38: South America Nanotechnology Industry Revenue (Million), by Disease 2024 & 2032
- Figure 39: South America Nanotechnology Industry Revenue Share (%), by Disease 2024 & 2032
- Figure 40: South America Nanotechnology Industry Revenue (Million), by Country 2024 & 2032
- Figure 41: South America Nanotechnology Industry Revenue Share (%), by Country 2024 & 2032
List of Tables
- Table 1: Global Nanotechnology Industry Revenue Million Forecast, by Region 2019 & 2032
- Table 2: Global Nanotechnology Industry Revenue Million Forecast, by Application 2019 & 2032
- Table 3: Global Nanotechnology Industry Revenue Million Forecast, by Disease 2019 & 2032
- Table 4: Global Nanotechnology Industry Revenue Million Forecast, by Region 2019 & 2032
- Table 5: Global Nanotechnology Industry Revenue Million Forecast, by Country 2019 & 2032
- Table 6: United States Nanotechnology Industry Revenue (Million) Forecast, by Application 2019 & 2032
- Table 7: Canada Nanotechnology Industry Revenue (Million) Forecast, by Application 2019 & 2032
- Table 8: Mexico Nanotechnology Industry Revenue (Million) Forecast, by Application 2019 & 2032
- Table 9: Global Nanotechnology Industry Revenue Million Forecast, by Country 2019 & 2032
- Table 10: France Nanotechnology Industry Revenue (Million) Forecast, by Application 2019 & 2032
- Table 11: Germany Nanotechnology Industry Revenue (Million) Forecast, by Application 2019 & 2032
- Table 12: United Kingdom Nanotechnology Industry Revenue (Million) Forecast, by Application 2019 & 2032
- Table 13: Italy Nanotechnology Industry Revenue (Million) Forecast, by Application 2019 & 2032
- Table 14: Spain Nanotechnology Industry Revenue (Million) Forecast, by Application 2019 & 2032
- Table 15: Rest of Europe Nanotechnology Industry Revenue (Million) Forecast, by Application 2019 & 2032
- Table 16: Global Nanotechnology Industry Revenue Million Forecast, by Country 2019 & 2032
- Table 17: China Nanotechnology Industry Revenue (Million) Forecast, by Application 2019 & 2032
- Table 18: Japan Nanotechnology Industry Revenue (Million) Forecast, by Application 2019 & 2032
- Table 19: India Nanotechnology Industry Revenue (Million) Forecast, by Application 2019 & 2032
- Table 20: Australia Nanotechnology Industry Revenue (Million) Forecast, by Application 2019 & 2032
- Table 21: South Korea Nanotechnology Industry Revenue (Million) Forecast, by Application 2019 & 2032
- Table 22: Rest of Asia Pacific Nanotechnology Industry Revenue (Million) Forecast, by Application 2019 & 2032
- Table 23: Global Nanotechnology Industry Revenue Million Forecast, by Country 2019 & 2032
- Table 24: GCC Nanotechnology Industry Revenue (Million) Forecast, by Application 2019 & 2032
- Table 25: South Africa Nanotechnology Industry Revenue (Million) Forecast, by Application 2019 & 2032
- Table 26: Rest of Middle East and Africa Nanotechnology Industry Revenue (Million) Forecast, by Application 2019 & 2032
- Table 27: Global Nanotechnology Industry Revenue Million Forecast, by Country 2019 & 2032
- Table 28: Brazil Nanotechnology Industry Revenue (Million) Forecast, by Application 2019 & 2032
- Table 29: Argentina Nanotechnology Industry Revenue (Million) Forecast, by Application 2019 & 2032
- Table 30: Rest of South America Nanotechnology Industry Revenue (Million) Forecast, by Application 2019 & 2032
- Table 31: Global Nanotechnology Industry Revenue Million Forecast, by Application 2019 & 2032
- Table 32: Global Nanotechnology Industry Revenue Million Forecast, by Disease 2019 & 2032
- Table 33: Global Nanotechnology Industry Revenue Million Forecast, by Country 2019 & 2032
- Table 34: United States Nanotechnology Industry Revenue (Million) Forecast, by Application 2019 & 2032
- Table 35: Canada Nanotechnology Industry Revenue (Million) Forecast, by Application 2019 & 2032
- Table 36: Mexico Nanotechnology Industry Revenue (Million) Forecast, by Application 2019 & 2032
- Table 37: Global Nanotechnology Industry Revenue Million Forecast, by Application 2019 & 2032
- Table 38: Global Nanotechnology Industry Revenue Million Forecast, by Disease 2019 & 2032
- Table 39: Global Nanotechnology Industry Revenue Million Forecast, by Country 2019 & 2032
- Table 40: France Nanotechnology Industry Revenue (Million) Forecast, by Application 2019 & 2032
- Table 41: Germany Nanotechnology Industry Revenue (Million) Forecast, by Application 2019 & 2032
- Table 42: United Kingdom Nanotechnology Industry Revenue (Million) Forecast, by Application 2019 & 2032
- Table 43: Italy Nanotechnology Industry Revenue (Million) Forecast, by Application 2019 & 2032
- Table 44: Spain Nanotechnology Industry Revenue (Million) Forecast, by Application 2019 & 2032
- Table 45: Rest of Europe Nanotechnology Industry Revenue (Million) Forecast, by Application 2019 & 2032
- Table 46: Global Nanotechnology Industry Revenue Million Forecast, by Application 2019 & 2032
- Table 47: Global Nanotechnology Industry Revenue Million Forecast, by Disease 2019 & 2032
- Table 48: Global Nanotechnology Industry Revenue Million Forecast, by Country 2019 & 2032
- Table 49: China Nanotechnology Industry Revenue (Million) Forecast, by Application 2019 & 2032
- Table 50: Japan Nanotechnology Industry Revenue (Million) Forecast, by Application 2019 & 2032
- Table 51: India Nanotechnology Industry Revenue (Million) Forecast, by Application 2019 & 2032
- Table 52: Australia Nanotechnology Industry Revenue (Million) Forecast, by Application 2019 & 2032
- Table 53: South Korea Nanotechnology Industry Revenue (Million) Forecast, by Application 2019 & 2032
- Table 54: Rest of Asia Pacific Nanotechnology Industry Revenue (Million) Forecast, by Application 2019 & 2032
- Table 55: Global Nanotechnology Industry Revenue Million Forecast, by Application 2019 & 2032
- Table 56: Global Nanotechnology Industry Revenue Million Forecast, by Disease 2019 & 2032
- Table 57: Global Nanotechnology Industry Revenue Million Forecast, by Country 2019 & 2032
- Table 58: GCC Nanotechnology Industry Revenue (Million) Forecast, by Application 2019 & 2032
- Table 59: South Africa Nanotechnology Industry Revenue (Million) Forecast, by Application 2019 & 2032
- Table 60: Rest of Middle East and Africa Nanotechnology Industry Revenue (Million) Forecast, by Application 2019 & 2032
- Table 61: Global Nanotechnology Industry Revenue Million Forecast, by Application 2019 & 2032
- Table 62: Global Nanotechnology Industry Revenue Million Forecast, by Disease 2019 & 2032
- Table 63: Global Nanotechnology Industry Revenue Million Forecast, by Country 2019 & 2032
- Table 64: Brazil Nanotechnology Industry Revenue (Million) Forecast, by Application 2019 & 2032
- Table 65: Argentina Nanotechnology Industry Revenue (Million) Forecast, by Application 2019 & 2032
- Table 66: Rest of South America Nanotechnology Industry Revenue (Million) Forecast, by Application 2019 & 2032
Frequently Asked Questions
1. What is the projected Compound Annual Growth Rate (CAGR) of the Nanotechnology Industry?
The projected CAGR is approximately 11.90%.
2. Which companies are prominent players in the Nanotechnology Industry?
Key companies in the market include Pfizer Inc, Ensysce Biosciences Inc, Sanofi SA, Spago Nanomedical AB, LiPlasome Pharma ApS, CytImmune Sciences, Genetic Immunity, NanoCarrier Co Ltd, Copernicus Therapeutics Inc, Merck & Co Inc, Nanobiotix, Nanospectra Biosciences, CytImmune Sciences Inc, Starpharma Holdings Limited, Nami Therapeutics Corp, Taiwan Liposome Company Ltd, Johnson & Johnson, Ocuphire Pharma Inc, Luminex Corporation, Bristol-Myers Squibb Company.
3. What are the main segments of the Nanotechnology Industry?
The market segments include Application, Disease.
4. Can you provide details about the market size?
The market size is estimated to be USD XX Million as of 2022.
5. What are some drivers contributing to market growth?
Growing Prevalence of Cancer and Genetic and Cardiovascular Diseases; Increasing Advancements in Nanoscale Technologies for Diagnostic Procedures; Growing Preference for Personalized Medicines.
6. What are the notable trends driving market growth?
The Oncological Diseases Segment is Expected to Show Better Growth During the Forecast Period.
7. Are there any restraints impacting market growth?
High Costs; Stringent Regulations for Commercial Introduction.
8. Can you provide examples of recent developments in the market?
In January 2022, NaNotics LLC entered a research collaboration with Mayo Clinic to develop a NaNot that targets the soluble form of PD-L1, a tumor-generated immune inhibitor.
9. What pricing options are available for accessing the report?
Pricing options include single-user, multi-user, and enterprise licenses priced at USD 4750, USD 5250, and USD 8750 respectively.
10. Is the market size provided in terms of value or volume?
The market size is provided in terms of value, measured in Million.
11. Are there any specific market keywords associated with the report?
Yes, the market keyword associated with the report is "Nanotechnology Industry," which aids in identifying and referencing the specific market segment covered.
12. How do I determine which pricing option suits my needs best?
The pricing options vary based on user requirements and access needs. Individual users may opt for single-user licenses, while businesses requiring broader access may choose multi-user or enterprise licenses for cost-effective access to the report.
13. Are there any additional resources or data provided in the Nanotechnology Industry report?
While the report offers comprehensive insights, it's advisable to review the specific contents or supplementary materials provided to ascertain if additional resources or data are available.
14. How can I stay updated on further developments or reports in the Nanotechnology Industry?
To stay informed about further developments, trends, and reports in the Nanotechnology Industry, consider subscribing to industry newsletters, following relevant companies and organizations, or regularly checking reputable industry news sources and publications.
Methodology
Step 1 - Identification of Relevant Samples Size from Population Database


Step 2 - Approaches for Defining Global Market Size (Value, Volume* & Price*)

Note*: In applicable scenarios
Step 3 - Data Sources
Primary Research
- Web Analytics
- Survey Reports
- Research Institute
- Latest Research Reports
- Opinion Leaders
Secondary Research
- Annual Reports
- White Paper
- Latest Press Release
- Industry Association
- Paid Database
- Investor Presentations

Step 4 - Data Triangulation
Involves using different sources of information in order to increase the validity of a study
These sources are likely to be stakeholders in a program - participants, other researchers, program staff, other community members, and so on.
Then we put all data in single framework & apply various statistical tools to find out the dynamic on the market.
During the analysis stage, feedback from the stakeholder groups would be compared to determine areas of agreement as well as areas of divergence


