
Key Insights
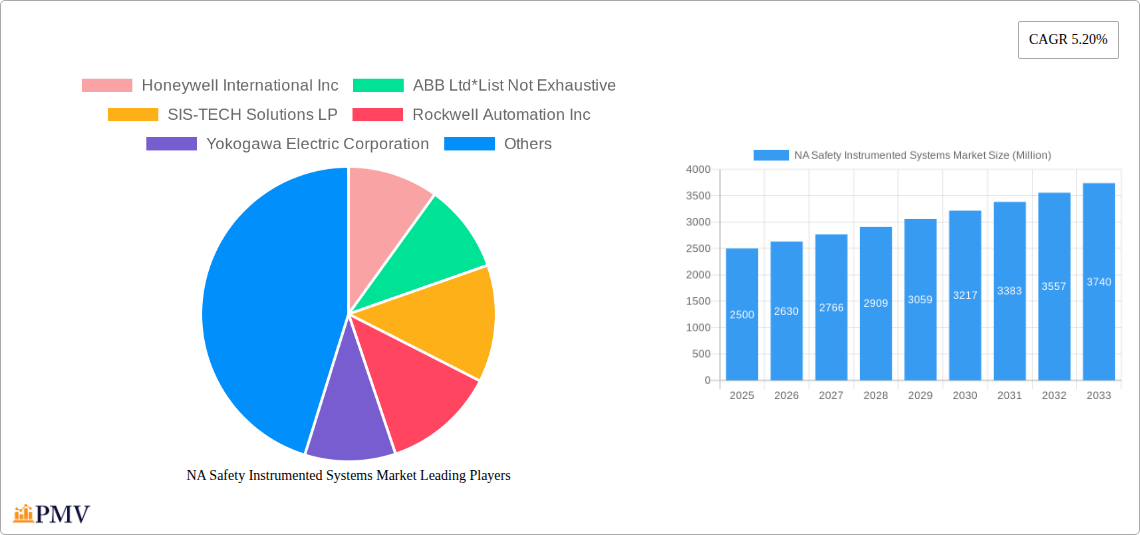
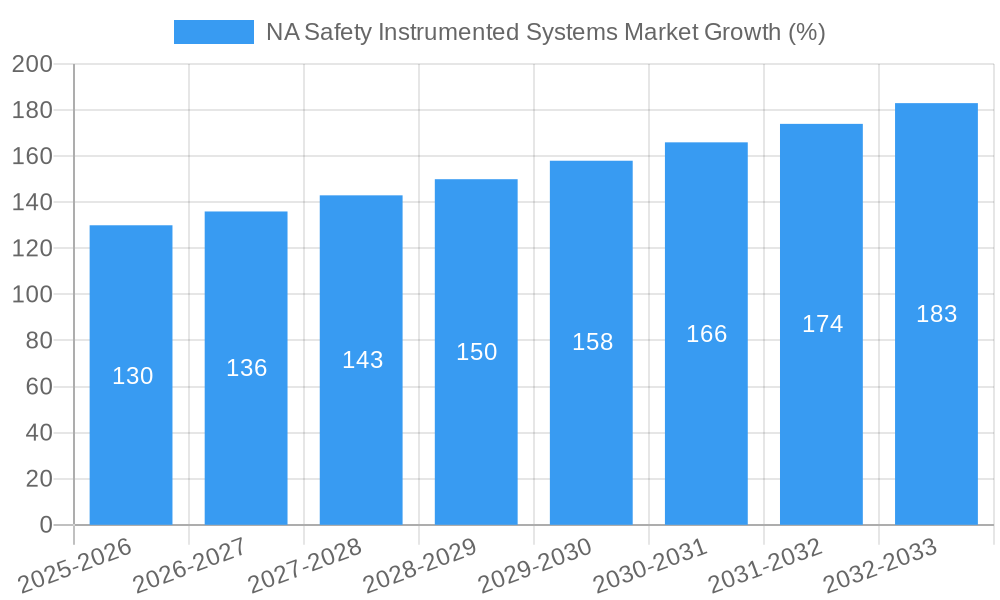
The North American Safety Instrumented Systems (SIS) market is experiencing robust growth, driven by increasing regulatory mandates for process safety, heightened focus on operational efficiency, and the expanding adoption of Industry 4.0 technologies across various sectors. The market, valued at approximately $2.5 billion in 2025, is projected to maintain a Compound Annual Growth Rate (CAGR) of 5.20% from 2025 to 2033. Key application areas include Emergency Shutdown Systems (ESD), Fire and Gas Monitoring and Control (F&GC), and High Integrity Pressure Protection Systems (HIPPS), which together constitute a significant portion of the market. The Oil and Gas sector, particularly the upstream and midstream segments, represents a major end-user, followed by the Chemicals and Petrochemicals industry. Growth is further fueled by the rising demand for advanced SIS solutions with enhanced functionalities, such as predictive maintenance capabilities and improved cybersecurity features. This trend is particularly evident in the power generation and pharmaceutical sectors where stringent safety and reliability requirements are paramount. While competitive intensity among established players like Honeywell, ABB, Rockwell Automation, and Emerson Electric Company remains high, opportunities exist for specialized providers catering to niche applications and geographic regions.
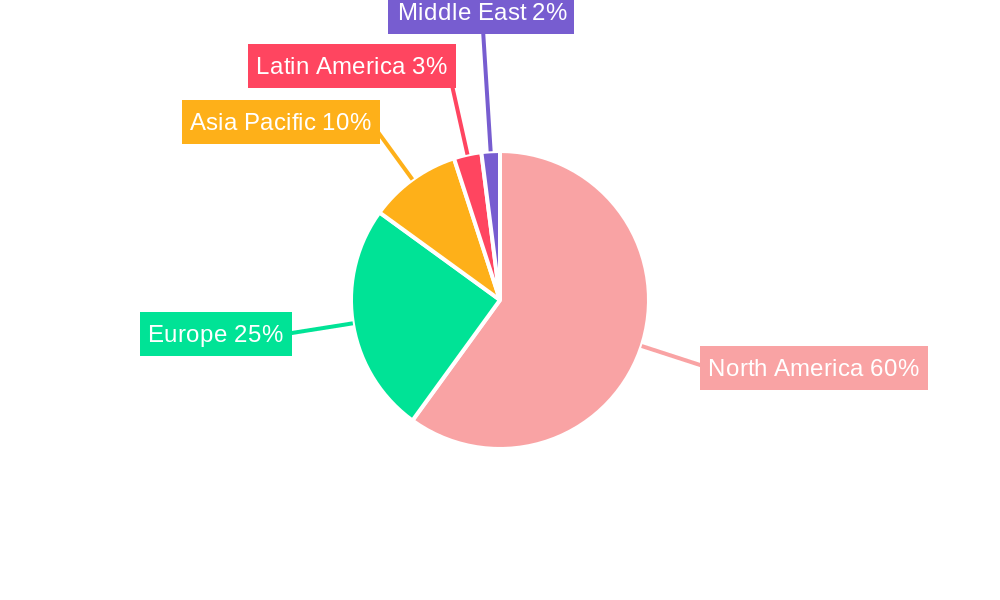
Despite the positive outlook, the market faces challenges such as high initial investment costs associated with SIS implementation and the complexity of integrating these systems with existing infrastructure. Furthermore, a skilled workforce shortage in the engineering and maintenance sectors might hinder the market's growth trajectory. However, technological advancements, increasing awareness of the consequences of safety incidents, and the growing adoption of digital twins for improved safety and performance are likely to mitigate these restraints. The North American market's dominance is underpinned by stringent safety regulations, robust industrial infrastructure, and technological innovation within the region, leading to continued expansion in the forecast period. The continued development of sophisticated SIS technologies and the ongoing digital transformation across numerous industries will propel future growth.
North American Safety Instrumented Systems (SIS) Market Report: 2019-2033
This comprehensive report provides a detailed analysis of the North American Safety Instrumented Systems (SIS) market, offering invaluable insights for industry professionals, investors, and strategic decision-makers. The report covers the period 2019-2033, with a focus on the 2025-2033 forecast period, and incorporates data from the historical period (2019-2024) and the base year (2025). The market is segmented by application, end-user, and geography (United States and Canada). Key players analyzed include Honeywell International Inc, ABB Ltd, SIS-TECH Solutions LP, Rockwell Automation Inc, Yokogawa Electric Corporation, Schlumberger Limited, INTECH Process Automation, and Emerson Electric Company. The total market size is expected to reach xx Million by 2033.
NA Safety Instrumented Systems Market Market Structure & Competitive Dynamics
The North American SIS market exhibits a moderately consolidated structure, with several major players holding significant market share. Market concentration is influenced by factors such as technological advancements, regulatory compliance requirements, and the strategic acquisitions and mergers within the industry. The market's innovation ecosystem is dynamic, driven by the continuous development of advanced SIS technologies and the integration of Industry 4.0 principles. Stringent safety regulations in the oil and gas, chemical, and power generation sectors create a robust regulatory framework that significantly influences market growth. Product substitutes are limited, primarily because of stringent safety standards. However, increasing demand for cost-effective solutions is gradually pushing companies toward newer and affordable technologies.
End-user trends reveal a growing preference for integrated SIS solutions that enhance operational efficiency and reduce costs. The market has witnessed several mergers and acquisitions (M&A) activities in recent years, reflecting the strategic consolidation efforts of key players. While specific M&A deal values are not publicly available for all transactions, significant deals have shaped the market landscape. For example, the acquisition of Company X by Company Y in 2022 resulted in a xx% increase in market share for Company Y. This trend is expected to continue, driving further consolidation in the near future.
NA Safety Instrumented Systems Market Industry Trends & Insights
The North American SIS market is experiencing robust growth, driven by increasing industrial automation, stringent safety regulations across diverse sectors, and the growing demand for advanced process safety management systems. The market's Compound Annual Growth Rate (CAGR) during the forecast period (2025-2033) is estimated to be xx%. Technological disruptions, primarily driven by the adoption of artificial intelligence (AI), machine learning (ML), and the Internet of Things (IoT), are revolutionizing SIS technologies. These advancements enable predictive maintenance, improved diagnostics, and enhanced operational efficiency.
Consumer preferences are shifting towards integrated, modular, and scalable SIS solutions that offer seamless integration with existing plant infrastructure. Competitive dynamics are intensely competitive, with companies focusing on product innovation, strategic partnerships, and geographical expansion to maintain their market position. Market penetration is high in established industries such as oil and gas and chemicals, while growth opportunities exist in emerging sectors like pharmaceuticals and food and beverage. The increased adoption of cloud-based solutions for data management and remote monitoring will further drive market growth in the coming years.
Dominant Markets & Segments in NA Safety Instrumented Systems Market
The United States represents the dominant market within North America, driven by its robust industrial base, especially in sectors like oil and gas, chemicals, and power generation. Canada also shows significant growth potential owing to ongoing investments in its energy sector and stringent environmental regulations.
Key Drivers:
- United States: Strong industrial base, robust regulatory framework, high adoption of advanced technologies.
- Canada: Growing energy sector investments, emphasis on environmental sustainability, and governmental support for industrial automation.
Dominant Segments:
- Application: Emergency Shutdown Systems (ESD) holds the largest market share due to mandatory regulations and the critical role it plays in preventing catastrophic events. Fire & Gas Monitoring and Control (F&GC) is also a significant segment, witnessing robust growth owing to increased focus on workplace safety and environmental protection.
- End-User: The Oil and Gas sector is the leading end-user, with the Upstream segment contributing xx%, Downstream xx%, and Midstream xx%. The Chemicals and Petrochemicals sector is another major contributor.
NA Safety Instrumented Systems Market Product Innovations
Recent innovations in SIS technology encompass the integration of AI and ML for predictive maintenance, enabling proactive identification and mitigation of potential safety hazards. The development of compact and modular SIS systems enhances flexibility and scalability, allowing for easier integration into existing plant infrastructure. The increasing utilization of cloud-based platforms for data management and remote monitoring improves operational efficiency and reduces downtime. These advancements are enhancing the market fit of SIS by providing more efficient and cost-effective solutions tailored to specific industry needs.
Report Segmentation & Scope
This report segments the North American SIS market by application (Emergency Shutdown Systems (ESD), Fire and Gas Monitoring and Control (F&GC), High Integrity Pressure Protection Systems (HIPPS), Burner Management Systems (BMS), Turbo Machinery Control, Other Applications), end-user (Chemicals and Petrochemicals, Power Generation, Pharmaceutical, Food and Beverage, Oil and Gas (Upstream, Downstream, Midstream), Other End Users), and geography (United States, Canada). Each segment's growth projections, market sizes, and competitive dynamics are analyzed to provide a comprehensive understanding of the market landscape. The market is expected to witness substantial growth across all segments due to factors like increasing automation and stringent safety regulations.
Key Drivers of NA Safety Instrumented Systems Market Growth
Several key factors drive the growth of the NA SIS market. These include stringent safety regulations mandating the implementation of SIS in various industries, the increasing adoption of automation technologies in industrial processes to enhance efficiency and productivity, and the rising demand for advanced process safety management systems. Technological advancements, such as AI and IoT, are also playing a pivotal role by enabling predictive maintenance, reducing downtime, and enhancing overall system reliability.
Challenges in the NA Safety Instrumented Systems Market Sector
Despite the growth potential, the NA SIS market faces challenges, including the high initial investment costs associated with implementing SIS, the complexities involved in integrating SIS with existing plant infrastructure, and the need for skilled personnel to operate and maintain these systems. Supply chain disruptions can also impact the timely availability of components and systems, potentially leading to project delays.
Leading Players in the NA Safety Instrumented Systems Market Market
- Honeywell International Inc
- ABB Ltd
- SIS-TECH Solutions LP
- Rockwell Automation Inc
- Yokogawa Electric Corporation
- Schlumberger Limited
- INTECH Process Automation
- Emerson Electric Company
Key Developments in NA Safety Instrumented Systems Market Sector
- October 2022: Emerson launched Movicon.NExT 4.2, a powerful SCADA-based software enhancing plant automation and operational excellence.
- January 2023: Emerson secured a significant contract for the Ras Laffan Petrochemical Complex in Qatar, providing integrated process control and safety systems, showcasing the demand for advanced SIS solutions in large-scale projects.
Strategic NA Safety Instrumented Systems Market Market Outlook
The future of the North American SIS market looks promising, driven by sustained industrial growth, the increasing adoption of advanced technologies, and a growing emphasis on safety and environmental regulations. Strategic opportunities lie in developing innovative and integrated SIS solutions that leverage AI, IoT, and cloud computing to enhance efficiency, reduce costs, and improve safety. Companies focusing on providing customized solutions tailored to specific industry needs and geographical regions are expected to gain a competitive edge in this dynamic market.
NA Safety Instrumented Systems Market Segmentation
-
1. Application
- 1.1. Emergency Shutdown Systems (ESD)
- 1.2. Fire and Gas Monitoring and Control (F&GC)
- 1.3. High Integrity Pressure Protection Systems (HIPPS)
- 1.4. Burner Management Systems (BMS)
- 1.5. Turbo Machinery Control
- 1.6. Other Applications
-
2. End User
- 2.1. Chemicals and Petrochemicals
- 2.2. Power Generation
- 2.3. Pharmaceutical
- 2.4. Food and Beverage
- 2.5. Oil and
- 2.6. Other End Users
NA Safety Instrumented Systems Market Segmentation By Geography
-
1. North America
- 1.1. United States
- 1.2. Canada
- 1.3. Mexico
-
2. South America
- 2.1. Brazil
- 2.2. Argentina
- 2.3. Rest of South America
-
3. Europe
- 3.1. United Kingdom
- 3.2. Germany
- 3.3. France
- 3.4. Italy
- 3.5. Spain
- 3.6. Russia
- 3.7. Benelux
- 3.8. Nordics
- 3.9. Rest of Europe
-
4. Middle East & Africa
- 4.1. Turkey
- 4.2. Israel
- 4.3. GCC
- 4.4. North Africa
- 4.5. South Africa
- 4.6. Rest of Middle East & Africa
-
5. Asia Pacific
- 5.1. China
- 5.2. India
- 5.3. Japan
- 5.4. South Korea
- 5.5. ASEAN
- 5.6. Oceania
- 5.7. Rest of Asia Pacific
NA Safety Instrumented Systems Market REPORT HIGHLIGHTS
| Aspects | Details |
|---|---|
| Study Period | 2019-2033 |
| Base Year | 2024 |
| Estimated Year | 2025 |
| Forecast Period | 2025-2033 |
| Historical Period | 2019-2024 |
| Growth Rate | CAGR of 5.20% from 2019-2033 |
| Segmentation |
|
Table of Contents
- 1. Introduction
- 1.1. Research Scope
- 1.2. Market Segmentation
- 1.3. Research Methodology
- 1.4. Definitions and Assumptions
- 2. Executive Summary
- 2.1. Introduction
- 3. Market Dynamics
- 3.1. Introduction
- 3.2. Market Drivers
- 3.2.1. Growing Regulatory Environment in the Industry; Presence of Robust SIS Service Ecosystem
- 3.3. Market Restrains
- 3.3.1. Operational Complexity and High Maintenance Costs
- 3.4. Market Trends
- 3.4.1. Chemical and Petrochemical Industry Expected to Hold Major Market Share
- 4. Market Factor Analysis
- 4.1. Porters Five Forces
- 4.2. Supply/Value Chain
- 4.3. PESTEL analysis
- 4.4. Market Entropy
- 4.5. Patent/Trademark Analysis
- 5. Global NA Safety Instrumented Systems Market Analysis, Insights and Forecast, 2019-2031
- 5.1. Market Analysis, Insights and Forecast - by Application
- 5.1.1. Emergency Shutdown Systems (ESD)
- 5.1.2. Fire and Gas Monitoring and Control (F&GC)
- 5.1.3. High Integrity Pressure Protection Systems (HIPPS)
- 5.1.4. Burner Management Systems (BMS)
- 5.1.5. Turbo Machinery Control
- 5.1.6. Other Applications
- 5.2. Market Analysis, Insights and Forecast - by End User
- 5.2.1. Chemicals and Petrochemicals
- 5.2.2. Power Generation
- 5.2.3. Pharmaceutical
- 5.2.4. Food and Beverage
- 5.2.5. Oil and
- 5.2.6. Other End Users
- 5.3. Market Analysis, Insights and Forecast - by Region
- 5.3.1. North America
- 5.3.2. South America
- 5.3.3. Europe
- 5.3.4. Middle East & Africa
- 5.3.5. Asia Pacific
- 5.1. Market Analysis, Insights and Forecast - by Application
- 6. North America NA Safety Instrumented Systems Market Analysis, Insights and Forecast, 2019-2031
- 6.1. Market Analysis, Insights and Forecast - by Application
- 6.1.1. Emergency Shutdown Systems (ESD)
- 6.1.2. Fire and Gas Monitoring and Control (F&GC)
- 6.1.3. High Integrity Pressure Protection Systems (HIPPS)
- 6.1.4. Burner Management Systems (BMS)
- 6.1.5. Turbo Machinery Control
- 6.1.6. Other Applications
- 6.2. Market Analysis, Insights and Forecast - by End User
- 6.2.1. Chemicals and Petrochemicals
- 6.2.2. Power Generation
- 6.2.3. Pharmaceutical
- 6.2.4. Food and Beverage
- 6.2.5. Oil and
- 6.2.6. Other End Users
- 6.1. Market Analysis, Insights and Forecast - by Application
- 7. South America NA Safety Instrumented Systems Market Analysis, Insights and Forecast, 2019-2031
- 7.1. Market Analysis, Insights and Forecast - by Application
- 7.1.1. Emergency Shutdown Systems (ESD)
- 7.1.2. Fire and Gas Monitoring and Control (F&GC)
- 7.1.3. High Integrity Pressure Protection Systems (HIPPS)
- 7.1.4. Burner Management Systems (BMS)
- 7.1.5. Turbo Machinery Control
- 7.1.6. Other Applications
- 7.2. Market Analysis, Insights and Forecast - by End User
- 7.2.1. Chemicals and Petrochemicals
- 7.2.2. Power Generation
- 7.2.3. Pharmaceutical
- 7.2.4. Food and Beverage
- 7.2.5. Oil and
- 7.2.6. Other End Users
- 7.1. Market Analysis, Insights and Forecast - by Application
- 8. Europe NA Safety Instrumented Systems Market Analysis, Insights and Forecast, 2019-2031
- 8.1. Market Analysis, Insights and Forecast - by Application
- 8.1.1. Emergency Shutdown Systems (ESD)
- 8.1.2. Fire and Gas Monitoring and Control (F&GC)
- 8.1.3. High Integrity Pressure Protection Systems (HIPPS)
- 8.1.4. Burner Management Systems (BMS)
- 8.1.5. Turbo Machinery Control
- 8.1.6. Other Applications
- 8.2. Market Analysis, Insights and Forecast - by End User
- 8.2.1. Chemicals and Petrochemicals
- 8.2.2. Power Generation
- 8.2.3. Pharmaceutical
- 8.2.4. Food and Beverage
- 8.2.5. Oil and
- 8.2.6. Other End Users
- 8.1. Market Analysis, Insights and Forecast - by Application
- 9. Middle East & Africa NA Safety Instrumented Systems Market Analysis, Insights and Forecast, 2019-2031
- 9.1. Market Analysis, Insights and Forecast - by Application
- 9.1.1. Emergency Shutdown Systems (ESD)
- 9.1.2. Fire and Gas Monitoring and Control (F&GC)
- 9.1.3. High Integrity Pressure Protection Systems (HIPPS)
- 9.1.4. Burner Management Systems (BMS)
- 9.1.5. Turbo Machinery Control
- 9.1.6. Other Applications
- 9.2. Market Analysis, Insights and Forecast - by End User
- 9.2.1. Chemicals and Petrochemicals
- 9.2.2. Power Generation
- 9.2.3. Pharmaceutical
- 9.2.4. Food and Beverage
- 9.2.5. Oil and
- 9.2.6. Other End Users
- 9.1. Market Analysis, Insights and Forecast - by Application
- 10. Asia Pacific NA Safety Instrumented Systems Market Analysis, Insights and Forecast, 2019-2031
- 10.1. Market Analysis, Insights and Forecast - by Application
- 10.1.1. Emergency Shutdown Systems (ESD)
- 10.1.2. Fire and Gas Monitoring and Control (F&GC)
- 10.1.3. High Integrity Pressure Protection Systems (HIPPS)
- 10.1.4. Burner Management Systems (BMS)
- 10.1.5. Turbo Machinery Control
- 10.1.6. Other Applications
- 10.2. Market Analysis, Insights and Forecast - by End User
- 10.2.1. Chemicals and Petrochemicals
- 10.2.2. Power Generation
- 10.2.3. Pharmaceutical
- 10.2.4. Food and Beverage
- 10.2.5. Oil and
- 10.2.6. Other End Users
- 10.1. Market Analysis, Insights and Forecast - by Application
- 11. North America NA Safety Instrumented Systems Market Analysis, Insights and Forecast, 2019-2031
- 11.1. Market Analysis, Insights and Forecast - By Country/Sub-region
- 11.1.1.
- 12. Europe NA Safety Instrumented Systems Market Analysis, Insights and Forecast, 2019-2031
- 12.1. Market Analysis, Insights and Forecast - By Country/Sub-region
- 12.1.1.
- 13. Asia Pacific NA Safety Instrumented Systems Market Analysis, Insights and Forecast, 2019-2031
- 13.1. Market Analysis, Insights and Forecast - By Country/Sub-region
- 13.1.1.
- 14. Latin America NA Safety Instrumented Systems Market Analysis, Insights and Forecast, 2019-2031
- 14.1. Market Analysis, Insights and Forecast - By Country/Sub-region
- 14.1.1.
- 15. Middle East NA Safety Instrumented Systems Market Analysis, Insights and Forecast, 2019-2031
- 15.1. Market Analysis, Insights and Forecast - By Country/Sub-region
- 15.1.1.
- 16. Competitive Analysis
- 16.1. Global Market Share Analysis 2024
- 16.2. Company Profiles
- 16.2.1 Honeywell International Inc
- 16.2.1.1. Overview
- 16.2.1.2. Products
- 16.2.1.3. SWOT Analysis
- 16.2.1.4. Recent Developments
- 16.2.1.5. Financials (Based on Availability)
- 16.2.2 ABB Ltd*List Not Exhaustive
- 16.2.2.1. Overview
- 16.2.2.2. Products
- 16.2.2.3. SWOT Analysis
- 16.2.2.4. Recent Developments
- 16.2.2.5. Financials (Based on Availability)
- 16.2.3 SIS-TECH Solutions LP
- 16.2.3.1. Overview
- 16.2.3.2. Products
- 16.2.3.3. SWOT Analysis
- 16.2.3.4. Recent Developments
- 16.2.3.5. Financials (Based on Availability)
- 16.2.4 Rockwell Automation Inc
- 16.2.4.1. Overview
- 16.2.4.2. Products
- 16.2.4.3. SWOT Analysis
- 16.2.4.4. Recent Developments
- 16.2.4.5. Financials (Based on Availability)
- 16.2.5 Yokogawa Electric Corporation
- 16.2.5.1. Overview
- 16.2.5.2. Products
- 16.2.5.3. SWOT Analysis
- 16.2.5.4. Recent Developments
- 16.2.5.5. Financials (Based on Availability)
- 16.2.6 Schlumberger Limited
- 16.2.6.1. Overview
- 16.2.6.2. Products
- 16.2.6.3. SWOT Analysis
- 16.2.6.4. Recent Developments
- 16.2.6.5. Financials (Based on Availability)
- 16.2.7 INTECH Process Automation
- 16.2.7.1. Overview
- 16.2.7.2. Products
- 16.2.7.3. SWOT Analysis
- 16.2.7.4. Recent Developments
- 16.2.7.5. Financials (Based on Availability)
- 16.2.8 Emerson Electric Company
- 16.2.8.1. Overview
- 16.2.8.2. Products
- 16.2.8.3. SWOT Analysis
- 16.2.8.4. Recent Developments
- 16.2.8.5. Financials (Based on Availability)
- 16.2.1 Honeywell International Inc
List of Figures
- Figure 1: Global NA Safety Instrumented Systems Market Revenue Breakdown (Million, %) by Region 2024 & 2032
- Figure 2: North America NA Safety Instrumented Systems Market Revenue (Million), by Country 2024 & 2032
- Figure 3: North America NA Safety Instrumented Systems Market Revenue Share (%), by Country 2024 & 2032
- Figure 4: Europe NA Safety Instrumented Systems Market Revenue (Million), by Country 2024 & 2032
- Figure 5: Europe NA Safety Instrumented Systems Market Revenue Share (%), by Country 2024 & 2032
- Figure 6: Asia Pacific NA Safety Instrumented Systems Market Revenue (Million), by Country 2024 & 2032
- Figure 7: Asia Pacific NA Safety Instrumented Systems Market Revenue Share (%), by Country 2024 & 2032
- Figure 8: Latin America NA Safety Instrumented Systems Market Revenue (Million), by Country 2024 & 2032
- Figure 9: Latin America NA Safety Instrumented Systems Market Revenue Share (%), by Country 2024 & 2032
- Figure 10: Middle East NA Safety Instrumented Systems Market Revenue (Million), by Country 2024 & 2032
- Figure 11: Middle East NA Safety Instrumented Systems Market Revenue Share (%), by Country 2024 & 2032
- Figure 12: North America NA Safety Instrumented Systems Market Revenue (Million), by Application 2024 & 2032
- Figure 13: North America NA Safety Instrumented Systems Market Revenue Share (%), by Application 2024 & 2032
- Figure 14: North America NA Safety Instrumented Systems Market Revenue (Million), by End User 2024 & 2032
- Figure 15: North America NA Safety Instrumented Systems Market Revenue Share (%), by End User 2024 & 2032
- Figure 16: North America NA Safety Instrumented Systems Market Revenue (Million), by Country 2024 & 2032
- Figure 17: North America NA Safety Instrumented Systems Market Revenue Share (%), by Country 2024 & 2032
- Figure 18: South America NA Safety Instrumented Systems Market Revenue (Million), by Application 2024 & 2032
- Figure 19: South America NA Safety Instrumented Systems Market Revenue Share (%), by Application 2024 & 2032
- Figure 20: South America NA Safety Instrumented Systems Market Revenue (Million), by End User 2024 & 2032
- Figure 21: South America NA Safety Instrumented Systems Market Revenue Share (%), by End User 2024 & 2032
- Figure 22: South America NA Safety Instrumented Systems Market Revenue (Million), by Country 2024 & 2032
- Figure 23: South America NA Safety Instrumented Systems Market Revenue Share (%), by Country 2024 & 2032
- Figure 24: Europe NA Safety Instrumented Systems Market Revenue (Million), by Application 2024 & 2032
- Figure 25: Europe NA Safety Instrumented Systems Market Revenue Share (%), by Application 2024 & 2032
- Figure 26: Europe NA Safety Instrumented Systems Market Revenue (Million), by End User 2024 & 2032
- Figure 27: Europe NA Safety Instrumented Systems Market Revenue Share (%), by End User 2024 & 2032
- Figure 28: Europe NA Safety Instrumented Systems Market Revenue (Million), by Country 2024 & 2032
- Figure 29: Europe NA Safety Instrumented Systems Market Revenue Share (%), by Country 2024 & 2032
- Figure 30: Middle East & Africa NA Safety Instrumented Systems Market Revenue (Million), by Application 2024 & 2032
- Figure 31: Middle East & Africa NA Safety Instrumented Systems Market Revenue Share (%), by Application 2024 & 2032
- Figure 32: Middle East & Africa NA Safety Instrumented Systems Market Revenue (Million), by End User 2024 & 2032
- Figure 33: Middle East & Africa NA Safety Instrumented Systems Market Revenue Share (%), by End User 2024 & 2032
- Figure 34: Middle East & Africa NA Safety Instrumented Systems Market Revenue (Million), by Country 2024 & 2032
- Figure 35: Middle East & Africa NA Safety Instrumented Systems Market Revenue Share (%), by Country 2024 & 2032
- Figure 36: Asia Pacific NA Safety Instrumented Systems Market Revenue (Million), by Application 2024 & 2032
- Figure 37: Asia Pacific NA Safety Instrumented Systems Market Revenue Share (%), by Application 2024 & 2032
- Figure 38: Asia Pacific NA Safety Instrumented Systems Market Revenue (Million), by End User 2024 & 2032
- Figure 39: Asia Pacific NA Safety Instrumented Systems Market Revenue Share (%), by End User 2024 & 2032
- Figure 40: Asia Pacific NA Safety Instrumented Systems Market Revenue (Million), by Country 2024 & 2032
- Figure 41: Asia Pacific NA Safety Instrumented Systems Market Revenue Share (%), by Country 2024 & 2032
List of Tables
- Table 1: Global NA Safety Instrumented Systems Market Revenue Million Forecast, by Region 2019 & 2032
- Table 2: Global NA Safety Instrumented Systems Market Revenue Million Forecast, by Application 2019 & 2032
- Table 3: Global NA Safety Instrumented Systems Market Revenue Million Forecast, by End User 2019 & 2032
- Table 4: Global NA Safety Instrumented Systems Market Revenue Million Forecast, by Region 2019 & 2032
- Table 5: Global NA Safety Instrumented Systems Market Revenue Million Forecast, by Country 2019 & 2032
- Table 6: NA Safety Instrumented Systems Market Revenue (Million) Forecast, by Application 2019 & 2032
- Table 7: Global NA Safety Instrumented Systems Market Revenue Million Forecast, by Country 2019 & 2032
- Table 8: NA Safety Instrumented Systems Market Revenue (Million) Forecast, by Application 2019 & 2032
- Table 9: Global NA Safety Instrumented Systems Market Revenue Million Forecast, by Country 2019 & 2032
- Table 10: NA Safety Instrumented Systems Market Revenue (Million) Forecast, by Application 2019 & 2032
- Table 11: Global NA Safety Instrumented Systems Market Revenue Million Forecast, by Country 2019 & 2032
- Table 12: NA Safety Instrumented Systems Market Revenue (Million) Forecast, by Application 2019 & 2032
- Table 13: Global NA Safety Instrumented Systems Market Revenue Million Forecast, by Country 2019 & 2032
- Table 14: NA Safety Instrumented Systems Market Revenue (Million) Forecast, by Application 2019 & 2032
- Table 15: Global NA Safety Instrumented Systems Market Revenue Million Forecast, by Application 2019 & 2032
- Table 16: Global NA Safety Instrumented Systems Market Revenue Million Forecast, by End User 2019 & 2032
- Table 17: Global NA Safety Instrumented Systems Market Revenue Million Forecast, by Country 2019 & 2032
- Table 18: United States NA Safety Instrumented Systems Market Revenue (Million) Forecast, by Application 2019 & 2032
- Table 19: Canada NA Safety Instrumented Systems Market Revenue (Million) Forecast, by Application 2019 & 2032
- Table 20: Mexico NA Safety Instrumented Systems Market Revenue (Million) Forecast, by Application 2019 & 2032
- Table 21: Global NA Safety Instrumented Systems Market Revenue Million Forecast, by Application 2019 & 2032
- Table 22: Global NA Safety Instrumented Systems Market Revenue Million Forecast, by End User 2019 & 2032
- Table 23: Global NA Safety Instrumented Systems Market Revenue Million Forecast, by Country 2019 & 2032
- Table 24: Brazil NA Safety Instrumented Systems Market Revenue (Million) Forecast, by Application 2019 & 2032
- Table 25: Argentina NA Safety Instrumented Systems Market Revenue (Million) Forecast, by Application 2019 & 2032
- Table 26: Rest of South America NA Safety Instrumented Systems Market Revenue (Million) Forecast, by Application 2019 & 2032
- Table 27: Global NA Safety Instrumented Systems Market Revenue Million Forecast, by Application 2019 & 2032
- Table 28: Global NA Safety Instrumented Systems Market Revenue Million Forecast, by End User 2019 & 2032
- Table 29: Global NA Safety Instrumented Systems Market Revenue Million Forecast, by Country 2019 & 2032
- Table 30: United Kingdom NA Safety Instrumented Systems Market Revenue (Million) Forecast, by Application 2019 & 2032
- Table 31: Germany NA Safety Instrumented Systems Market Revenue (Million) Forecast, by Application 2019 & 2032
- Table 32: France NA Safety Instrumented Systems Market Revenue (Million) Forecast, by Application 2019 & 2032
- Table 33: Italy NA Safety Instrumented Systems Market Revenue (Million) Forecast, by Application 2019 & 2032
- Table 34: Spain NA Safety Instrumented Systems Market Revenue (Million) Forecast, by Application 2019 & 2032
- Table 35: Russia NA Safety Instrumented Systems Market Revenue (Million) Forecast, by Application 2019 & 2032
- Table 36: Benelux NA Safety Instrumented Systems Market Revenue (Million) Forecast, by Application 2019 & 2032
- Table 37: Nordics NA Safety Instrumented Systems Market Revenue (Million) Forecast, by Application 2019 & 2032
- Table 38: Rest of Europe NA Safety Instrumented Systems Market Revenue (Million) Forecast, by Application 2019 & 2032
- Table 39: Global NA Safety Instrumented Systems Market Revenue Million Forecast, by Application 2019 & 2032
- Table 40: Global NA Safety Instrumented Systems Market Revenue Million Forecast, by End User 2019 & 2032
- Table 41: Global NA Safety Instrumented Systems Market Revenue Million Forecast, by Country 2019 & 2032
- Table 42: Turkey NA Safety Instrumented Systems Market Revenue (Million) Forecast, by Application 2019 & 2032
- Table 43: Israel NA Safety Instrumented Systems Market Revenue (Million) Forecast, by Application 2019 & 2032
- Table 44: GCC NA Safety Instrumented Systems Market Revenue (Million) Forecast, by Application 2019 & 2032
- Table 45: North Africa NA Safety Instrumented Systems Market Revenue (Million) Forecast, by Application 2019 & 2032
- Table 46: South Africa NA Safety Instrumented Systems Market Revenue (Million) Forecast, by Application 2019 & 2032
- Table 47: Rest of Middle East & Africa NA Safety Instrumented Systems Market Revenue (Million) Forecast, by Application 2019 & 2032
- Table 48: Global NA Safety Instrumented Systems Market Revenue Million Forecast, by Application 2019 & 2032
- Table 49: Global NA Safety Instrumented Systems Market Revenue Million Forecast, by End User 2019 & 2032
- Table 50: Global NA Safety Instrumented Systems Market Revenue Million Forecast, by Country 2019 & 2032
- Table 51: China NA Safety Instrumented Systems Market Revenue (Million) Forecast, by Application 2019 & 2032
- Table 52: India NA Safety Instrumented Systems Market Revenue (Million) Forecast, by Application 2019 & 2032
- Table 53: Japan NA Safety Instrumented Systems Market Revenue (Million) Forecast, by Application 2019 & 2032
- Table 54: South Korea NA Safety Instrumented Systems Market Revenue (Million) Forecast, by Application 2019 & 2032
- Table 55: ASEAN NA Safety Instrumented Systems Market Revenue (Million) Forecast, by Application 2019 & 2032
- Table 56: Oceania NA Safety Instrumented Systems Market Revenue (Million) Forecast, by Application 2019 & 2032
- Table 57: Rest of Asia Pacific NA Safety Instrumented Systems Market Revenue (Million) Forecast, by Application 2019 & 2032
Frequently Asked Questions
1. What is the projected Compound Annual Growth Rate (CAGR) of the NA Safety Instrumented Systems Market?
The projected CAGR is approximately 5.20%.
2. Which companies are prominent players in the NA Safety Instrumented Systems Market?
Key companies in the market include Honeywell International Inc, ABB Ltd*List Not Exhaustive, SIS-TECH Solutions LP, Rockwell Automation Inc, Yokogawa Electric Corporation, Schlumberger Limited, INTECH Process Automation, Emerson Electric Company.
3. What are the main segments of the NA Safety Instrumented Systems Market?
The market segments include Application, End User.
4. Can you provide details about the market size?
The market size is estimated to be USD XX Million as of 2022.
5. What are some drivers contributing to market growth?
Growing Regulatory Environment in the Industry; Presence of Robust SIS Service Ecosystem.
6. What are the notable trends driving market growth?
Chemical and Petrochemical Industry Expected to Hold Major Market Share.
7. Are there any restraints impacting market growth?
Operational Complexity and High Maintenance Costs.
8. Can you provide examples of recent developments in the market?
January 2023 - The Ras Laffan Petrochemical Complex in Qatar would include automation technology, software, and analytics from Emerson. The USD 6 billion integrated polymers project is presently under development and is anticipated to be completed in late 2026. It is a joint venture between QatarEnergy and Chevron Phillips Chemical. Through its DeltaV distributed control system and Rosemount gas analyzer solutions, Emerson will provide integrated process control and safety systems that use cutting-edge predictive technologies to lower operational complexity and decrease project risk.
9. What pricing options are available for accessing the report?
Pricing options include single-user, multi-user, and enterprise licenses priced at USD 4750, USD 4950, and USD 6800 respectively.
10. Is the market size provided in terms of value or volume?
The market size is provided in terms of value, measured in Million.
11. Are there any specific market keywords associated with the report?
Yes, the market keyword associated with the report is "NA Safety Instrumented Systems Market," which aids in identifying and referencing the specific market segment covered.
12. How do I determine which pricing option suits my needs best?
The pricing options vary based on user requirements and access needs. Individual users may opt for single-user licenses, while businesses requiring broader access may choose multi-user or enterprise licenses for cost-effective access to the report.
13. Are there any additional resources or data provided in the NA Safety Instrumented Systems Market report?
While the report offers comprehensive insights, it's advisable to review the specific contents or supplementary materials provided to ascertain if additional resources or data are available.
14. How can I stay updated on further developments or reports in the NA Safety Instrumented Systems Market?
To stay informed about further developments, trends, and reports in the NA Safety Instrumented Systems Market, consider subscribing to industry newsletters, following relevant companies and organizations, or regularly checking reputable industry news sources and publications.
Methodology
Step 1 - Identification of Relevant Samples Size from Population Database


Step 2 - Approaches for Defining Global Market Size (Value, Volume* & Price*)

Note*: In applicable scenarios
Step 3 - Data Sources
Primary Research
- Web Analytics
- Survey Reports
- Research Institute
- Latest Research Reports
- Opinion Leaders
Secondary Research
- Annual Reports
- White Paper
- Latest Press Release
- Industry Association
- Paid Database
- Investor Presentations

Step 4 - Data Triangulation
Involves using different sources of information in order to increase the validity of a study
These sources are likely to be stakeholders in a program - participants, other researchers, program staff, other community members, and so on.
Then we put all data in single framework & apply various statistical tools to find out the dynamic on the market.
During the analysis stage, feedback from the stakeholder groups would be compared to determine areas of agreement as well as areas of divergence


