
Key Insights
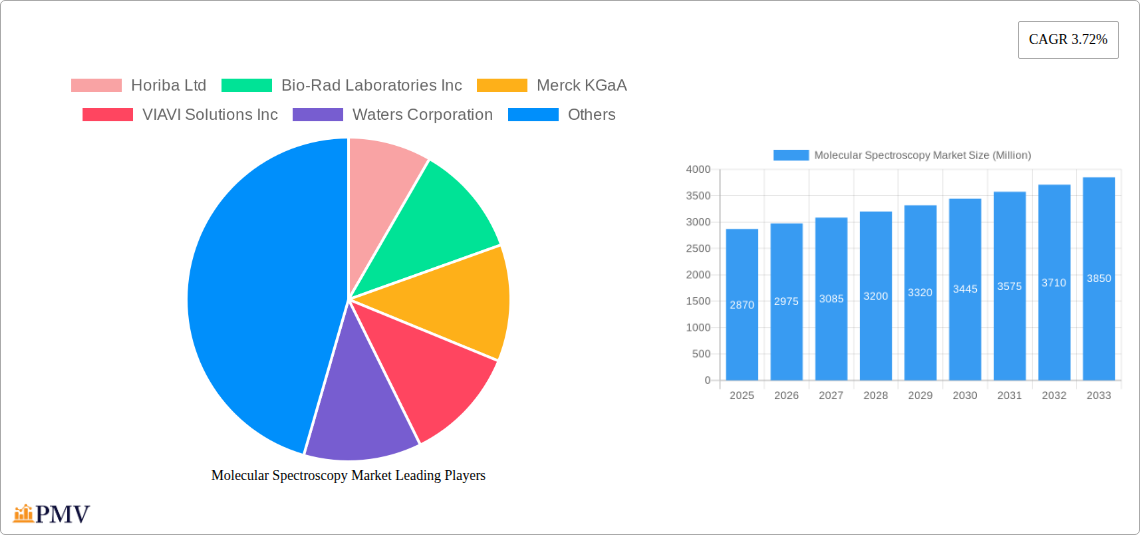
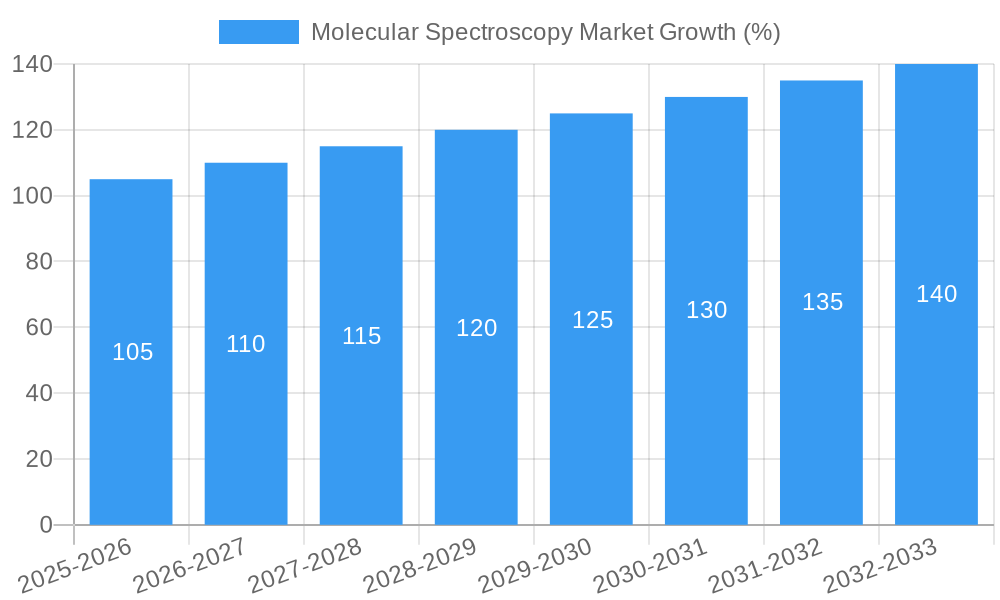
The global molecular spectroscopy market, valued at $2.87 billion in 2025, is projected to experience robust growth, driven by escalating demand across diverse sectors. A compound annual growth rate (CAGR) of 3.72% from 2025 to 2033 indicates a significant expansion, primarily fueled by the increasing adoption of advanced analytical techniques in pharmaceutical research and development, food safety and quality control, and environmental monitoring. The pharmaceutical industry's reliance on precise molecular characterization for drug discovery and development is a major growth catalyst. Similarly, the stringent regulations surrounding food safety and quality are driving the adoption of molecular spectroscopy techniques for contaminant detection and quality assurance in the food and beverage sector. Furthermore, the expanding biotechnology and biopharmaceutical industries are contributing significantly to market growth, with molecular spectroscopy playing a crucial role in characterizing biomolecules and understanding biological processes. Technological advancements, such as miniaturization and improved sensitivity of instruments, are also fostering market expansion. The growing prevalence of chronic diseases and the need for rapid and accurate diagnostics are further bolstering demand for molecular spectroscopy solutions.
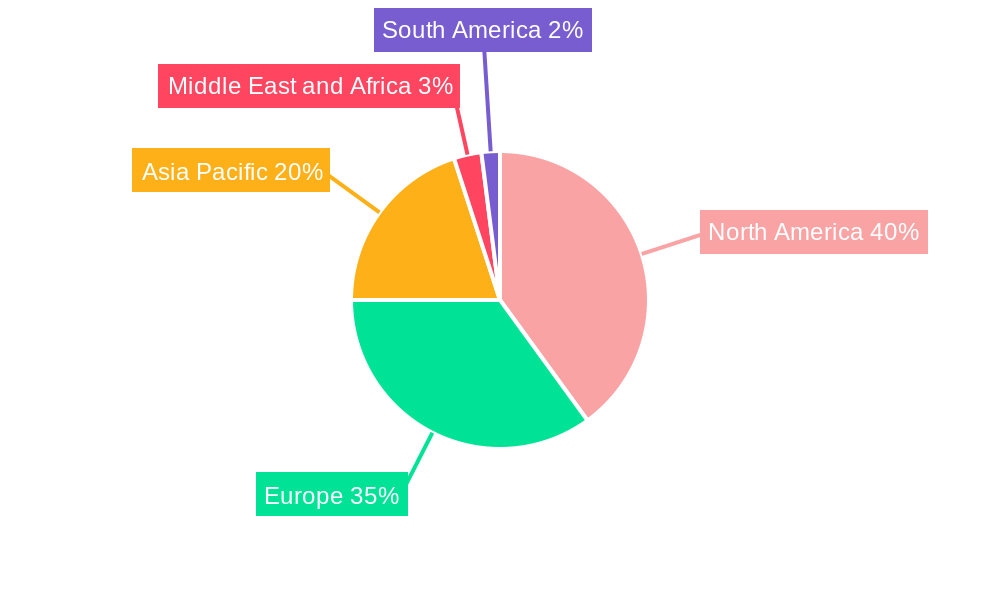
Segment-wise analysis reveals that NMR, Raman, and IR spectroscopy are key contributors to the market’s overall value, owing to their widespread applications and established presence across various industries. The pharmaceutical applications segment currently holds a substantial market share due to its stringent regulatory requirements and the vital need for accurate drug characterization. However, the burgeoning biotechnology and environmental testing segments are poised for rapid growth, propelled by rising awareness about environmental pollution and the increasing need for efficient, eco-friendly technologies. Geographical analysis indicates that North America and Europe currently dominate the market, benefiting from strong technological advancements and well-established research infrastructure. However, rapidly developing economies in the Asia-Pacific region, particularly China and India, are showing remarkable potential for growth, presenting lucrative opportunities for market players. The competitive landscape is marked by the presence of both established players and emerging companies, fostering innovation and competition within the molecular spectroscopy market.
Molecular Spectroscopy Market: A Comprehensive Report (2019-2033)
This detailed report provides a comprehensive analysis of the global Molecular Spectroscopy Market, offering in-depth insights into market dynamics, competitive landscape, and future growth prospects. The study period covers 2019-2033, with 2025 serving as the base and estimated year. The report is invaluable for industry stakeholders, investors, and researchers seeking to understand and capitalize on the opportunities within this rapidly evolving market. The market is projected to reach xx Million by 2033.
Molecular Spectroscopy Market Market Structure & Competitive Dynamics
The Molecular Spectroscopy Market is characterized by a moderately consolidated structure, with key players like Horiba Ltd, Bio-Rad Laboratories Inc, Merck KGaA, VIAVI Solutions Inc, Waters Corporation, Danaher Corporation, Agilent Technologies Inc, Thermo Fischer Scientific Inc, Jeol Ltd, Keit Ltd, PerkinElmer Inc, Thorlabs Inc, Bruker Corporation, and Shimadzu Corporation holding significant market share. Market concentration is influenced by factors such as technological advancements, regulatory compliance, and strategic mergers and acquisitions (M&A).
- Market Share: The top five players collectively account for approximately xx% of the global market share in 2025, with Thermo Fischer Scientific Inc holding the largest share at approximately xx%.
- Innovation Ecosystems: The market witnesses continuous innovation in both hardware and software, driven by the need for improved sensitivity, resolution, and automation. Collaboration between instrument manufacturers and software developers is a key trend.
- Regulatory Frameworks: Stringent regulatory approvals for medical and pharmaceutical applications significantly influence market growth, impacting the cost and timelines of product launches.
- Product Substitutes: Alternative analytical techniques, although limited, pose some competitive pressure, particularly in specific niche applications.
- End-User Trends: Growing demand for high-throughput screening and automation across various sectors is driving market expansion. The increasing focus on personalized medicine and precision diagnostics also contributes to the growth of this sector.
- M&A Activities: The past five years have witnessed several significant M&A activities, with deal values exceeding xx Million in total. These transactions have been driven by the desire to expand product portfolios, access new technologies, and enhance market reach. For example, the acquisition of [Company A] by [Company B] in [Year] expanded the market reach of [Company B].
Molecular Spectroscopy Market Industry Trends & Insights
The Molecular Spectroscopy Market is experiencing robust growth, driven by several key factors. The market is projected to exhibit a CAGR of xx% during the forecast period (2025-2033). This growth is primarily attributed to the increasing adoption of molecular spectroscopy techniques across diverse sectors such as pharmaceuticals, biotechnology, food and beverage, and environmental monitoring.
Technological advancements such as miniaturization, improved sensitivity, and the integration of artificial intelligence (AI) and machine learning (ML) algorithms are significantly impacting the market. The development of portable and handheld spectrometers is expanding the accessibility and usability of these techniques, particularly in remote or field-based applications. Furthermore, the growing demand for faster and more accurate analytical methods, coupled with stringent regulatory requirements for quality control and safety, is further driving market expansion. Market penetration of molecular spectroscopy techniques in emerging economies is also expected to increase significantly due to rising healthcare spending and infrastructural development. The competitive landscape is dynamic, characterized by both organic growth through product innovation and inorganic growth through strategic acquisitions and partnerships.
Dominant Markets & Segments in Molecular Spectroscopy Market
The Pharmaceutical Applications segment dominates the Molecular Spectroscopy Market, driven by the need for rigorous quality control and stringent regulatory compliance during drug development and manufacturing. North America currently holds the largest market share, followed by Europe, owing to the presence of well-established research institutions, pharmaceutical companies, and advanced healthcare infrastructure.
- Leading Regions/Countries: North America and Europe are leading the market due to established research infrastructure and high adoption rates. Asia-Pacific is projected to experience significant growth in the forecast period, fueled by increasing R&D spending and growing healthcare expenditure.
Dominant Segments:
- Type of Spectroscopy: Mass Spectroscopy and NMR Spectroscopy currently hold significant market shares due to their versatility and wide applicability in various sectors. However, Raman Spectroscopy and Infrared Spectroscopy are gaining traction due to advancements in technology and reduced costs.
- Application: Pharmaceutical Applications, Biotechnology and Biopharmaceutical Applications, and Food and Beverage Testing are the dominant application segments due to the critical role of quality control, safety, and regulatory compliance in these industries.
Key Drivers for Dominant Segments:
- Pharmaceutical Applications: Stringent regulatory requirements, focus on drug development and quality control.
- Biotechnology and Biopharmaceutical Applications: Growing need for high-throughput screening, proteomics, and genomics research.
- Food and Beverage Testing: Increasing consumer awareness of food safety and quality.
- North America Dominance: Well-established research institutions, advanced healthcare infrastructure, and significant government funding.
Molecular Spectroscopy Market Product Innovations
Recent product innovations include the development of compact and portable spectrometers with enhanced sensitivity and resolution. These advancements enable faster analysis, on-site testing capabilities, and reduced operational costs. Miniaturization techniques have made molecular spectroscopy techniques more accessible to diverse user groups, increasing overall market reach. Furthermore, integration of AI and ML algorithms is enhancing data analysis and providing more insightful results, accelerating the decision-making process across various applications. The development of user-friendly software interfaces is broadening the accessibility of these techniques to less technically skilled users.
Report Segmentation & Scope
This report segments the Molecular Spectroscopy Market based on Type of Spectroscopy (NMR Spectroscopy, Raman Spectroscopy, UV-visible Spectroscopy, Mass Spectroscopy, Infrared Spectroscopy, Near-infrared Spectroscopy, Other Types of Spectroscopy) and Application (Pharmaceutical Applications, Food and Beverage Testing, Biotechnology and Biopharmaceutical Applications, Environmental Testing, Academic Research, Other Applications). Each segment is analyzed based on market size, growth projections, and competitive dynamics, offering comprehensive insights into market trends and opportunities. The market size for each segment is projected to increase significantly over the forecast period, with considerable variation in growth rates across different segments. Competitive intensity varies across segments, influenced by the number of players, degree of innovation, and technological advancements.
Key Drivers of Molecular Spectroscopy Market Growth
Several factors contribute to the growth of the Molecular Spectroscopy Market. Technological advancements in instrument design and software analysis are critical drivers, resulting in increased sensitivity, speed, and ease of use. The growing demand for high-throughput screening across pharmaceutical and biotechnology sectors is a significant factor. Stringent regulatory guidelines in several industries mandate the use of molecular spectroscopy techniques, and the rising awareness of food safety and quality control further fuels market growth. Finally, increased government funding for research and development in academia and industry acts as a powerful stimulant for market expansion.
Challenges in the Molecular Spectroscopy Market Sector
The Molecular Spectroscopy Market faces certain challenges. High initial investment costs for advanced instruments can be a barrier to entry for smaller companies and research labs. The need for specialized expertise to operate and maintain sophisticated equipment presents an operational challenge. Competition from alternative analytical techniques and evolving regulatory landscapes pose continuous threats. The global supply chain disruptions impacting component availability have affected instrument production and delivery timelines. These factors, taken together, can lead to market instability and pricing volatility.
Leading Players in the Molecular Spectroscopy Market Market
- Horiba Ltd
- Bio-Rad Laboratories Inc
- Merck KGaA
- VIAVI Solutions Inc
- Waters Corporation
- Danaher Corporation
- Agilent Technologies Inc
- Thermo Fischer Scientific Inc
- Jeol Ltd
- Keit Ltd
- PerkinElmer Inc
- Thorlabs Inc
- Bruker Corporation
- Shimadzu Corporation
Key Developments in Molecular Spectroscopy Market Sector
- October 2022: Bruker Corporation launched a new high-resolution mass spectrometer, expanding its product portfolio in the life sciences sector.
- June 2023: Thermo Fisher Scientific acquired a smaller molecular spectroscopy company, strengthening its position in the market.
- February 2024: Agilent Technologies introduced a new software suite for improved data analysis and interpretation, enhancing user experience and data insights. (Note: These are examples. The actual dates and specifics will need to be updated with real market data.)
Strategic Molecular Spectroscopy Market Market Outlook
The Molecular Spectroscopy Market holds significant potential for future growth, driven by continuous technological innovations, increasing applications in various sectors, and a rising demand for high-throughput screening and advanced analytics. Strategic opportunities exist for companies that can develop innovative solutions, adapt to evolving regulatory landscapes, and offer cost-effective and user-friendly products. Focus on developing portable and user-friendly instruments, integrating advanced software capabilities, and expanding into emerging markets will be key to gaining a competitive edge. The market is poised for strong growth driven by advancements in technology and increased demand for precise analytical solutions across diverse sectors.
Molecular Spectroscopy Market Segmentation
-
1. Type of Spectroscopy
- 1.1. NMR Spectroscopy
- 1.2. Raman Spectroscopy
- 1.3. UV-visible Spectroscopy
- 1.4. Mass Spectroscopy
- 1.5. Infrared Spectroscopy
- 1.6. Near-infrared Spectroscopy
- 1.7. Other Types of Spectroscopy
-
2. Application
- 2.1. Pharmaceutical Applications
- 2.2. Food and Beverage Testing
- 2.3. Biotechnology and Biopharmaceutical Applications
- 2.4. Environmental Testing
- 2.5. Academic Research
- 2.6. Other Applications
Molecular Spectroscopy Market Segmentation By Geography
-
1. North America
- 1.1. United States
- 1.2. Canada
- 1.3. Mexico
-
2. Europe
- 2.1. Germany
- 2.2. United Kingdom
- 2.3. France
- 2.4. Italy
- 2.5. Spain
- 2.6. Rest of Europe
-
3. Asia Pacific
- 3.1. China
- 3.2. Japan
- 3.3. India
- 3.4. Australia
- 3.5. South Korea
- 3.6. Rest of Asia Pacific
-
4. Middle East and Africa
- 4.1. GCC
- 4.2. South Africa
- 4.3. Rest of Middle East and Africa
-
5. South America
- 5.1. Brazil
- 5.2. Argentina
- 5.3. Rest of South America
Molecular Spectroscopy Market REPORT HIGHLIGHTS
| Aspects | Details |
|---|---|
| Study Period | 2019-2033 |
| Base Year | 2024 |
| Estimated Year | 2025 |
| Forecast Period | 2025-2033 |
| Historical Period | 2019-2024 |
| Growth Rate | CAGR of 3.72% from 2019-2033 |
| Segmentation |
|
Table of Contents
- 1. Introduction
- 1.1. Research Scope
- 1.2. Market Segmentation
- 1.3. Research Methodology
- 1.4. Definitions and Assumptions
- 2. Executive Summary
- 2.1. Introduction
- 3. Market Dynamics
- 3.1. Introduction
- 3.2. Market Drivers
- 3.2.1. Rapid Adoption in the Pharmaceutical Industry; Penetration of MS Technology in Various Verticals; Increased Emphasis for Discovery of Newer Molecules by Pharmaceuticals
- 3.3. Market Restrains
- 3.3.1. High Cost of Maintenance and Installation Charges; Need of Technically Skilled Personnel
- 3.4. Market Trends
- 3.4.1. The NMR Spectroscopy Segment is Expected to Observe Good Growth Over the Forecast Period
- 4. Market Factor Analysis
- 4.1. Porters Five Forces
- 4.2. Supply/Value Chain
- 4.3. PESTEL analysis
- 4.4. Market Entropy
- 4.5. Patent/Trademark Analysis
- 5. Global Molecular Spectroscopy Market Analysis, Insights and Forecast, 2019-2031
- 5.1. Market Analysis, Insights and Forecast - by Type of Spectroscopy
- 5.1.1. NMR Spectroscopy
- 5.1.2. Raman Spectroscopy
- 5.1.3. UV-visible Spectroscopy
- 5.1.4. Mass Spectroscopy
- 5.1.5. Infrared Spectroscopy
- 5.1.6. Near-infrared Spectroscopy
- 5.1.7. Other Types of Spectroscopy
- 5.2. Market Analysis, Insights and Forecast - by Application
- 5.2.1. Pharmaceutical Applications
- 5.2.2. Food and Beverage Testing
- 5.2.3. Biotechnology and Biopharmaceutical Applications
- 5.2.4. Environmental Testing
- 5.2.5. Academic Research
- 5.2.6. Other Applications
- 5.3. Market Analysis, Insights and Forecast - by Region
- 5.3.1. North America
- 5.3.2. Europe
- 5.3.3. Asia Pacific
- 5.3.4. Middle East and Africa
- 5.3.5. South America
- 5.1. Market Analysis, Insights and Forecast - by Type of Spectroscopy
- 6. North America Molecular Spectroscopy Market Analysis, Insights and Forecast, 2019-2031
- 6.1. Market Analysis, Insights and Forecast - by Type of Spectroscopy
- 6.1.1. NMR Spectroscopy
- 6.1.2. Raman Spectroscopy
- 6.1.3. UV-visible Spectroscopy
- 6.1.4. Mass Spectroscopy
- 6.1.5. Infrared Spectroscopy
- 6.1.6. Near-infrared Spectroscopy
- 6.1.7. Other Types of Spectroscopy
- 6.2. Market Analysis, Insights and Forecast - by Application
- 6.2.1. Pharmaceutical Applications
- 6.2.2. Food and Beverage Testing
- 6.2.3. Biotechnology and Biopharmaceutical Applications
- 6.2.4. Environmental Testing
- 6.2.5. Academic Research
- 6.2.6. Other Applications
- 6.1. Market Analysis, Insights and Forecast - by Type of Spectroscopy
- 7. Europe Molecular Spectroscopy Market Analysis, Insights and Forecast, 2019-2031
- 7.1. Market Analysis, Insights and Forecast - by Type of Spectroscopy
- 7.1.1. NMR Spectroscopy
- 7.1.2. Raman Spectroscopy
- 7.1.3. UV-visible Spectroscopy
- 7.1.4. Mass Spectroscopy
- 7.1.5. Infrared Spectroscopy
- 7.1.6. Near-infrared Spectroscopy
- 7.1.7. Other Types of Spectroscopy
- 7.2. Market Analysis, Insights and Forecast - by Application
- 7.2.1. Pharmaceutical Applications
- 7.2.2. Food and Beverage Testing
- 7.2.3. Biotechnology and Biopharmaceutical Applications
- 7.2.4. Environmental Testing
- 7.2.5. Academic Research
- 7.2.6. Other Applications
- 7.1. Market Analysis, Insights and Forecast - by Type of Spectroscopy
- 8. Asia Pacific Molecular Spectroscopy Market Analysis, Insights and Forecast, 2019-2031
- 8.1. Market Analysis, Insights and Forecast - by Type of Spectroscopy
- 8.1.1. NMR Spectroscopy
- 8.1.2. Raman Spectroscopy
- 8.1.3. UV-visible Spectroscopy
- 8.1.4. Mass Spectroscopy
- 8.1.5. Infrared Spectroscopy
- 8.1.6. Near-infrared Spectroscopy
- 8.1.7. Other Types of Spectroscopy
- 8.2. Market Analysis, Insights and Forecast - by Application
- 8.2.1. Pharmaceutical Applications
- 8.2.2. Food and Beverage Testing
- 8.2.3. Biotechnology and Biopharmaceutical Applications
- 8.2.4. Environmental Testing
- 8.2.5. Academic Research
- 8.2.6. Other Applications
- 8.1. Market Analysis, Insights and Forecast - by Type of Spectroscopy
- 9. Middle East and Africa Molecular Spectroscopy Market Analysis, Insights and Forecast, 2019-2031
- 9.1. Market Analysis, Insights and Forecast - by Type of Spectroscopy
- 9.1.1. NMR Spectroscopy
- 9.1.2. Raman Spectroscopy
- 9.1.3. UV-visible Spectroscopy
- 9.1.4. Mass Spectroscopy
- 9.1.5. Infrared Spectroscopy
- 9.1.6. Near-infrared Spectroscopy
- 9.1.7. Other Types of Spectroscopy
- 9.2. Market Analysis, Insights and Forecast - by Application
- 9.2.1. Pharmaceutical Applications
- 9.2.2. Food and Beverage Testing
- 9.2.3. Biotechnology and Biopharmaceutical Applications
- 9.2.4. Environmental Testing
- 9.2.5. Academic Research
- 9.2.6. Other Applications
- 9.1. Market Analysis, Insights and Forecast - by Type of Spectroscopy
- 10. South America Molecular Spectroscopy Market Analysis, Insights and Forecast, 2019-2031
- 10.1. Market Analysis, Insights and Forecast - by Type of Spectroscopy
- 10.1.1. NMR Spectroscopy
- 10.1.2. Raman Spectroscopy
- 10.1.3. UV-visible Spectroscopy
- 10.1.4. Mass Spectroscopy
- 10.1.5. Infrared Spectroscopy
- 10.1.6. Near-infrared Spectroscopy
- 10.1.7. Other Types of Spectroscopy
- 10.2. Market Analysis, Insights and Forecast - by Application
- 10.2.1. Pharmaceutical Applications
- 10.2.2. Food and Beverage Testing
- 10.2.3. Biotechnology and Biopharmaceutical Applications
- 10.2.4. Environmental Testing
- 10.2.5. Academic Research
- 10.2.6. Other Applications
- 10.1. Market Analysis, Insights and Forecast - by Type of Spectroscopy
- 11. North America Molecular Spectroscopy Market Analysis, Insights and Forecast, 2019-2031
- 11.1. Market Analysis, Insights and Forecast - By Country/Sub-region
- 11.1.1 United States
- 11.1.2 Canada
- 11.1.3 Mexico
- 12. Europe Molecular Spectroscopy Market Analysis, Insights and Forecast, 2019-2031
- 12.1. Market Analysis, Insights and Forecast - By Country/Sub-region
- 12.1.1 Germany
- 12.1.2 United Kingdom
- 12.1.3 France
- 12.1.4 Italy
- 12.1.5 Spain
- 12.1.6 Rest of Europe
- 13. Asia Pacific Molecular Spectroscopy Market Analysis, Insights and Forecast, 2019-2031
- 13.1. Market Analysis, Insights and Forecast - By Country/Sub-region
- 13.1.1 China
- 13.1.2 Japan
- 13.1.3 India
- 13.1.4 Australia
- 13.1.5 South Korea
- 13.1.6 Rest of Asia Pacific
- 14. Middle East and Africa Molecular Spectroscopy Market Analysis, Insights and Forecast, 2019-2031
- 14.1. Market Analysis, Insights and Forecast - By Country/Sub-region
- 14.1.1 GCC
- 14.1.2 South Africa
- 14.1.3 Rest of Middle East and Africa
- 15. South America Molecular Spectroscopy Market Analysis, Insights and Forecast, 2019-2031
- 15.1. Market Analysis, Insights and Forecast - By Country/Sub-region
- 15.1.1 Brazil
- 15.1.2 Argentina
- 15.1.3 Rest of South America
- 16. Competitive Analysis
- 16.1. Global Market Share Analysis 2024
- 16.2. Company Profiles
- 16.2.1 Horiba Ltd
- 16.2.1.1. Overview
- 16.2.1.2. Products
- 16.2.1.3. SWOT Analysis
- 16.2.1.4. Recent Developments
- 16.2.1.5. Financials (Based on Availability)
- 16.2.2 Bio-Rad Laboratories Inc
- 16.2.2.1. Overview
- 16.2.2.2. Products
- 16.2.2.3. SWOT Analysis
- 16.2.2.4. Recent Developments
- 16.2.2.5. Financials (Based on Availability)
- 16.2.3 Merck KGaA
- 16.2.3.1. Overview
- 16.2.3.2. Products
- 16.2.3.3. SWOT Analysis
- 16.2.3.4. Recent Developments
- 16.2.3.5. Financials (Based on Availability)
- 16.2.4 VIAVI Solutions Inc
- 16.2.4.1. Overview
- 16.2.4.2. Products
- 16.2.4.3. SWOT Analysis
- 16.2.4.4. Recent Developments
- 16.2.4.5. Financials (Based on Availability)
- 16.2.5 Waters Corporation
- 16.2.5.1. Overview
- 16.2.5.2. Products
- 16.2.5.3. SWOT Analysis
- 16.2.5.4. Recent Developments
- 16.2.5.5. Financials (Based on Availability)
- 16.2.6 Danaher Corporation
- 16.2.6.1. Overview
- 16.2.6.2. Products
- 16.2.6.3. SWOT Analysis
- 16.2.6.4. Recent Developments
- 16.2.6.5. Financials (Based on Availability)
- 16.2.7 Agilent Technologies Inc
- 16.2.7.1. Overview
- 16.2.7.2. Products
- 16.2.7.3. SWOT Analysis
- 16.2.7.4. Recent Developments
- 16.2.7.5. Financials (Based on Availability)
- 16.2.8 Thermo Fischer Scientific Inc
- 16.2.8.1. Overview
- 16.2.8.2. Products
- 16.2.8.3. SWOT Analysis
- 16.2.8.4. Recent Developments
- 16.2.8.5. Financials (Based on Availability)
- 16.2.9 Jeol Ltd
- 16.2.9.1. Overview
- 16.2.9.2. Products
- 16.2.9.3. SWOT Analysis
- 16.2.9.4. Recent Developments
- 16.2.9.5. Financials (Based on Availability)
- 16.2.10 Keit Ltd
- 16.2.10.1. Overview
- 16.2.10.2. Products
- 16.2.10.3. SWOT Analysis
- 16.2.10.4. Recent Developments
- 16.2.10.5. Financials (Based on Availability)
- 16.2.11 PerkinElmer Inc
- 16.2.11.1. Overview
- 16.2.11.2. Products
- 16.2.11.3. SWOT Analysis
- 16.2.11.4. Recent Developments
- 16.2.11.5. Financials (Based on Availability)
- 16.2.12 Thorlabs Inc
- 16.2.12.1. Overview
- 16.2.12.2. Products
- 16.2.12.3. SWOT Analysis
- 16.2.12.4. Recent Developments
- 16.2.12.5. Financials (Based on Availability)
- 16.2.13 Bruker Corporation
- 16.2.13.1. Overview
- 16.2.13.2. Products
- 16.2.13.3. SWOT Analysis
- 16.2.13.4. Recent Developments
- 16.2.13.5. Financials (Based on Availability)
- 16.2.14 Shimadzu Corporation
- 16.2.14.1. Overview
- 16.2.14.2. Products
- 16.2.14.3. SWOT Analysis
- 16.2.14.4. Recent Developments
- 16.2.14.5. Financials (Based on Availability)
- 16.2.1 Horiba Ltd
List of Figures
- Figure 1: Global Molecular Spectroscopy Market Revenue Breakdown (Million, %) by Region 2024 & 2032
- Figure 2: Global Molecular Spectroscopy Market Volume Breakdown (K Unit, %) by Region 2024 & 2032
- Figure 3: North America Molecular Spectroscopy Market Revenue (Million), by Country 2024 & 2032
- Figure 4: North America Molecular Spectroscopy Market Volume (K Unit), by Country 2024 & 2032
- Figure 5: North America Molecular Spectroscopy Market Revenue Share (%), by Country 2024 & 2032
- Figure 6: North America Molecular Spectroscopy Market Volume Share (%), by Country 2024 & 2032
- Figure 7: Europe Molecular Spectroscopy Market Revenue (Million), by Country 2024 & 2032
- Figure 8: Europe Molecular Spectroscopy Market Volume (K Unit), by Country 2024 & 2032
- Figure 9: Europe Molecular Spectroscopy Market Revenue Share (%), by Country 2024 & 2032
- Figure 10: Europe Molecular Spectroscopy Market Volume Share (%), by Country 2024 & 2032
- Figure 11: Asia Pacific Molecular Spectroscopy Market Revenue (Million), by Country 2024 & 2032
- Figure 12: Asia Pacific Molecular Spectroscopy Market Volume (K Unit), by Country 2024 & 2032
- Figure 13: Asia Pacific Molecular Spectroscopy Market Revenue Share (%), by Country 2024 & 2032
- Figure 14: Asia Pacific Molecular Spectroscopy Market Volume Share (%), by Country 2024 & 2032
- Figure 15: Middle East and Africa Molecular Spectroscopy Market Revenue (Million), by Country 2024 & 2032
- Figure 16: Middle East and Africa Molecular Spectroscopy Market Volume (K Unit), by Country 2024 & 2032
- Figure 17: Middle East and Africa Molecular Spectroscopy Market Revenue Share (%), by Country 2024 & 2032
- Figure 18: Middle East and Africa Molecular Spectroscopy Market Volume Share (%), by Country 2024 & 2032
- Figure 19: South America Molecular Spectroscopy Market Revenue (Million), by Country 2024 & 2032
- Figure 20: South America Molecular Spectroscopy Market Volume (K Unit), by Country 2024 & 2032
- Figure 21: South America Molecular Spectroscopy Market Revenue Share (%), by Country 2024 & 2032
- Figure 22: South America Molecular Spectroscopy Market Volume Share (%), by Country 2024 & 2032
- Figure 23: North America Molecular Spectroscopy Market Revenue (Million), by Type of Spectroscopy 2024 & 2032
- Figure 24: North America Molecular Spectroscopy Market Volume (K Unit), by Type of Spectroscopy 2024 & 2032
- Figure 25: North America Molecular Spectroscopy Market Revenue Share (%), by Type of Spectroscopy 2024 & 2032
- Figure 26: North America Molecular Spectroscopy Market Volume Share (%), by Type of Spectroscopy 2024 & 2032
- Figure 27: North America Molecular Spectroscopy Market Revenue (Million), by Application 2024 & 2032
- Figure 28: North America Molecular Spectroscopy Market Volume (K Unit), by Application 2024 & 2032
- Figure 29: North America Molecular Spectroscopy Market Revenue Share (%), by Application 2024 & 2032
- Figure 30: North America Molecular Spectroscopy Market Volume Share (%), by Application 2024 & 2032
- Figure 31: North America Molecular Spectroscopy Market Revenue (Million), by Country 2024 & 2032
- Figure 32: North America Molecular Spectroscopy Market Volume (K Unit), by Country 2024 & 2032
- Figure 33: North America Molecular Spectroscopy Market Revenue Share (%), by Country 2024 & 2032
- Figure 34: North America Molecular Spectroscopy Market Volume Share (%), by Country 2024 & 2032
- Figure 35: Europe Molecular Spectroscopy Market Revenue (Million), by Type of Spectroscopy 2024 & 2032
- Figure 36: Europe Molecular Spectroscopy Market Volume (K Unit), by Type of Spectroscopy 2024 & 2032
- Figure 37: Europe Molecular Spectroscopy Market Revenue Share (%), by Type of Spectroscopy 2024 & 2032
- Figure 38: Europe Molecular Spectroscopy Market Volume Share (%), by Type of Spectroscopy 2024 & 2032
- Figure 39: Europe Molecular Spectroscopy Market Revenue (Million), by Application 2024 & 2032
- Figure 40: Europe Molecular Spectroscopy Market Volume (K Unit), by Application 2024 & 2032
- Figure 41: Europe Molecular Spectroscopy Market Revenue Share (%), by Application 2024 & 2032
- Figure 42: Europe Molecular Spectroscopy Market Volume Share (%), by Application 2024 & 2032
- Figure 43: Europe Molecular Spectroscopy Market Revenue (Million), by Country 2024 & 2032
- Figure 44: Europe Molecular Spectroscopy Market Volume (K Unit), by Country 2024 & 2032
- Figure 45: Europe Molecular Spectroscopy Market Revenue Share (%), by Country 2024 & 2032
- Figure 46: Europe Molecular Spectroscopy Market Volume Share (%), by Country 2024 & 2032
- Figure 47: Asia Pacific Molecular Spectroscopy Market Revenue (Million), by Type of Spectroscopy 2024 & 2032
- Figure 48: Asia Pacific Molecular Spectroscopy Market Volume (K Unit), by Type of Spectroscopy 2024 & 2032
- Figure 49: Asia Pacific Molecular Spectroscopy Market Revenue Share (%), by Type of Spectroscopy 2024 & 2032
- Figure 50: Asia Pacific Molecular Spectroscopy Market Volume Share (%), by Type of Spectroscopy 2024 & 2032
- Figure 51: Asia Pacific Molecular Spectroscopy Market Revenue (Million), by Application 2024 & 2032
- Figure 52: Asia Pacific Molecular Spectroscopy Market Volume (K Unit), by Application 2024 & 2032
- Figure 53: Asia Pacific Molecular Spectroscopy Market Revenue Share (%), by Application 2024 & 2032
- Figure 54: Asia Pacific Molecular Spectroscopy Market Volume Share (%), by Application 2024 & 2032
- Figure 55: Asia Pacific Molecular Spectroscopy Market Revenue (Million), by Country 2024 & 2032
- Figure 56: Asia Pacific Molecular Spectroscopy Market Volume (K Unit), by Country 2024 & 2032
- Figure 57: Asia Pacific Molecular Spectroscopy Market Revenue Share (%), by Country 2024 & 2032
- Figure 58: Asia Pacific Molecular Spectroscopy Market Volume Share (%), by Country 2024 & 2032
- Figure 59: Middle East and Africa Molecular Spectroscopy Market Revenue (Million), by Type of Spectroscopy 2024 & 2032
- Figure 60: Middle East and Africa Molecular Spectroscopy Market Volume (K Unit), by Type of Spectroscopy 2024 & 2032
- Figure 61: Middle East and Africa Molecular Spectroscopy Market Revenue Share (%), by Type of Spectroscopy 2024 & 2032
- Figure 62: Middle East and Africa Molecular Spectroscopy Market Volume Share (%), by Type of Spectroscopy 2024 & 2032
- Figure 63: Middle East and Africa Molecular Spectroscopy Market Revenue (Million), by Application 2024 & 2032
- Figure 64: Middle East and Africa Molecular Spectroscopy Market Volume (K Unit), by Application 2024 & 2032
- Figure 65: Middle East and Africa Molecular Spectroscopy Market Revenue Share (%), by Application 2024 & 2032
- Figure 66: Middle East and Africa Molecular Spectroscopy Market Volume Share (%), by Application 2024 & 2032
- Figure 67: Middle East and Africa Molecular Spectroscopy Market Revenue (Million), by Country 2024 & 2032
- Figure 68: Middle East and Africa Molecular Spectroscopy Market Volume (K Unit), by Country 2024 & 2032
- Figure 69: Middle East and Africa Molecular Spectroscopy Market Revenue Share (%), by Country 2024 & 2032
- Figure 70: Middle East and Africa Molecular Spectroscopy Market Volume Share (%), by Country 2024 & 2032
- Figure 71: South America Molecular Spectroscopy Market Revenue (Million), by Type of Spectroscopy 2024 & 2032
- Figure 72: South America Molecular Spectroscopy Market Volume (K Unit), by Type of Spectroscopy 2024 & 2032
- Figure 73: South America Molecular Spectroscopy Market Revenue Share (%), by Type of Spectroscopy 2024 & 2032
- Figure 74: South America Molecular Spectroscopy Market Volume Share (%), by Type of Spectroscopy 2024 & 2032
- Figure 75: South America Molecular Spectroscopy Market Revenue (Million), by Application 2024 & 2032
- Figure 76: South America Molecular Spectroscopy Market Volume (K Unit), by Application 2024 & 2032
- Figure 77: South America Molecular Spectroscopy Market Revenue Share (%), by Application 2024 & 2032
- Figure 78: South America Molecular Spectroscopy Market Volume Share (%), by Application 2024 & 2032
- Figure 79: South America Molecular Spectroscopy Market Revenue (Million), by Country 2024 & 2032
- Figure 80: South America Molecular Spectroscopy Market Volume (K Unit), by Country 2024 & 2032
- Figure 81: South America Molecular Spectroscopy Market Revenue Share (%), by Country 2024 & 2032
- Figure 82: South America Molecular Spectroscopy Market Volume Share (%), by Country 2024 & 2032
List of Tables
- Table 1: Global Molecular Spectroscopy Market Revenue Million Forecast, by Region 2019 & 2032
- Table 2: Global Molecular Spectroscopy Market Volume K Unit Forecast, by Region 2019 & 2032
- Table 3: Global Molecular Spectroscopy Market Revenue Million Forecast, by Type of Spectroscopy 2019 & 2032
- Table 4: Global Molecular Spectroscopy Market Volume K Unit Forecast, by Type of Spectroscopy 2019 & 2032
- Table 5: Global Molecular Spectroscopy Market Revenue Million Forecast, by Application 2019 & 2032
- Table 6: Global Molecular Spectroscopy Market Volume K Unit Forecast, by Application 2019 & 2032
- Table 7: Global Molecular Spectroscopy Market Revenue Million Forecast, by Region 2019 & 2032
- Table 8: Global Molecular Spectroscopy Market Volume K Unit Forecast, by Region 2019 & 2032
- Table 9: Global Molecular Spectroscopy Market Revenue Million Forecast, by Country 2019 & 2032
- Table 10: Global Molecular Spectroscopy Market Volume K Unit Forecast, by Country 2019 & 2032
- Table 11: United States Molecular Spectroscopy Market Revenue (Million) Forecast, by Application 2019 & 2032
- Table 12: United States Molecular Spectroscopy Market Volume (K Unit) Forecast, by Application 2019 & 2032
- Table 13: Canada Molecular Spectroscopy Market Revenue (Million) Forecast, by Application 2019 & 2032
- Table 14: Canada Molecular Spectroscopy Market Volume (K Unit) Forecast, by Application 2019 & 2032
- Table 15: Mexico Molecular Spectroscopy Market Revenue (Million) Forecast, by Application 2019 & 2032
- Table 16: Mexico Molecular Spectroscopy Market Volume (K Unit) Forecast, by Application 2019 & 2032
- Table 17: Global Molecular Spectroscopy Market Revenue Million Forecast, by Country 2019 & 2032
- Table 18: Global Molecular Spectroscopy Market Volume K Unit Forecast, by Country 2019 & 2032
- Table 19: Germany Molecular Spectroscopy Market Revenue (Million) Forecast, by Application 2019 & 2032
- Table 20: Germany Molecular Spectroscopy Market Volume (K Unit) Forecast, by Application 2019 & 2032
- Table 21: United Kingdom Molecular Spectroscopy Market Revenue (Million) Forecast, by Application 2019 & 2032
- Table 22: United Kingdom Molecular Spectroscopy Market Volume (K Unit) Forecast, by Application 2019 & 2032
- Table 23: France Molecular Spectroscopy Market Revenue (Million) Forecast, by Application 2019 & 2032
- Table 24: France Molecular Spectroscopy Market Volume (K Unit) Forecast, by Application 2019 & 2032
- Table 25: Italy Molecular Spectroscopy Market Revenue (Million) Forecast, by Application 2019 & 2032
- Table 26: Italy Molecular Spectroscopy Market Volume (K Unit) Forecast, by Application 2019 & 2032
- Table 27: Spain Molecular Spectroscopy Market Revenue (Million) Forecast, by Application 2019 & 2032
- Table 28: Spain Molecular Spectroscopy Market Volume (K Unit) Forecast, by Application 2019 & 2032
- Table 29: Rest of Europe Molecular Spectroscopy Market Revenue (Million) Forecast, by Application 2019 & 2032
- Table 30: Rest of Europe Molecular Spectroscopy Market Volume (K Unit) Forecast, by Application 2019 & 2032
- Table 31: Global Molecular Spectroscopy Market Revenue Million Forecast, by Country 2019 & 2032
- Table 32: Global Molecular Spectroscopy Market Volume K Unit Forecast, by Country 2019 & 2032
- Table 33: China Molecular Spectroscopy Market Revenue (Million) Forecast, by Application 2019 & 2032
- Table 34: China Molecular Spectroscopy Market Volume (K Unit) Forecast, by Application 2019 & 2032
- Table 35: Japan Molecular Spectroscopy Market Revenue (Million) Forecast, by Application 2019 & 2032
- Table 36: Japan Molecular Spectroscopy Market Volume (K Unit) Forecast, by Application 2019 & 2032
- Table 37: India Molecular Spectroscopy Market Revenue (Million) Forecast, by Application 2019 & 2032
- Table 38: India Molecular Spectroscopy Market Volume (K Unit) Forecast, by Application 2019 & 2032
- Table 39: Australia Molecular Spectroscopy Market Revenue (Million) Forecast, by Application 2019 & 2032
- Table 40: Australia Molecular Spectroscopy Market Volume (K Unit) Forecast, by Application 2019 & 2032
- Table 41: South Korea Molecular Spectroscopy Market Revenue (Million) Forecast, by Application 2019 & 2032
- Table 42: South Korea Molecular Spectroscopy Market Volume (K Unit) Forecast, by Application 2019 & 2032
- Table 43: Rest of Asia Pacific Molecular Spectroscopy Market Revenue (Million) Forecast, by Application 2019 & 2032
- Table 44: Rest of Asia Pacific Molecular Spectroscopy Market Volume (K Unit) Forecast, by Application 2019 & 2032
- Table 45: Global Molecular Spectroscopy Market Revenue Million Forecast, by Country 2019 & 2032
- Table 46: Global Molecular Spectroscopy Market Volume K Unit Forecast, by Country 2019 & 2032
- Table 47: GCC Molecular Spectroscopy Market Revenue (Million) Forecast, by Application 2019 & 2032
- Table 48: GCC Molecular Spectroscopy Market Volume (K Unit) Forecast, by Application 2019 & 2032
- Table 49: South Africa Molecular Spectroscopy Market Revenue (Million) Forecast, by Application 2019 & 2032
- Table 50: South Africa Molecular Spectroscopy Market Volume (K Unit) Forecast, by Application 2019 & 2032
- Table 51: Rest of Middle East and Africa Molecular Spectroscopy Market Revenue (Million) Forecast, by Application 2019 & 2032
- Table 52: Rest of Middle East and Africa Molecular Spectroscopy Market Volume (K Unit) Forecast, by Application 2019 & 2032
- Table 53: Global Molecular Spectroscopy Market Revenue Million Forecast, by Country 2019 & 2032
- Table 54: Global Molecular Spectroscopy Market Volume K Unit Forecast, by Country 2019 & 2032
- Table 55: Brazil Molecular Spectroscopy Market Revenue (Million) Forecast, by Application 2019 & 2032
- Table 56: Brazil Molecular Spectroscopy Market Volume (K Unit) Forecast, by Application 2019 & 2032
- Table 57: Argentina Molecular Spectroscopy Market Revenue (Million) Forecast, by Application 2019 & 2032
- Table 58: Argentina Molecular Spectroscopy Market Volume (K Unit) Forecast, by Application 2019 & 2032
- Table 59: Rest of South America Molecular Spectroscopy Market Revenue (Million) Forecast, by Application 2019 & 2032
- Table 60: Rest of South America Molecular Spectroscopy Market Volume (K Unit) Forecast, by Application 2019 & 2032
- Table 61: Global Molecular Spectroscopy Market Revenue Million Forecast, by Type of Spectroscopy 2019 & 2032
- Table 62: Global Molecular Spectroscopy Market Volume K Unit Forecast, by Type of Spectroscopy 2019 & 2032
- Table 63: Global Molecular Spectroscopy Market Revenue Million Forecast, by Application 2019 & 2032
- Table 64: Global Molecular Spectroscopy Market Volume K Unit Forecast, by Application 2019 & 2032
- Table 65: Global Molecular Spectroscopy Market Revenue Million Forecast, by Country 2019 & 2032
- Table 66: Global Molecular Spectroscopy Market Volume K Unit Forecast, by Country 2019 & 2032
- Table 67: United States Molecular Spectroscopy Market Revenue (Million) Forecast, by Application 2019 & 2032
- Table 68: United States Molecular Spectroscopy Market Volume (K Unit) Forecast, by Application 2019 & 2032
- Table 69: Canada Molecular Spectroscopy Market Revenue (Million) Forecast, by Application 2019 & 2032
- Table 70: Canada Molecular Spectroscopy Market Volume (K Unit) Forecast, by Application 2019 & 2032
- Table 71: Mexico Molecular Spectroscopy Market Revenue (Million) Forecast, by Application 2019 & 2032
- Table 72: Mexico Molecular Spectroscopy Market Volume (K Unit) Forecast, by Application 2019 & 2032
- Table 73: Global Molecular Spectroscopy Market Revenue Million Forecast, by Type of Spectroscopy 2019 & 2032
- Table 74: Global Molecular Spectroscopy Market Volume K Unit Forecast, by Type of Spectroscopy 2019 & 2032
- Table 75: Global Molecular Spectroscopy Market Revenue Million Forecast, by Application 2019 & 2032
- Table 76: Global Molecular Spectroscopy Market Volume K Unit Forecast, by Application 2019 & 2032
- Table 77: Global Molecular Spectroscopy Market Revenue Million Forecast, by Country 2019 & 2032
- Table 78: Global Molecular Spectroscopy Market Volume K Unit Forecast, by Country 2019 & 2032
- Table 79: Germany Molecular Spectroscopy Market Revenue (Million) Forecast, by Application 2019 & 2032
- Table 80: Germany Molecular Spectroscopy Market Volume (K Unit) Forecast, by Application 2019 & 2032
- Table 81: United Kingdom Molecular Spectroscopy Market Revenue (Million) Forecast, by Application 2019 & 2032
- Table 82: United Kingdom Molecular Spectroscopy Market Volume (K Unit) Forecast, by Application 2019 & 2032
- Table 83: France Molecular Spectroscopy Market Revenue (Million) Forecast, by Application 2019 & 2032
- Table 84: France Molecular Spectroscopy Market Volume (K Unit) Forecast, by Application 2019 & 2032
- Table 85: Italy Molecular Spectroscopy Market Revenue (Million) Forecast, by Application 2019 & 2032
- Table 86: Italy Molecular Spectroscopy Market Volume (K Unit) Forecast, by Application 2019 & 2032
- Table 87: Spain Molecular Spectroscopy Market Revenue (Million) Forecast, by Application 2019 & 2032
- Table 88: Spain Molecular Spectroscopy Market Volume (K Unit) Forecast, by Application 2019 & 2032
- Table 89: Rest of Europe Molecular Spectroscopy Market Revenue (Million) Forecast, by Application 2019 & 2032
- Table 90: Rest of Europe Molecular Spectroscopy Market Volume (K Unit) Forecast, by Application 2019 & 2032
- Table 91: Global Molecular Spectroscopy Market Revenue Million Forecast, by Type of Spectroscopy 2019 & 2032
- Table 92: Global Molecular Spectroscopy Market Volume K Unit Forecast, by Type of Spectroscopy 2019 & 2032
- Table 93: Global Molecular Spectroscopy Market Revenue Million Forecast, by Application 2019 & 2032
- Table 94: Global Molecular Spectroscopy Market Volume K Unit Forecast, by Application 2019 & 2032
- Table 95: Global Molecular Spectroscopy Market Revenue Million Forecast, by Country 2019 & 2032
- Table 96: Global Molecular Spectroscopy Market Volume K Unit Forecast, by Country 2019 & 2032
- Table 97: China Molecular Spectroscopy Market Revenue (Million) Forecast, by Application 2019 & 2032
- Table 98: China Molecular Spectroscopy Market Volume (K Unit) Forecast, by Application 2019 & 2032
- Table 99: Japan Molecular Spectroscopy Market Revenue (Million) Forecast, by Application 2019 & 2032
- Table 100: Japan Molecular Spectroscopy Market Volume (K Unit) Forecast, by Application 2019 & 2032
- Table 101: India Molecular Spectroscopy Market Revenue (Million) Forecast, by Application 2019 & 2032
- Table 102: India Molecular Spectroscopy Market Volume (K Unit) Forecast, by Application 2019 & 2032
- Table 103: Australia Molecular Spectroscopy Market Revenue (Million) Forecast, by Application 2019 & 2032
- Table 104: Australia Molecular Spectroscopy Market Volume (K Unit) Forecast, by Application 2019 & 2032
- Table 105: South Korea Molecular Spectroscopy Market Revenue (Million) Forecast, by Application 2019 & 2032
- Table 106: South Korea Molecular Spectroscopy Market Volume (K Unit) Forecast, by Application 2019 & 2032
- Table 107: Rest of Asia Pacific Molecular Spectroscopy Market Revenue (Million) Forecast, by Application 2019 & 2032
- Table 108: Rest of Asia Pacific Molecular Spectroscopy Market Volume (K Unit) Forecast, by Application 2019 & 2032
- Table 109: Global Molecular Spectroscopy Market Revenue Million Forecast, by Type of Spectroscopy 2019 & 2032
- Table 110: Global Molecular Spectroscopy Market Volume K Unit Forecast, by Type of Spectroscopy 2019 & 2032
- Table 111: Global Molecular Spectroscopy Market Revenue Million Forecast, by Application 2019 & 2032
- Table 112: Global Molecular Spectroscopy Market Volume K Unit Forecast, by Application 2019 & 2032
- Table 113: Global Molecular Spectroscopy Market Revenue Million Forecast, by Country 2019 & 2032
- Table 114: Global Molecular Spectroscopy Market Volume K Unit Forecast, by Country 2019 & 2032
- Table 115: GCC Molecular Spectroscopy Market Revenue (Million) Forecast, by Application 2019 & 2032
- Table 116: GCC Molecular Spectroscopy Market Volume (K Unit) Forecast, by Application 2019 & 2032
- Table 117: South Africa Molecular Spectroscopy Market Revenue (Million) Forecast, by Application 2019 & 2032
- Table 118: South Africa Molecular Spectroscopy Market Volume (K Unit) Forecast, by Application 2019 & 2032
- Table 119: Rest of Middle East and Africa Molecular Spectroscopy Market Revenue (Million) Forecast, by Application 2019 & 2032
- Table 120: Rest of Middle East and Africa Molecular Spectroscopy Market Volume (K Unit) Forecast, by Application 2019 & 2032
- Table 121: Global Molecular Spectroscopy Market Revenue Million Forecast, by Type of Spectroscopy 2019 & 2032
- Table 122: Global Molecular Spectroscopy Market Volume K Unit Forecast, by Type of Spectroscopy 2019 & 2032
- Table 123: Global Molecular Spectroscopy Market Revenue Million Forecast, by Application 2019 & 2032
- Table 124: Global Molecular Spectroscopy Market Volume K Unit Forecast, by Application 2019 & 2032
- Table 125: Global Molecular Spectroscopy Market Revenue Million Forecast, by Country 2019 & 2032
- Table 126: Global Molecular Spectroscopy Market Volume K Unit Forecast, by Country 2019 & 2032
- Table 127: Brazil Molecular Spectroscopy Market Revenue (Million) Forecast, by Application 2019 & 2032
- Table 128: Brazil Molecular Spectroscopy Market Volume (K Unit) Forecast, by Application 2019 & 2032
- Table 129: Argentina Molecular Spectroscopy Market Revenue (Million) Forecast, by Application 2019 & 2032
- Table 130: Argentina Molecular Spectroscopy Market Volume (K Unit) Forecast, by Application 2019 & 2032
- Table 131: Rest of South America Molecular Spectroscopy Market Revenue (Million) Forecast, by Application 2019 & 2032
- Table 132: Rest of South America Molecular Spectroscopy Market Volume (K Unit) Forecast, by Application 2019 & 2032
Frequently Asked Questions
1. What is the projected Compound Annual Growth Rate (CAGR) of the Molecular Spectroscopy Market?
The projected CAGR is approximately 3.72%.
2. Which companies are prominent players in the Molecular Spectroscopy Market?
Key companies in the market include Horiba Ltd, Bio-Rad Laboratories Inc, Merck KGaA, VIAVI Solutions Inc, Waters Corporation, Danaher Corporation, Agilent Technologies Inc, Thermo Fischer Scientific Inc, Jeol Ltd, Keit Ltd, PerkinElmer Inc, Thorlabs Inc, Bruker Corporation, Shimadzu Corporation.
3. What are the main segments of the Molecular Spectroscopy Market?
The market segments include Type of Spectroscopy, Application.
4. Can you provide details about the market size?
The market size is estimated to be USD 2.87 Million as of 2022.
5. What are some drivers contributing to market growth?
Rapid Adoption in the Pharmaceutical Industry; Penetration of MS Technology in Various Verticals; Increased Emphasis for Discovery of Newer Molecules by Pharmaceuticals.
6. What are the notable trends driving market growth?
The NMR Spectroscopy Segment is Expected to Observe Good Growth Over the Forecast Period.
7. Are there any restraints impacting market growth?
High Cost of Maintenance and Installation Charges; Need of Technically Skilled Personnel.
8. Can you provide examples of recent developments in the market?
N/A
9. What pricing options are available for accessing the report?
Pricing options include single-user, multi-user, and enterprise licenses priced at USD 4750, USD 5250, and USD 8750 respectively.
10. Is the market size provided in terms of value or volume?
The market size is provided in terms of value, measured in Million and volume, measured in K Unit.
11. Are there any specific market keywords associated with the report?
Yes, the market keyword associated with the report is "Molecular Spectroscopy Market," which aids in identifying and referencing the specific market segment covered.
12. How do I determine which pricing option suits my needs best?
The pricing options vary based on user requirements and access needs. Individual users may opt for single-user licenses, while businesses requiring broader access may choose multi-user or enterprise licenses for cost-effective access to the report.
13. Are there any additional resources or data provided in the Molecular Spectroscopy Market report?
While the report offers comprehensive insights, it's advisable to review the specific contents or supplementary materials provided to ascertain if additional resources or data are available.
14. How can I stay updated on further developments or reports in the Molecular Spectroscopy Market?
To stay informed about further developments, trends, and reports in the Molecular Spectroscopy Market, consider subscribing to industry newsletters, following relevant companies and organizations, or regularly checking reputable industry news sources and publications.
Methodology
Step 1 - Identification of Relevant Samples Size from Population Database


Step 2 - Approaches for Defining Global Market Size (Value, Volume* & Price*)

Note*: In applicable scenarios
Step 3 - Data Sources
Primary Research
- Web Analytics
- Survey Reports
- Research Institute
- Latest Research Reports
- Opinion Leaders
Secondary Research
- Annual Reports
- White Paper
- Latest Press Release
- Industry Association
- Paid Database
- Investor Presentations

Step 4 - Data Triangulation
Involves using different sources of information in order to increase the validity of a study
These sources are likely to be stakeholders in a program - participants, other researchers, program staff, other community members, and so on.
Then we put all data in single framework & apply various statistical tools to find out the dynamic on the market.
During the analysis stage, feedback from the stakeholder groups would be compared to determine areas of agreement as well as areas of divergence


