
Key Insights
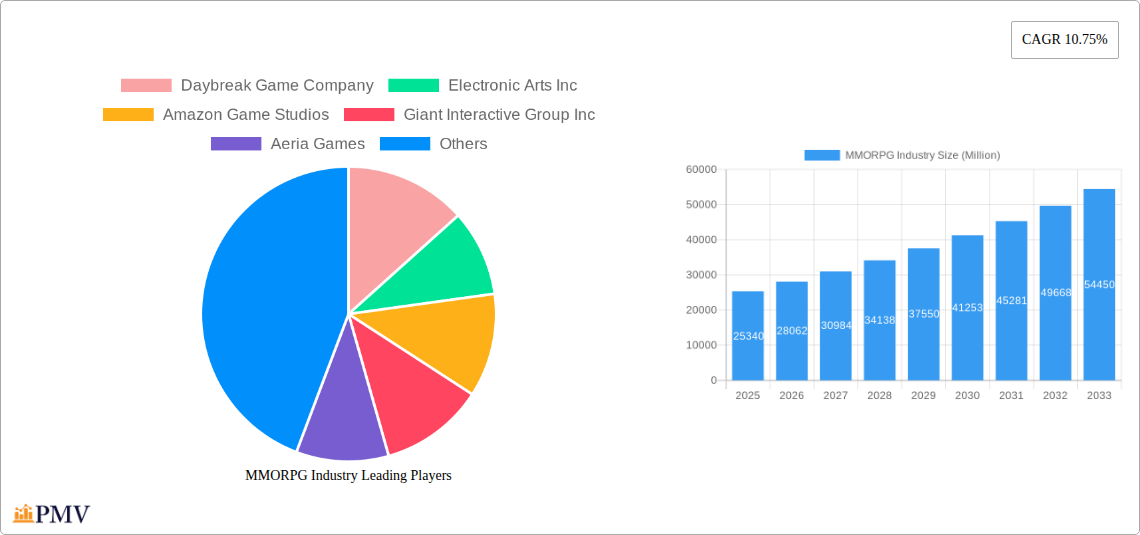
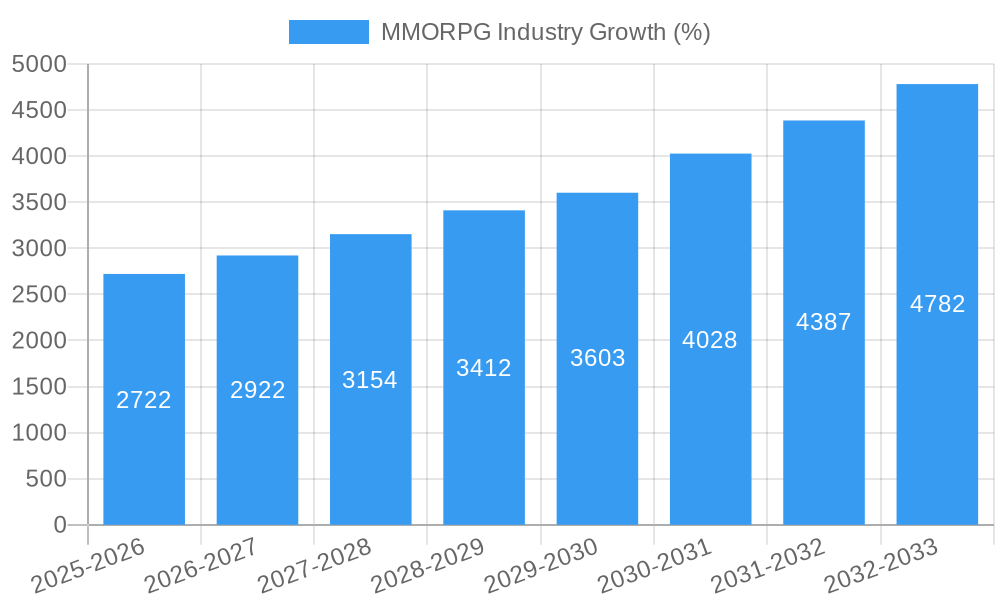
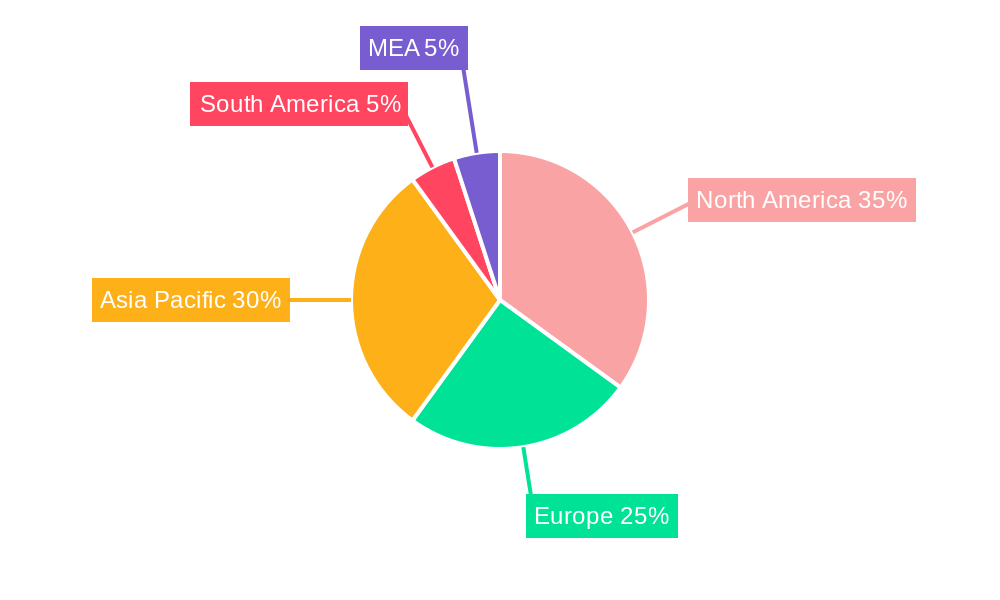
The MMORPG (Massively Multiplayer Online Role-Playing Game) industry is experiencing robust growth, projected to reach a market size of $25.34 billion in 2025, with a Compound Annual Growth Rate (CAGR) of 10.75%. This expansion is fueled by several key drivers. Firstly, the increasing accessibility of high-speed internet and mobile gaming technology allows a wider audience to participate. Secondly, the continuous evolution of game mechanics, incorporating elements such as enhanced graphics, engaging storylines, and social features, retains player interest and attracts new players. Finally, the rise of esports and streaming platforms elevates the visibility and appeal of MMORPGs, particularly among younger demographics. The mobile gaming segment is a major contributor to this growth, with its ease of access and portability attracting a significant player base. However, challenges remain; increasing development costs, intense competition from other game genres, and the potential for player burnout are factors that could moderate growth. Market segmentation reveals North America and Asia-Pacific as the leading regions, reflecting established gaming cultures and high internet penetration. The forecast period (2025-2033) anticipates continued growth, driven by ongoing technological advancements and innovative game designs.
The competitive landscape is highly fragmented, with key players like Tencent Holdings Limited, Activision Blizzard Inc., and NetEase Games Inc. leading the market. These established companies are investing heavily in research and development, aiming to maintain their market position through innovative game releases and strategic acquisitions. However, smaller, independent studios are also finding success by focusing on niche genres and delivering unique gaming experiences. The industry is likely to see increased consolidation in the coming years, as larger companies continue to acquire smaller studios to expand their portfolios and strengthen their market share. Regional variations in growth will likely persist, with regions boasting strong gaming communities and high internet penetration continuing to drive significant revenue. Furthermore, the integration of blockchain technology and metaverse concepts presents exciting opportunities for the future evolution of the MMORPG genre.
MMORPG Industry Market Report: 2019-2033
This comprehensive report provides a detailed analysis of the Massively Multiplayer Online Role-Playing Game (MMORPG) industry, covering the period from 2019 to 2033. With a focus on market structure, competitive dynamics, technological advancements, and future growth projections, this report is an essential resource for industry professionals, investors, and anyone seeking a deep understanding of this dynamic sector. The report includes detailed analysis of key players such as Daybreak Game Company, Electronic Arts Inc, Amazon Game Studios, Giant Interactive Group Inc, and many more. The study period covers 2019-2033, with 2025 as the base and estimated year, and a forecast period spanning 2025-2033.
MMORPG Industry Market Structure & Competitive Dynamics
The MMORPG market exhibits a moderately concentrated structure, with a few major players holding significant market share. However, the presence of numerous smaller, independent developers fosters innovation and competition. Market concentration is further influenced by ongoing mergers and acquisitions (M&A) activity, with deal values exceeding $XX billion in the past five years. Regulatory frameworks vary across regions, impacting market access and operations. Product substitution pressure arises from other gaming genres, such as battle royales and first-person shooters. End-user trends show a growing preference for cross-platform compatibility and immersive gameplay experiences.
- Market Concentration: Top 5 players hold approximately XX% of the market share (2024).
- M&A Activity: XX major deals valued at over $XX Million in 2019-2024.
- Innovation Ecosystems: Significant R&D investment drives continuous innovation in graphics, gameplay mechanics, and monetization strategies.
- Regulatory Frameworks: Vary significantly by region, affecting game content and monetization models.
- Product Substitutes: Competition from other gaming genres presents a significant challenge.
- End-User Trends: Demand for cross-platform play and immersive experiences is increasing.
MMORPG Industry Industry Trends & Insights
The MMORPG industry is experiencing robust growth, driven by increasing smartphone penetration, the rise of esports, and the expanding popularity of free-to-play models. The Compound Annual Growth Rate (CAGR) for the period 2025-2033 is estimated at XX%. Technological disruptions, such as the integration of blockchain technology and the metaverse, are reshaping the industry landscape. Consumer preferences are shifting towards more social and collaborative gaming experiences, influencing game design and development. Competitive dynamics are characterized by intense competition for player attention and market share. The market penetration of MMORPGs is expected to reach XX% globally by 2033.
Dominant Markets & Segments in MMORPG Industry
The mobile segment currently dominates the MMORPG market, driven by widespread smartphone adoption and accessibility. Key drivers for mobile MMORPG dominance include:
- High Smartphone Penetration: Widespread smartphone ownership provides significant market access.
- Accessibility and Portability: Mobile gaming offers unparalleled convenience and accessibility.
- Lower Barrier to Entry: Free-to-play models reduce the financial barrier for entry.
While the mobile segment is dominant, the PC segment retains a substantial market share, with dedicated players appreciating high-fidelity graphics and extensive customization options. The console market shows modest growth, with several high-profile MMORPG titles achieving success. Tablet gaming also contributes to the overall market, but its growth is slower compared to mobile.
MMORPG Industry Product Innovations
Recent years have witnessed significant advancements in MMORPG game design, including improved graphics, enhanced social features, and innovative monetization strategies. The integration of blockchain technology has introduced web3-native MMORPGs offering decentralized gameplay and ownership. This reflects a broader trend towards immersive, player-driven experiences, shaping the future of the MMORPG landscape. The focus is shifting towards creating engaging narratives and dynamic gameplay loops to retain players.
Report Segmentation & Scope
This report segments the MMORPG market based on gaming platforms:
Mobile: This segment represents the largest share of the market, driven by high smartphone penetration. Growth is projected at XX% CAGR (2025-2033). The competitive landscape is highly fragmented, with numerous developers vying for market share.
Tablet: While smaller than the mobile segment, the tablet market offers a significant user base for MMORPGs. Growth is expected to be moderate, at a CAGR of XX%. Competition is less intense than in the mobile segment.
Gaming Console: This segment represents a notable portion of the MMORPG market, with key titles achieving considerable success. Growth is projected at XX% CAGR (2025-2033). The competitive landscape is dominated by established publishers.
PC: The PC segment retains a strong, dedicated player base, appreciating superior graphics and gameplay. Growth is expected to be steady, with a CAGR of XX%. Competition is robust, with both established and independent developers.
Key Drivers of MMORPG Industry Growth
Several key factors contribute to the growth of the MMORPG industry:
Technological Advancements: Improved graphics, enhanced gameplay mechanics, and cross-platform compatibility drive market growth.
Increasing Smartphone Penetration: Widespread smartphone adoption increases accessibility and market size.
Rise of Esports: The growth of competitive gaming fosters increased player engagement and revenue generation.
Free-to-Play Model Adoption: This monetization model expands market access and player base significantly.
Challenges in the MMORPG Industry Sector
The MMORPG industry faces certain challenges, including:
High Development Costs: Creating high-quality MMORPGs necessitates substantial financial investment.
Intense Competition: The market is highly competitive, requiring developers to constantly innovate to maintain player engagement.
Maintaining Player Retention: Retaining players in the long term is crucial for sustainability. High churn rates represent a significant financial challenge.
Leading Players in the MMORPG Industry Market
- Daybreak Game Company
- Electronic Arts Inc
- Amazon Game Studios
- Giant Interactive Group Inc
- Aeria Games
- CCP games UK Ltd
- NCSOFT Corporation
- Activision Blizzard Inc
- Neteasegames Inc
- Tencent Holdings Limited
- Bright Star Studios
- Ubisoft Entertainment SA
- Jagex Limited
- Gravity Corporatio
- Nexon Co Ltd
Key Developments in MMORPG Industry Sector
May 2022: Gravity Co Ltd launched 'Ragnarok V: Returns,' a cross-platform 3D MMORPG. This significantly broadened the game's reach and potential player base.
June 2022: Clockwork Labs secured USD 22 Million in funding for its MMORPG, BitCraft. This signifies investor confidence in the community-focused sandbox MMORPG genre.
September 2022: ThumbAge released Dekaron G, a mobile MMORPG, expanding the reach of the Dekaron franchise to a global audience. This demonstrates the success of established IPs in the mobile gaming market.
January 2023: The launch of Animera on ImmutableX showcases the growing integration of web3 technology into the MMORPG space. This signifies the potential for new monetization models and increased player engagement.
Strategic MMORPG Industry Market Outlook
The future of the MMORPG industry looks promising. Continued technological innovation, the expansion of mobile gaming, and the integration of emerging technologies like Web3 and metaverse will drive substantial growth. Strategic opportunities lie in developing innovative gameplay mechanics, fostering community engagement, and leveraging emerging technologies to create immersive and engaging experiences. The focus will be on delivering high-quality, player-centric experiences across multiple platforms, ensuring long-term growth and market leadership.
MMORPG Industry Segmentation
-
1. Gaming Platform
- 1.1. Mobile
- 1.2. Tablet
- 1.3. Gaming Console
- 1.4. PC
MMORPG Industry Segmentation By Geography
-
1. North America
- 1.1. United States
- 1.2. Canada
-
2. Europe
- 2.1. United Kingdom
- 2.2. Germany
- 2.3. France
- 2.4. Italy
- 2.5. Russia
-
3. Asia
- 3.1. China
- 3.2. India
- 3.3. Japan
- 3.4. South Korea
- 4. Australia and New Zealand
-
5. Latin America
- 5.1. Brazil
- 5.2. Mexico
- 5.3. Argentina
-
6. Middle East and Africa
- 6.1. United Arab Emirates
- 6.2. Saudi Arabia
- 6.3. South Africa
MMORPG Industry REPORT HIGHLIGHTS
| Aspects | Details |
|---|---|
| Study Period | 2019-2033 |
| Base Year | 2024 |
| Estimated Year | 2025 |
| Forecast Period | 2025-2033 |
| Historical Period | 2019-2024 |
| Growth Rate | CAGR of 10.75% from 2019-2033 |
| Segmentation |
|
Table of Contents
- 1. Introduction
- 1.1. Research Scope
- 1.2. Market Segmentation
- 1.3. Research Methodology
- 1.4. Definitions and Assumptions
- 2. Executive Summary
- 2.1. Introduction
- 3. Market Dynamics
- 3.1. Introduction
- 3.2. Market Drivers
- 3.2.1 Rising Smartphone Penetration and Increasing Penetration of Internet among Developing Economies; Technological Advancement such as IoT
- 3.2.2 AR
- 3.2.3 and VR; Emergence of Gamification
- 3.3. Market Restrains
- 3.3.1 Costs
- 3.3.2 Interoperability
- 3.3.3 and Security Concerns
- 3.4. Market Trends
- 3.4.1. Rising Smartphone Penetration and Increasing Penetration of Internet among Developing Economies may Drive the Market Growth
- 4. Market Factor Analysis
- 4.1. Porters Five Forces
- 4.2. Supply/Value Chain
- 4.3. PESTEL analysis
- 4.4. Market Entropy
- 4.5. Patent/Trademark Analysis
- 5. Global MMORPG Industry Analysis, Insights and Forecast, 2019-2031
- 5.1. Market Analysis, Insights and Forecast - by Gaming Platform
- 5.1.1. Mobile
- 5.1.2. Tablet
- 5.1.3. Gaming Console
- 5.1.4. PC
- 5.2. Market Analysis, Insights and Forecast - by Region
- 5.2.1. North America
- 5.2.2. Europe
- 5.2.3. Asia
- 5.2.4. Australia and New Zealand
- 5.2.5. Latin America
- 5.2.6. Middle East and Africa
- 5.1. Market Analysis, Insights and Forecast - by Gaming Platform
- 6. North America MMORPG Industry Analysis, Insights and Forecast, 2019-2031
- 6.1. Market Analysis, Insights and Forecast - by Gaming Platform
- 6.1.1. Mobile
- 6.1.2. Tablet
- 6.1.3. Gaming Console
- 6.1.4. PC
- 6.1. Market Analysis, Insights and Forecast - by Gaming Platform
- 7. Europe MMORPG Industry Analysis, Insights and Forecast, 2019-2031
- 7.1. Market Analysis, Insights and Forecast - by Gaming Platform
- 7.1.1. Mobile
- 7.1.2. Tablet
- 7.1.3. Gaming Console
- 7.1.4. PC
- 7.1. Market Analysis, Insights and Forecast - by Gaming Platform
- 8. Asia MMORPG Industry Analysis, Insights and Forecast, 2019-2031
- 8.1. Market Analysis, Insights and Forecast - by Gaming Platform
- 8.1.1. Mobile
- 8.1.2. Tablet
- 8.1.3. Gaming Console
- 8.1.4. PC
- 8.1. Market Analysis, Insights and Forecast - by Gaming Platform
- 9. Australia and New Zealand MMORPG Industry Analysis, Insights and Forecast, 2019-2031
- 9.1. Market Analysis, Insights and Forecast - by Gaming Platform
- 9.1.1. Mobile
- 9.1.2. Tablet
- 9.1.3. Gaming Console
- 9.1.4. PC
- 9.1. Market Analysis, Insights and Forecast - by Gaming Platform
- 10. Latin America MMORPG Industry Analysis, Insights and Forecast, 2019-2031
- 10.1. Market Analysis, Insights and Forecast - by Gaming Platform
- 10.1.1. Mobile
- 10.1.2. Tablet
- 10.1.3. Gaming Console
- 10.1.4. PC
- 10.1. Market Analysis, Insights and Forecast - by Gaming Platform
- 11. Middle East and Africa MMORPG Industry Analysis, Insights and Forecast, 2019-2031
- 11.1. Market Analysis, Insights and Forecast - by Gaming Platform
- 11.1.1. Mobile
- 11.1.2. Tablet
- 11.1.3. Gaming Console
- 11.1.4. PC
- 11.1. Market Analysis, Insights and Forecast - by Gaming Platform
- 12. North America MMORPG Industry Analysis, Insights and Forecast, 2019-2031
- 12.1. Market Analysis, Insights and Forecast - By Country/Sub-region
- 12.1.1 United States
- 12.1.2 Canada
- 12.1.3 Mexico
- 13. Europe MMORPG Industry Analysis, Insights and Forecast, 2019-2031
- 13.1. Market Analysis, Insights and Forecast - By Country/Sub-region
- 13.1.1 Germany
- 13.1.2 United Kingdom
- 13.1.3 France
- 13.1.4 Spain
- 13.1.5 Italy
- 13.1.6 Spain
- 13.1.7 Belgium
- 13.1.8 Netherland
- 13.1.9 Nordics
- 13.1.10 Rest of Europe
- 14. Asia Pacific MMORPG Industry Analysis, Insights and Forecast, 2019-2031
- 14.1. Market Analysis, Insights and Forecast - By Country/Sub-region
- 14.1.1 China
- 14.1.2 Japan
- 14.1.3 India
- 14.1.4 South Korea
- 14.1.5 Southeast Asia
- 14.1.6 Australia
- 14.1.7 Indonesia
- 14.1.8 Phillipes
- 14.1.9 Singapore
- 14.1.10 Thailandc
- 14.1.11 Rest of Asia Pacific
- 15. South America MMORPG Industry Analysis, Insights and Forecast, 2019-2031
- 15.1. Market Analysis, Insights and Forecast - By Country/Sub-region
- 15.1.1 Brazil
- 15.1.2 Argentina
- 15.1.3 Peru
- 15.1.4 Chile
- 15.1.5 Colombia
- 15.1.6 Ecuador
- 15.1.7 Venezuela
- 15.1.8 Rest of South America
- 16. MEA MMORPG Industry Analysis, Insights and Forecast, 2019-2031
- 16.1. Market Analysis, Insights and Forecast - By Country/Sub-region
- 16.1.1 United Arab Emirates
- 16.1.2 Saudi Arabia
- 16.1.3 South Africa
- 16.1.4 Rest of Middle East and Africa
- 17. Competitive Analysis
- 17.1. Global Market Share Analysis 2024
- 17.2. Company Profiles
- 17.2.1 Daybreak Game Company
- 17.2.1.1. Overview
- 17.2.1.2. Products
- 17.2.1.3. SWOT Analysis
- 17.2.1.4. Recent Developments
- 17.2.1.5. Financials (Based on Availability)
- 17.2.2 Electronic Arts Inc
- 17.2.2.1. Overview
- 17.2.2.2. Products
- 17.2.2.3. SWOT Analysis
- 17.2.2.4. Recent Developments
- 17.2.2.5. Financials (Based on Availability)
- 17.2.3 Amazon Game Studios
- 17.2.3.1. Overview
- 17.2.3.2. Products
- 17.2.3.3. SWOT Analysis
- 17.2.3.4. Recent Developments
- 17.2.3.5. Financials (Based on Availability)
- 17.2.4 Giant Interactive Group Inc
- 17.2.4.1. Overview
- 17.2.4.2. Products
- 17.2.4.3. SWOT Analysis
- 17.2.4.4. Recent Developments
- 17.2.4.5. Financials (Based on Availability)
- 17.2.5 Aeria Games
- 17.2.5.1. Overview
- 17.2.5.2. Products
- 17.2.5.3. SWOT Analysis
- 17.2.5.4. Recent Developments
- 17.2.5.5. Financials (Based on Availability)
- 17.2.6 CCP games UK Ltd
- 17.2.6.1. Overview
- 17.2.6.2. Products
- 17.2.6.3. SWOT Analysis
- 17.2.6.4. Recent Developments
- 17.2.6.5. Financials (Based on Availability)
- 17.2.7 NCSOFT Corporation
- 17.2.7.1. Overview
- 17.2.7.2. Products
- 17.2.7.3. SWOT Analysis
- 17.2.7.4. Recent Developments
- 17.2.7.5. Financials (Based on Availability)
- 17.2.8 Activision Blizzard Inc
- 17.2.8.1. Overview
- 17.2.8.2. Products
- 17.2.8.3. SWOT Analysis
- 17.2.8.4. Recent Developments
- 17.2.8.5. Financials (Based on Availability)
- 17.2.9 Neteasegames Inc
- 17.2.9.1. Overview
- 17.2.9.2. Products
- 17.2.9.3. SWOT Analysis
- 17.2.9.4. Recent Developments
- 17.2.9.5. Financials (Based on Availability)
- 17.2.10 Tencent Holdings Limited
- 17.2.10.1. Overview
- 17.2.10.2. Products
- 17.2.10.3. SWOT Analysis
- 17.2.10.4. Recent Developments
- 17.2.10.5. Financials (Based on Availability)
- 17.2.11 Bright Star Studios
- 17.2.11.1. Overview
- 17.2.11.2. Products
- 17.2.11.3. SWOT Analysis
- 17.2.11.4. Recent Developments
- 17.2.11.5. Financials (Based on Availability)
- 17.2.12 Ubisoft Entertainment SA
- 17.2.12.1. Overview
- 17.2.12.2. Products
- 17.2.12.3. SWOT Analysis
- 17.2.12.4. Recent Developments
- 17.2.12.5. Financials (Based on Availability)
- 17.2.13 Jagex Limited
- 17.2.13.1. Overview
- 17.2.13.2. Products
- 17.2.13.3. SWOT Analysis
- 17.2.13.4. Recent Developments
- 17.2.13.5. Financials (Based on Availability)
- 17.2.14 Gravity Corporatio
- 17.2.14.1. Overview
- 17.2.14.2. Products
- 17.2.14.3. SWOT Analysis
- 17.2.14.4. Recent Developments
- 17.2.14.5. Financials (Based on Availability)
- 17.2.15 Nexon Co Ltd
- 17.2.15.1. Overview
- 17.2.15.2. Products
- 17.2.15.3. SWOT Analysis
- 17.2.15.4. Recent Developments
- 17.2.15.5. Financials (Based on Availability)
- 17.2.1 Daybreak Game Company
List of Figures
- Figure 1: Global MMORPG Industry Revenue Breakdown (Million, %) by Region 2024 & 2032
- Figure 2: North America MMORPG Industry Revenue (Million), by Country 2024 & 2032
- Figure 3: North America MMORPG Industry Revenue Share (%), by Country 2024 & 2032
- Figure 4: Europe MMORPG Industry Revenue (Million), by Country 2024 & 2032
- Figure 5: Europe MMORPG Industry Revenue Share (%), by Country 2024 & 2032
- Figure 6: Asia Pacific MMORPG Industry Revenue (Million), by Country 2024 & 2032
- Figure 7: Asia Pacific MMORPG Industry Revenue Share (%), by Country 2024 & 2032
- Figure 8: South America MMORPG Industry Revenue (Million), by Country 2024 & 2032
- Figure 9: South America MMORPG Industry Revenue Share (%), by Country 2024 & 2032
- Figure 10: MEA MMORPG Industry Revenue (Million), by Country 2024 & 2032
- Figure 11: MEA MMORPG Industry Revenue Share (%), by Country 2024 & 2032
- Figure 12: North America MMORPG Industry Revenue (Million), by Gaming Platform 2024 & 2032
- Figure 13: North America MMORPG Industry Revenue Share (%), by Gaming Platform 2024 & 2032
- Figure 14: North America MMORPG Industry Revenue (Million), by Country 2024 & 2032
- Figure 15: North America MMORPG Industry Revenue Share (%), by Country 2024 & 2032
- Figure 16: Europe MMORPG Industry Revenue (Million), by Gaming Platform 2024 & 2032
- Figure 17: Europe MMORPG Industry Revenue Share (%), by Gaming Platform 2024 & 2032
- Figure 18: Europe MMORPG Industry Revenue (Million), by Country 2024 & 2032
- Figure 19: Europe MMORPG Industry Revenue Share (%), by Country 2024 & 2032
- Figure 20: Asia MMORPG Industry Revenue (Million), by Gaming Platform 2024 & 2032
- Figure 21: Asia MMORPG Industry Revenue Share (%), by Gaming Platform 2024 & 2032
- Figure 22: Asia MMORPG Industry Revenue (Million), by Country 2024 & 2032
- Figure 23: Asia MMORPG Industry Revenue Share (%), by Country 2024 & 2032
- Figure 24: Australia and New Zealand MMORPG Industry Revenue (Million), by Gaming Platform 2024 & 2032
- Figure 25: Australia and New Zealand MMORPG Industry Revenue Share (%), by Gaming Platform 2024 & 2032
- Figure 26: Australia and New Zealand MMORPG Industry Revenue (Million), by Country 2024 & 2032
- Figure 27: Australia and New Zealand MMORPG Industry Revenue Share (%), by Country 2024 & 2032
- Figure 28: Latin America MMORPG Industry Revenue (Million), by Gaming Platform 2024 & 2032
- Figure 29: Latin America MMORPG Industry Revenue Share (%), by Gaming Platform 2024 & 2032
- Figure 30: Latin America MMORPG Industry Revenue (Million), by Country 2024 & 2032
- Figure 31: Latin America MMORPG Industry Revenue Share (%), by Country 2024 & 2032
- Figure 32: Middle East and Africa MMORPG Industry Revenue (Million), by Gaming Platform 2024 & 2032
- Figure 33: Middle East and Africa MMORPG Industry Revenue Share (%), by Gaming Platform 2024 & 2032
- Figure 34: Middle East and Africa MMORPG Industry Revenue (Million), by Country 2024 & 2032
- Figure 35: Middle East and Africa MMORPG Industry Revenue Share (%), by Country 2024 & 2032
List of Tables
- Table 1: Global MMORPG Industry Revenue Million Forecast, by Region 2019 & 2032
- Table 2: Global MMORPG Industry Revenue Million Forecast, by Gaming Platform 2019 & 2032
- Table 3: Global MMORPG Industry Revenue Million Forecast, by Region 2019 & 2032
- Table 4: Global MMORPG Industry Revenue Million Forecast, by Country 2019 & 2032
- Table 5: United States MMORPG Industry Revenue (Million) Forecast, by Application 2019 & 2032
- Table 6: Canada MMORPG Industry Revenue (Million) Forecast, by Application 2019 & 2032
- Table 7: Mexico MMORPG Industry Revenue (Million) Forecast, by Application 2019 & 2032
- Table 8: Global MMORPG Industry Revenue Million Forecast, by Country 2019 & 2032
- Table 9: Germany MMORPG Industry Revenue (Million) Forecast, by Application 2019 & 2032
- Table 10: United Kingdom MMORPG Industry Revenue (Million) Forecast, by Application 2019 & 2032
- Table 11: France MMORPG Industry Revenue (Million) Forecast, by Application 2019 & 2032
- Table 12: Spain MMORPG Industry Revenue (Million) Forecast, by Application 2019 & 2032
- Table 13: Italy MMORPG Industry Revenue (Million) Forecast, by Application 2019 & 2032
- Table 14: Spain MMORPG Industry Revenue (Million) Forecast, by Application 2019 & 2032
- Table 15: Belgium MMORPG Industry Revenue (Million) Forecast, by Application 2019 & 2032
- Table 16: Netherland MMORPG Industry Revenue (Million) Forecast, by Application 2019 & 2032
- Table 17: Nordics MMORPG Industry Revenue (Million) Forecast, by Application 2019 & 2032
- Table 18: Rest of Europe MMORPG Industry Revenue (Million) Forecast, by Application 2019 & 2032
- Table 19: Global MMORPG Industry Revenue Million Forecast, by Country 2019 & 2032
- Table 20: China MMORPG Industry Revenue (Million) Forecast, by Application 2019 & 2032
- Table 21: Japan MMORPG Industry Revenue (Million) Forecast, by Application 2019 & 2032
- Table 22: India MMORPG Industry Revenue (Million) Forecast, by Application 2019 & 2032
- Table 23: South Korea MMORPG Industry Revenue (Million) Forecast, by Application 2019 & 2032
- Table 24: Southeast Asia MMORPG Industry Revenue (Million) Forecast, by Application 2019 & 2032
- Table 25: Australia MMORPG Industry Revenue (Million) Forecast, by Application 2019 & 2032
- Table 26: Indonesia MMORPG Industry Revenue (Million) Forecast, by Application 2019 & 2032
- Table 27: Phillipes MMORPG Industry Revenue (Million) Forecast, by Application 2019 & 2032
- Table 28: Singapore MMORPG Industry Revenue (Million) Forecast, by Application 2019 & 2032
- Table 29: Thailandc MMORPG Industry Revenue (Million) Forecast, by Application 2019 & 2032
- Table 30: Rest of Asia Pacific MMORPG Industry Revenue (Million) Forecast, by Application 2019 & 2032
- Table 31: Global MMORPG Industry Revenue Million Forecast, by Country 2019 & 2032
- Table 32: Brazil MMORPG Industry Revenue (Million) Forecast, by Application 2019 & 2032
- Table 33: Argentina MMORPG Industry Revenue (Million) Forecast, by Application 2019 & 2032
- Table 34: Peru MMORPG Industry Revenue (Million) Forecast, by Application 2019 & 2032
- Table 35: Chile MMORPG Industry Revenue (Million) Forecast, by Application 2019 & 2032
- Table 36: Colombia MMORPG Industry Revenue (Million) Forecast, by Application 2019 & 2032
- Table 37: Ecuador MMORPG Industry Revenue (Million) Forecast, by Application 2019 & 2032
- Table 38: Venezuela MMORPG Industry Revenue (Million) Forecast, by Application 2019 & 2032
- Table 39: Rest of South America MMORPG Industry Revenue (Million) Forecast, by Application 2019 & 2032
- Table 40: Global MMORPG Industry Revenue Million Forecast, by Country 2019 & 2032
- Table 41: United Arab Emirates MMORPG Industry Revenue (Million) Forecast, by Application 2019 & 2032
- Table 42: Saudi Arabia MMORPG Industry Revenue (Million) Forecast, by Application 2019 & 2032
- Table 43: South Africa MMORPG Industry Revenue (Million) Forecast, by Application 2019 & 2032
- Table 44: Rest of Middle East and Africa MMORPG Industry Revenue (Million) Forecast, by Application 2019 & 2032
- Table 45: Global MMORPG Industry Revenue Million Forecast, by Gaming Platform 2019 & 2032
- Table 46: Global MMORPG Industry Revenue Million Forecast, by Country 2019 & 2032
- Table 47: United States MMORPG Industry Revenue (Million) Forecast, by Application 2019 & 2032
- Table 48: Canada MMORPG Industry Revenue (Million) Forecast, by Application 2019 & 2032
- Table 49: Global MMORPG Industry Revenue Million Forecast, by Gaming Platform 2019 & 2032
- Table 50: Global MMORPG Industry Revenue Million Forecast, by Country 2019 & 2032
- Table 51: United Kingdom MMORPG Industry Revenue (Million) Forecast, by Application 2019 & 2032
- Table 52: Germany MMORPG Industry Revenue (Million) Forecast, by Application 2019 & 2032
- Table 53: France MMORPG Industry Revenue (Million) Forecast, by Application 2019 & 2032
- Table 54: Italy MMORPG Industry Revenue (Million) Forecast, by Application 2019 & 2032
- Table 55: Russia MMORPG Industry Revenue (Million) Forecast, by Application 2019 & 2032
- Table 56: Global MMORPG Industry Revenue Million Forecast, by Gaming Platform 2019 & 2032
- Table 57: Global MMORPG Industry Revenue Million Forecast, by Country 2019 & 2032
- Table 58: China MMORPG Industry Revenue (Million) Forecast, by Application 2019 & 2032
- Table 59: India MMORPG Industry Revenue (Million) Forecast, by Application 2019 & 2032
- Table 60: Japan MMORPG Industry Revenue (Million) Forecast, by Application 2019 & 2032
- Table 61: South Korea MMORPG Industry Revenue (Million) Forecast, by Application 2019 & 2032
- Table 62: Global MMORPG Industry Revenue Million Forecast, by Gaming Platform 2019 & 2032
- Table 63: Global MMORPG Industry Revenue Million Forecast, by Country 2019 & 2032
- Table 64: Global MMORPG Industry Revenue Million Forecast, by Gaming Platform 2019 & 2032
- Table 65: Global MMORPG Industry Revenue Million Forecast, by Country 2019 & 2032
- Table 66: Brazil MMORPG Industry Revenue (Million) Forecast, by Application 2019 & 2032
- Table 67: Mexico MMORPG Industry Revenue (Million) Forecast, by Application 2019 & 2032
- Table 68: Argentina MMORPG Industry Revenue (Million) Forecast, by Application 2019 & 2032
- Table 69: Global MMORPG Industry Revenue Million Forecast, by Gaming Platform 2019 & 2032
- Table 70: Global MMORPG Industry Revenue Million Forecast, by Country 2019 & 2032
- Table 71: United Arab Emirates MMORPG Industry Revenue (Million) Forecast, by Application 2019 & 2032
- Table 72: Saudi Arabia MMORPG Industry Revenue (Million) Forecast, by Application 2019 & 2032
- Table 73: South Africa MMORPG Industry Revenue (Million) Forecast, by Application 2019 & 2032
Frequently Asked Questions
1. What is the projected Compound Annual Growth Rate (CAGR) of the MMORPG Industry?
The projected CAGR is approximately 10.75%.
2. Which companies are prominent players in the MMORPG Industry?
Key companies in the market include Daybreak Game Company, Electronic Arts Inc, Amazon Game Studios, Giant Interactive Group Inc, Aeria Games, CCP games UK Ltd, NCSOFT Corporation, Activision Blizzard Inc, Neteasegames Inc, Tencent Holdings Limited, Bright Star Studios, Ubisoft Entertainment SA, Jagex Limited, Gravity Corporatio, Nexon Co Ltd.
3. What are the main segments of the MMORPG Industry?
The market segments include Gaming Platform.
4. Can you provide details about the market size?
The market size is estimated to be USD 25.34 Million as of 2022.
5. What are some drivers contributing to market growth?
Rising Smartphone Penetration and Increasing Penetration of Internet among Developing Economies; Technological Advancement such as IoT. AR. and VR; Emergence of Gamification.
6. What are the notable trends driving market growth?
Rising Smartphone Penetration and Increasing Penetration of Internet among Developing Economies may Drive the Market Growth.
7. Are there any restraints impacting market growth?
Costs. Interoperability. and Security Concerns.
8. Can you provide examples of recent developments in the market?
January 2023: The development team behind Search for Animera, a web3-native massively multiplayer online role-playing game (MMORPG), announced the game's launch on ImmutableX, the go-to Ethereum platform for creating and scaling web3 games. By partnering with ImmutableX and utilizing its platform for the project's infrastructure, the developers of Animera can make sure that users may benefit from the simplicity of quick transactions, free mining, and trade, as well as the strength of Ethereum's built-in security.
9. What pricing options are available for accessing the report?
Pricing options include single-user, multi-user, and enterprise licenses priced at USD 4750, USD 5250, and USD 8750 respectively.
10. Is the market size provided in terms of value or volume?
The market size is provided in terms of value, measured in Million.
11. Are there any specific market keywords associated with the report?
Yes, the market keyword associated with the report is "MMORPG Industry," which aids in identifying and referencing the specific market segment covered.
12. How do I determine which pricing option suits my needs best?
The pricing options vary based on user requirements and access needs. Individual users may opt for single-user licenses, while businesses requiring broader access may choose multi-user or enterprise licenses for cost-effective access to the report.
13. Are there any additional resources or data provided in the MMORPG Industry report?
While the report offers comprehensive insights, it's advisable to review the specific contents or supplementary materials provided to ascertain if additional resources or data are available.
14. How can I stay updated on further developments or reports in the MMORPG Industry?
To stay informed about further developments, trends, and reports in the MMORPG Industry, consider subscribing to industry newsletters, following relevant companies and organizations, or regularly checking reputable industry news sources and publications.
Methodology
Step 1 - Identification of Relevant Samples Size from Population Database


Step 2 - Approaches for Defining Global Market Size (Value, Volume* & Price*)

Note*: In applicable scenarios
Step 3 - Data Sources
Primary Research
- Web Analytics
- Survey Reports
- Research Institute
- Latest Research Reports
- Opinion Leaders
Secondary Research
- Annual Reports
- White Paper
- Latest Press Release
- Industry Association
- Paid Database
- Investor Presentations

Step 4 - Data Triangulation
Involves using different sources of information in order to increase the validity of a study
These sources are likely to be stakeholders in a program - participants, other researchers, program staff, other community members, and so on.
Then we put all data in single framework & apply various statistical tools to find out the dynamic on the market.
During the analysis stage, feedback from the stakeholder groups would be compared to determine areas of agreement as well as areas of divergence


