
Key Insights
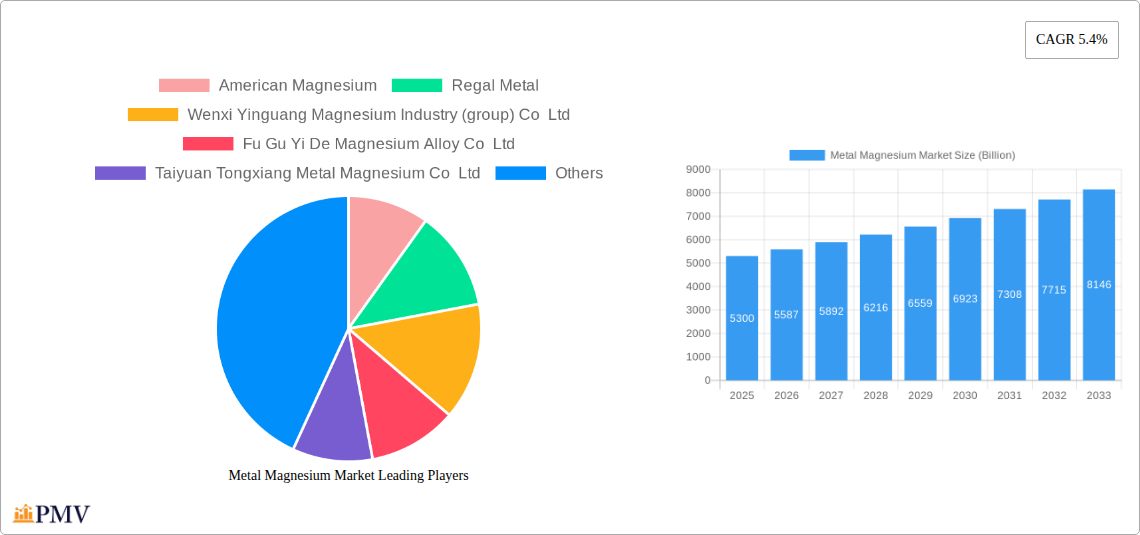
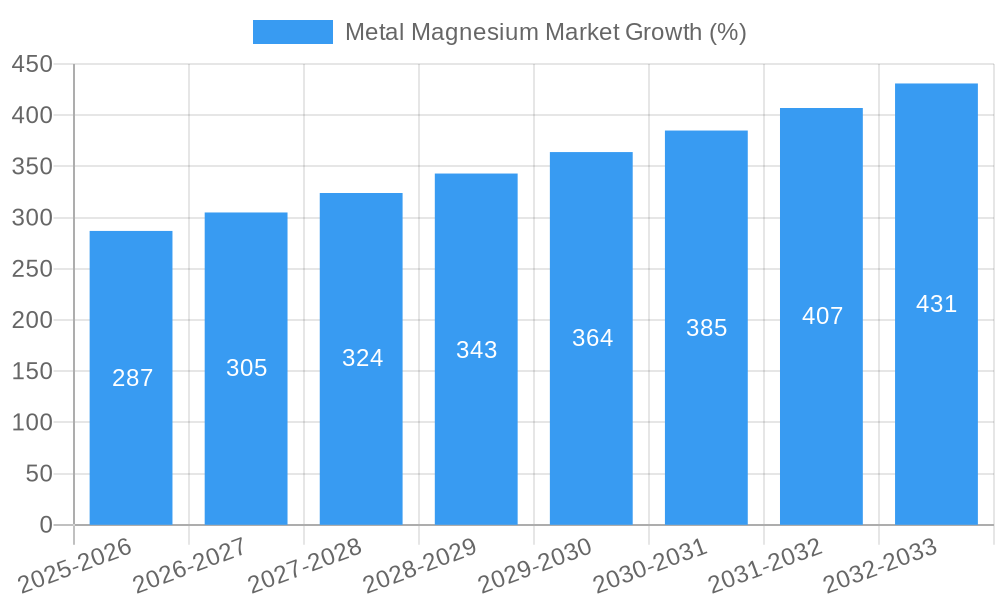
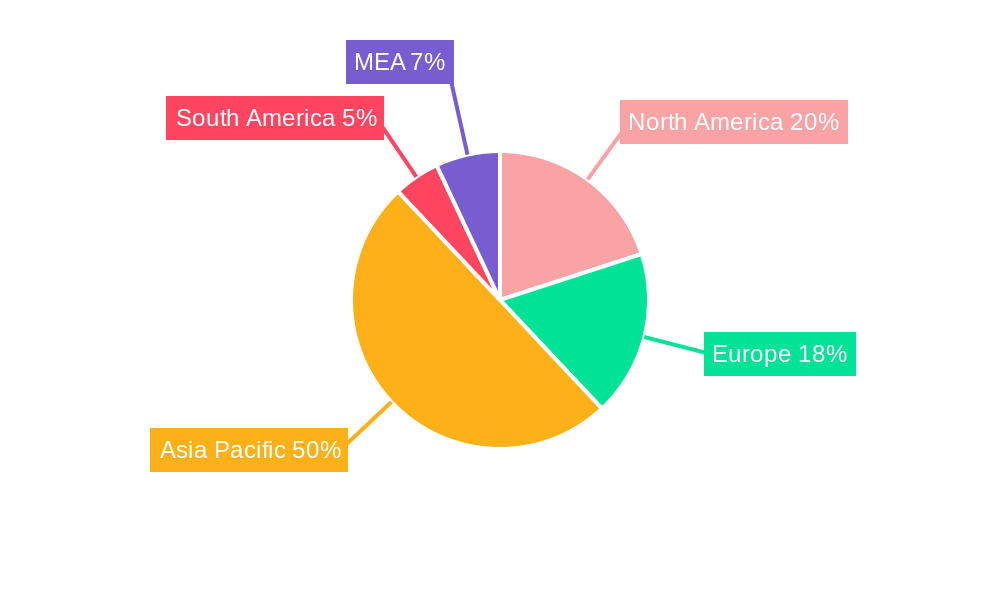
The global metal magnesium market, valued at $5.3 billion in 2025, is projected to experience robust growth, driven by its increasing demand across diverse end-user industries. A Compound Annual Growth Rate (CAGR) of 5.4% from 2025 to 2033 indicates a significant expansion of this market. This growth is fueled by several key factors. The automotive industry's ongoing lightweighting initiatives, aiming for improved fuel efficiency and reduced emissions, are a major driver. The increasing use of magnesium alloys in die-casting applications, particularly for automotive parts, contributes significantly to this demand. Furthermore, the construction sector's adoption of lightweight materials and the growth of the electronics industry, requiring lightweight and high-strength components, are also contributing to market expansion. Growth in metal reduction processes, especially in regions with abundant magnesium resources, further fuels market expansion. However, price volatility of magnesium and potential environmental concerns related to its production remain key restraints to consider. Regional variations exist, with Asia Pacific, particularly China, expected to maintain a dominant market share due to large-scale production and consumption. North America and Europe also contribute significantly, driven by robust automotive and aerospace sectors.
Despite these positive trends, challenges persist. Fluctuations in raw material prices, particularly energy costs, can impact magnesium production and subsequently market prices. Moreover, the environmental impact of magnesium production necessitates the adoption of sustainable manufacturing practices to mitigate concerns. Competition among established players and the emergence of new entrants further shape market dynamics. Going forward, the market will likely witness greater emphasis on technological advancements, particularly in improving magnesium alloy properties and developing more efficient extraction methods to further enhance its competitive edge against other materials. A shift towards sustainable production methods, coupled with strategic partnerships and technological innovations, will be critical for companies to thrive in this dynamic market.
This in-depth report provides a comprehensive analysis of the global Metal Magnesium Market, offering valuable insights into market dynamics, competitive landscape, and future growth prospects. The study period covers 2019-2033, with 2025 as the base and estimated year. The forecast period extends from 2025 to 2033, encompassing the historical period of 2019-2024. The report reveals a market valued at approximately Billion USD in 2025, projected to reach Billion USD by 2033, exhibiting a CAGR of xx%.
Metal Magnesium Market Market Structure & Competitive Dynamics
The Metal Magnesium market exhibits a moderately concentrated structure, with key players vying for market share. The market concentration ratio (CR4) is estimated at xx%, indicating the presence of several significant players. Innovation within the industry is driven by ongoing research into advanced magnesium alloys and production techniques, particularly focusing on enhancing strength, durability, and corrosion resistance. Regulatory frameworks, including environmental regulations and safety standards, significantly influence manufacturing processes and product development. Product substitutes, such as aluminum and plastics, pose competition, particularly in applications where cost is a primary factor. End-user trends, particularly in the automotive and aerospace sectors, are driving demand for lighter, stronger materials, favoring magnesium's adoption. M&A activity within the sector has been moderate in recent years, with deal values averaging approximately Billion USD annually, primarily focusing on expanding production capacity and securing raw material supply chains.
- Market Share: The top five players hold approximately xx% of the global market share.
- M&A Activity: Notable mergers and acquisitions include [Include specific examples and deal values if available, otherwise use "xx Billion USD" as a placeholder for deal values].
- Innovation Ecosystems: Collaboration between research institutions and industry players is fostering advancements in magnesium alloy technology and manufacturing processes.
Metal Magnesium Market Industry Trends & Insights
The Metal Magnesium market is experiencing robust growth, fueled by several key factors. The increasing demand for lightweight materials in the automotive and aerospace industries is a major driver, pushing market expansion. Technological advancements in magnesium alloy production, enhancing its properties and reducing costs, are further accelerating market growth. Consumer preference for sustainable and environmentally friendly products aligns well with magnesium's relatively low carbon footprint compared to alternative materials. Competitive dynamics are shaping the market, with companies investing heavily in R&D and capacity expansion to meet growing demand. The market is expected to witness significant growth, with a projected CAGR of xx% during the forecast period (2025-2033). Market penetration in key sectors like automotive and aerospace is expected to increase from xx% in 2025 to xx% by 2033.
Dominant Markets & Segments in Metal Magnesium Market
The Asia-Pacific region is currently the dominant market for metal magnesium, driven by rapid industrialization and robust economic growth in countries like China and India. The significant demand from automotive, construction, and electronics sectors in these countries fuels market expansion.
- Key Drivers in Asia-Pacific:
- Rapid industrialization and infrastructure development.
- High automotive production and sales.
- Government incentives for lightweight material adoption.
- Dominant Segment: The Aluminum Alloys segment holds the largest market share, driven by high demand from the automotive industry for lightweight components. Die-casting is another significant segment, utilized extensively in consumer electronics and automotive parts manufacturing.
Metal Magnesium Market Product Innovations
Recent innovations in metal magnesium include the development of high-strength, lightweight alloys with enhanced corrosion resistance. These advancements expand magnesium's applications in various sectors, including automotive, aerospace, and electronics. Improved manufacturing techniques also enhance cost-effectiveness and sustainability, making magnesium a more competitive option. The focus is on developing alloys tailored to specific applications, improving material properties, and reducing production costs.
Report Segmentation & Scope
The report segments the Metal Magnesium market by end-user industry:
- Aluminum Alloys: This segment is projected to experience significant growth due to its use in lightweight automotive components. Market size is estimated at Billion USD in 2025, projected to reach Billion USD by 2033. Competitive dynamics are driven by innovation in alloy compositions.
- Die-casting: This segment benefits from the growing demand for lightweight components in electronics and automotive sectors. Market size is estimated at Billion USD in 2025 and is expected to grow to Billion USD by 2033.
- Iron and Steel: This segment's growth is influenced by the use of magnesium as an alloying agent to enhance material properties. Market size is estimated at Billion USD in 2025 and is projected to reach Billion USD by 2033.
- Metal Reduction: This segment's growth is tied to the broader metal industry's trends and technological advancements in magnesium extraction processes. Market size is estimated at Billion USD in 2025 and is projected to reach Billion USD by 2033.
- Other End-user Industries: This segment encompasses various applications, including electronics, medical devices, and consumer goods. Market size is estimated at Billion USD in 2025 and is projected to reach Billion USD by 2033.
Key Drivers of Metal Magnesium Market Growth
Several factors contribute to the Metal Magnesium market's growth. The increasing demand for lightweight materials in automotive and aerospace applications due to stringent fuel efficiency standards and emission regulations is paramount. Advancements in magnesium alloy technology, improving its properties and reducing production costs, are significant drivers. Government initiatives promoting the use of sustainable and environmentally friendly materials further boost market growth.
Challenges in the Metal Magnesium Market Sector
The Metal Magnesium market faces challenges such as magnesium's inherent flammability and susceptibility to corrosion, which require careful handling and protective coatings. Supply chain disruptions and fluctuating raw material prices pose significant challenges. Competition from alternative materials like aluminum and plastics also presents a restraint. These factors can impact market growth and profitability.
Leading Players in the Metal Magnesium Market Market
- American Magnesium
- Regal Metal
- Wenxi Yinguang Magnesium Industry (group) Co Ltd
- Fu Gu Yi De Magnesium Alloy Co Ltd
- Taiyuan Tongxiang Metal Magnesium Co Ltd
- Rima Industrial
- Shanxi Bada Magnesium Co Ltd
- Southern Magnesium & Chemicals Limited (SMCL)
- Nanjing Yunhai Special Metals Co Ltd
- Solikamsk Magnesium Works
- Western Magnesium Corporation
- US Magnesium LLC
- Dead Sea Magnesium (ICL Group)
Key Developments in Metal Magnesium Market Sector
- July 2022: Chongqing Boao Magnesium-Aluminum Metal Manufacturing Co. Ltd (a wholly owned subsidiary of RSM Group/ Nanjing Yunhai Special Metals Co. Ltd) announced the completion of a high-performance magnesium-aluminum alloy and deep processing project (Phase II project) located in Pingshan Industrial Park, Chongqing City. The new facilities include a magnesium particle production workshop with a 7,200 tons/year capacity. This expansion significantly increases magnesium alloy production capacity in China.
- February 2023: Western Magnesium Corporation announced plans to build a new production facility in Nevada with an initial annual capacity of 25,000 metric tons, along with a new R&D center. This expansion positions Western Magnesium to serve automotive, aerospace, airline, eco-friendly technology, and defense contractor clients. This is a major step in expanding North American magnesium production capacity.
Strategic Metal Magnesium Market Market Outlook
The Metal Magnesium market is poised for continued growth, driven by ongoing technological advancements, increasing demand from key end-use sectors, and growing awareness of its sustainability advantages. Strategic opportunities exist in developing innovative alloys with enhanced properties, expanding into new applications, and improving supply chain efficiency to enhance market competitiveness. Companies investing in R&D and capacity expansion will be well-positioned to capitalize on the market's long-term growth potential.
Metal Magnesium Market Segmentation
-
1. End-user Industry
- 1.1. Aluminum Alloys
- 1.2. Die-casting
- 1.3. Iron and Steel
- 1.4. Metal Reduction
- 1.5. Other End-user Industries
Metal Magnesium Market Segmentation By Geography
-
1. Asia Pacific
- 1.1. China
- 1.2. India
- 1.3. Japan
- 1.4. South Korea
- 1.5. Rest of Asia Pacific
-
2. North America
- 2.1. United States
- 2.2. Canada
- 2.3. Mexico
-
3. Europe
- 3.1. Germany
- 3.2. United Kingdom
- 3.3. Italy
- 3.4. France
- 3.5. Rest of Europe
-
4. South America
- 4.1. Brazil
- 4.2. Argentina
- 4.3. Rest of South America
-
5. Middle East and Africa
- 5.1. Saudi Arabia
- 5.2. South Africa
- 5.3. Rest of Middle East and Africa
Metal Magnesium Market REPORT HIGHLIGHTS
| Aspects | Details |
|---|---|
| Study Period | 2019-2033 |
| Base Year | 2024 |
| Estimated Year | 2025 |
| Forecast Period | 2025-2033 |
| Historical Period | 2019-2024 |
| Growth Rate | CAGR of 5.4% from 2019-2033 |
| Segmentation |
|
Table of Contents
- 1. Introduction
- 1.1. Research Scope
- 1.2. Market Segmentation
- 1.3. Research Methodology
- 1.4. Definitions and Assumptions
- 2. Executive Summary
- 2.1. Introduction
- 3. Market Dynamics
- 3.1. Introduction
- 3.2. Market Drivers
- 3.2.1. Growing Demand for Alloying with Other Metals; Increasing Demand for Lightweight Materials in the Aerospace and Automotive Industry
- 3.3. Market Restrains
- 3.3.1. Fluctuation in Prices of Metal
- 3.4. Market Trends
- 3.4.1. Increasing Usage in the Production of Aluminum Alloys
- 4. Market Factor Analysis
- 4.1. Porters Five Forces
- 4.2. Supply/Value Chain
- 4.3. PESTEL analysis
- 4.4. Market Entropy
- 4.5. Patent/Trademark Analysis
- 5. Global Metal Magnesium Market Analysis, Insights and Forecast, 2019-2031
- 5.1. Market Analysis, Insights and Forecast - by End-user Industry
- 5.1.1. Aluminum Alloys
- 5.1.2. Die-casting
- 5.1.3. Iron and Steel
- 5.1.4. Metal Reduction
- 5.1.5. Other End-user Industries
- 5.2. Market Analysis, Insights and Forecast - by Region
- 5.2.1. Asia Pacific
- 5.2.2. North America
- 5.2.3. Europe
- 5.2.4. South America
- 5.2.5. Middle East and Africa
- 5.1. Market Analysis, Insights and Forecast - by End-user Industry
- 6. Asia Pacific Metal Magnesium Market Analysis, Insights and Forecast, 2019-2031
- 6.1. Market Analysis, Insights and Forecast - by End-user Industry
- 6.1.1. Aluminum Alloys
- 6.1.2. Die-casting
- 6.1.3. Iron and Steel
- 6.1.4. Metal Reduction
- 6.1.5. Other End-user Industries
- 6.1. Market Analysis, Insights and Forecast - by End-user Industry
- 7. North America Metal Magnesium Market Analysis, Insights and Forecast, 2019-2031
- 7.1. Market Analysis, Insights and Forecast - by End-user Industry
- 7.1.1. Aluminum Alloys
- 7.1.2. Die-casting
- 7.1.3. Iron and Steel
- 7.1.4. Metal Reduction
- 7.1.5. Other End-user Industries
- 7.1. Market Analysis, Insights and Forecast - by End-user Industry
- 8. Europe Metal Magnesium Market Analysis, Insights and Forecast, 2019-2031
- 8.1. Market Analysis, Insights and Forecast - by End-user Industry
- 8.1.1. Aluminum Alloys
- 8.1.2. Die-casting
- 8.1.3. Iron and Steel
- 8.1.4. Metal Reduction
- 8.1.5. Other End-user Industries
- 8.1. Market Analysis, Insights and Forecast - by End-user Industry
- 9. South America Metal Magnesium Market Analysis, Insights and Forecast, 2019-2031
- 9.1. Market Analysis, Insights and Forecast - by End-user Industry
- 9.1.1. Aluminum Alloys
- 9.1.2. Die-casting
- 9.1.3. Iron and Steel
- 9.1.4. Metal Reduction
- 9.1.5. Other End-user Industries
- 9.1. Market Analysis, Insights and Forecast - by End-user Industry
- 10. Middle East and Africa Metal Magnesium Market Analysis, Insights and Forecast, 2019-2031
- 10.1. Market Analysis, Insights and Forecast - by End-user Industry
- 10.1.1. Aluminum Alloys
- 10.1.2. Die-casting
- 10.1.3. Iron and Steel
- 10.1.4. Metal Reduction
- 10.1.5. Other End-user Industries
- 10.1. Market Analysis, Insights and Forecast - by End-user Industry
- 11. North America Metal Magnesium Market Analysis, Insights and Forecast, 2019-2031
- 11.1. Market Analysis, Insights and Forecast - By Country/Sub-region
- 11.1.1 United States
- 11.1.2 Canada
- 11.1.3 Mexico
- 12. Europe Metal Magnesium Market Analysis, Insights and Forecast, 2019-2031
- 12.1. Market Analysis, Insights and Forecast - By Country/Sub-region
- 12.1.1 Germany
- 12.1.2 France
- 12.1.3 Italy
- 12.1.4 United Kingdom
- 12.1.5 Netherlands
- 12.1.6 Rest of Europe
- 13. Asia Pacific Metal Magnesium Market Analysis, Insights and Forecast, 2019-2031
- 13.1. Market Analysis, Insights and Forecast - By Country/Sub-region
- 13.1.1 China
- 13.1.2 Japan
- 13.1.3 India
- 13.1.4 South Korea
- 13.1.5 Taiwan
- 13.1.6 Australia
- 13.1.7 Rest of Asia-Pacific
- 14. South America Metal Magnesium Market Analysis, Insights and Forecast, 2019-2031
- 14.1. Market Analysis, Insights and Forecast - By Country/Sub-region
- 14.1.1 Brazil
- 14.1.2 Argentina
- 14.1.3 Rest of South America
- 15. MEA Metal Magnesium Market Analysis, Insights and Forecast, 2019-2031
- 15.1. Market Analysis, Insights and Forecast - By Country/Sub-region
- 15.1.1 Middle East
- 15.1.2 Africa
- 16. Competitive Analysis
- 16.1. Global Market Share Analysis 2024
- 16.2. Company Profiles
- 16.2.1 American Magnesium
- 16.2.1.1. Overview
- 16.2.1.2. Products
- 16.2.1.3. SWOT Analysis
- 16.2.1.4. Recent Developments
- 16.2.1.5. Financials (Based on Availability)
- 16.2.2 Regal Metal
- 16.2.2.1. Overview
- 16.2.2.2. Products
- 16.2.2.3. SWOT Analysis
- 16.2.2.4. Recent Developments
- 16.2.2.5. Financials (Based on Availability)
- 16.2.3 Wenxi Yinguang Magnesium Industry (group) Co Ltd
- 16.2.3.1. Overview
- 16.2.3.2. Products
- 16.2.3.3. SWOT Analysis
- 16.2.3.4. Recent Developments
- 16.2.3.5. Financials (Based on Availability)
- 16.2.4 Fu Gu Yi De Magnesium Alloy Co Ltd
- 16.2.4.1. Overview
- 16.2.4.2. Products
- 16.2.4.3. SWOT Analysis
- 16.2.4.4. Recent Developments
- 16.2.4.5. Financials (Based on Availability)
- 16.2.5 Taiyuan Tongxiang Metal Magnesium Co Ltd
- 16.2.5.1. Overview
- 16.2.5.2. Products
- 16.2.5.3. SWOT Analysis
- 16.2.5.4. Recent Developments
- 16.2.5.5. Financials (Based on Availability)
- 16.2.6 Rima Industrial
- 16.2.6.1. Overview
- 16.2.6.2. Products
- 16.2.6.3. SWOT Analysis
- 16.2.6.4. Recent Developments
- 16.2.6.5. Financials (Based on Availability)
- 16.2.7 Shanxi Bada Magnesium Co Ltd
- 16.2.7.1. Overview
- 16.2.7.2. Products
- 16.2.7.3. SWOT Analysis
- 16.2.7.4. Recent Developments
- 16.2.7.5. Financials (Based on Availability)
- 16.2.8 Southern Magnesium & Chemicals Limited (SMCL)
- 16.2.8.1. Overview
- 16.2.8.2. Products
- 16.2.8.3. SWOT Analysis
- 16.2.8.4. Recent Developments
- 16.2.8.5. Financials (Based on Availability)
- 16.2.9 Nanjing Yunhai Special Metals Co Ltd
- 16.2.9.1. Overview
- 16.2.9.2. Products
- 16.2.9.3. SWOT Analysis
- 16.2.9.4. Recent Developments
- 16.2.9.5. Financials (Based on Availability)
- 16.2.10 Solikamsk Magnesium Works
- 16.2.10.1. Overview
- 16.2.10.2. Products
- 16.2.10.3. SWOT Analysis
- 16.2.10.4. Recent Developments
- 16.2.10.5. Financials (Based on Availability)
- 16.2.11 Western Magnesium Corporation
- 16.2.11.1. Overview
- 16.2.11.2. Products
- 16.2.11.3. SWOT Analysis
- 16.2.11.4. Recent Developments
- 16.2.11.5. Financials (Based on Availability)
- 16.2.12 US Magnesium LLC
- 16.2.12.1. Overview
- 16.2.12.2. Products
- 16.2.12.3. SWOT Analysis
- 16.2.12.4. Recent Developments
- 16.2.12.5. Financials (Based on Availability)
- 16.2.13 Dead Sea Magnesium (ICL Group)
- 16.2.13.1. Overview
- 16.2.13.2. Products
- 16.2.13.3. SWOT Analysis
- 16.2.13.4. Recent Developments
- 16.2.13.5. Financials (Based on Availability)
- 16.2.1 American Magnesium
List of Figures
- Figure 1: Global Metal Magnesium Market Revenue Breakdown (Billion, %) by Region 2024 & 2032
- Figure 2: Global Metal Magnesium Market Volume Breakdown (K Tons, %) by Region 2024 & 2032
- Figure 3: North America Metal Magnesium Market Revenue (Billion), by Country 2024 & 2032
- Figure 4: North America Metal Magnesium Market Volume (K Tons), by Country 2024 & 2032
- Figure 5: North America Metal Magnesium Market Revenue Share (%), by Country 2024 & 2032
- Figure 6: North America Metal Magnesium Market Volume Share (%), by Country 2024 & 2032
- Figure 7: Europe Metal Magnesium Market Revenue (Billion), by Country 2024 & 2032
- Figure 8: Europe Metal Magnesium Market Volume (K Tons), by Country 2024 & 2032
- Figure 9: Europe Metal Magnesium Market Revenue Share (%), by Country 2024 & 2032
- Figure 10: Europe Metal Magnesium Market Volume Share (%), by Country 2024 & 2032
- Figure 11: Asia Pacific Metal Magnesium Market Revenue (Billion), by Country 2024 & 2032
- Figure 12: Asia Pacific Metal Magnesium Market Volume (K Tons), by Country 2024 & 2032
- Figure 13: Asia Pacific Metal Magnesium Market Revenue Share (%), by Country 2024 & 2032
- Figure 14: Asia Pacific Metal Magnesium Market Volume Share (%), by Country 2024 & 2032
- Figure 15: South America Metal Magnesium Market Revenue (Billion), by Country 2024 & 2032
- Figure 16: South America Metal Magnesium Market Volume (K Tons), by Country 2024 & 2032
- Figure 17: South America Metal Magnesium Market Revenue Share (%), by Country 2024 & 2032
- Figure 18: South America Metal Magnesium Market Volume Share (%), by Country 2024 & 2032
- Figure 19: MEA Metal Magnesium Market Revenue (Billion), by Country 2024 & 2032
- Figure 20: MEA Metal Magnesium Market Volume (K Tons), by Country 2024 & 2032
- Figure 21: MEA Metal Magnesium Market Revenue Share (%), by Country 2024 & 2032
- Figure 22: MEA Metal Magnesium Market Volume Share (%), by Country 2024 & 2032
- Figure 23: Asia Pacific Metal Magnesium Market Revenue (Billion), by End-user Industry 2024 & 2032
- Figure 24: Asia Pacific Metal Magnesium Market Volume (K Tons), by End-user Industry 2024 & 2032
- Figure 25: Asia Pacific Metal Magnesium Market Revenue Share (%), by End-user Industry 2024 & 2032
- Figure 26: Asia Pacific Metal Magnesium Market Volume Share (%), by End-user Industry 2024 & 2032
- Figure 27: Asia Pacific Metal Magnesium Market Revenue (Billion), by Country 2024 & 2032
- Figure 28: Asia Pacific Metal Magnesium Market Volume (K Tons), by Country 2024 & 2032
- Figure 29: Asia Pacific Metal Magnesium Market Revenue Share (%), by Country 2024 & 2032
- Figure 30: Asia Pacific Metal Magnesium Market Volume Share (%), by Country 2024 & 2032
- Figure 31: North America Metal Magnesium Market Revenue (Billion), by End-user Industry 2024 & 2032
- Figure 32: North America Metal Magnesium Market Volume (K Tons), by End-user Industry 2024 & 2032
- Figure 33: North America Metal Magnesium Market Revenue Share (%), by End-user Industry 2024 & 2032
- Figure 34: North America Metal Magnesium Market Volume Share (%), by End-user Industry 2024 & 2032
- Figure 35: North America Metal Magnesium Market Revenue (Billion), by Country 2024 & 2032
- Figure 36: North America Metal Magnesium Market Volume (K Tons), by Country 2024 & 2032
- Figure 37: North America Metal Magnesium Market Revenue Share (%), by Country 2024 & 2032
- Figure 38: North America Metal Magnesium Market Volume Share (%), by Country 2024 & 2032
- Figure 39: Europe Metal Magnesium Market Revenue (Billion), by End-user Industry 2024 & 2032
- Figure 40: Europe Metal Magnesium Market Volume (K Tons), by End-user Industry 2024 & 2032
- Figure 41: Europe Metal Magnesium Market Revenue Share (%), by End-user Industry 2024 & 2032
- Figure 42: Europe Metal Magnesium Market Volume Share (%), by End-user Industry 2024 & 2032
- Figure 43: Europe Metal Magnesium Market Revenue (Billion), by Country 2024 & 2032
- Figure 44: Europe Metal Magnesium Market Volume (K Tons), by Country 2024 & 2032
- Figure 45: Europe Metal Magnesium Market Revenue Share (%), by Country 2024 & 2032
- Figure 46: Europe Metal Magnesium Market Volume Share (%), by Country 2024 & 2032
- Figure 47: South America Metal Magnesium Market Revenue (Billion), by End-user Industry 2024 & 2032
- Figure 48: South America Metal Magnesium Market Volume (K Tons), by End-user Industry 2024 & 2032
- Figure 49: South America Metal Magnesium Market Revenue Share (%), by End-user Industry 2024 & 2032
- Figure 50: South America Metal Magnesium Market Volume Share (%), by End-user Industry 2024 & 2032
- Figure 51: South America Metal Magnesium Market Revenue (Billion), by Country 2024 & 2032
- Figure 52: South America Metal Magnesium Market Volume (K Tons), by Country 2024 & 2032
- Figure 53: South America Metal Magnesium Market Revenue Share (%), by Country 2024 & 2032
- Figure 54: South America Metal Magnesium Market Volume Share (%), by Country 2024 & 2032
- Figure 55: Middle East and Africa Metal Magnesium Market Revenue (Billion), by End-user Industry 2024 & 2032
- Figure 56: Middle East and Africa Metal Magnesium Market Volume (K Tons), by End-user Industry 2024 & 2032
- Figure 57: Middle East and Africa Metal Magnesium Market Revenue Share (%), by End-user Industry 2024 & 2032
- Figure 58: Middle East and Africa Metal Magnesium Market Volume Share (%), by End-user Industry 2024 & 2032
- Figure 59: Middle East and Africa Metal Magnesium Market Revenue (Billion), by Country 2024 & 2032
- Figure 60: Middle East and Africa Metal Magnesium Market Volume (K Tons), by Country 2024 & 2032
- Figure 61: Middle East and Africa Metal Magnesium Market Revenue Share (%), by Country 2024 & 2032
- Figure 62: Middle East and Africa Metal Magnesium Market Volume Share (%), by Country 2024 & 2032
List of Tables
- Table 1: Global Metal Magnesium Market Revenue Billion Forecast, by Region 2019 & 2032
- Table 2: Global Metal Magnesium Market Volume K Tons Forecast, by Region 2019 & 2032
- Table 3: Global Metal Magnesium Market Revenue Billion Forecast, by End-user Industry 2019 & 2032
- Table 4: Global Metal Magnesium Market Volume K Tons Forecast, by End-user Industry 2019 & 2032
- Table 5: Global Metal Magnesium Market Revenue Billion Forecast, by Region 2019 & 2032
- Table 6: Global Metal Magnesium Market Volume K Tons Forecast, by Region 2019 & 2032
- Table 7: Global Metal Magnesium Market Revenue Billion Forecast, by Country 2019 & 2032
- Table 8: Global Metal Magnesium Market Volume K Tons Forecast, by Country 2019 & 2032
- Table 9: United States Metal Magnesium Market Revenue (Billion) Forecast, by Application 2019 & 2032
- Table 10: United States Metal Magnesium Market Volume (K Tons) Forecast, by Application 2019 & 2032
- Table 11: Canada Metal Magnesium Market Revenue (Billion) Forecast, by Application 2019 & 2032
- Table 12: Canada Metal Magnesium Market Volume (K Tons) Forecast, by Application 2019 & 2032
- Table 13: Mexico Metal Magnesium Market Revenue (Billion) Forecast, by Application 2019 & 2032
- Table 14: Mexico Metal Magnesium Market Volume (K Tons) Forecast, by Application 2019 & 2032
- Table 15: Global Metal Magnesium Market Revenue Billion Forecast, by Country 2019 & 2032
- Table 16: Global Metal Magnesium Market Volume K Tons Forecast, by Country 2019 & 2032
- Table 17: Germany Metal Magnesium Market Revenue (Billion) Forecast, by Application 2019 & 2032
- Table 18: Germany Metal Magnesium Market Volume (K Tons) Forecast, by Application 2019 & 2032
- Table 19: France Metal Magnesium Market Revenue (Billion) Forecast, by Application 2019 & 2032
- Table 20: France Metal Magnesium Market Volume (K Tons) Forecast, by Application 2019 & 2032
- Table 21: Italy Metal Magnesium Market Revenue (Billion) Forecast, by Application 2019 & 2032
- Table 22: Italy Metal Magnesium Market Volume (K Tons) Forecast, by Application 2019 & 2032
- Table 23: United Kingdom Metal Magnesium Market Revenue (Billion) Forecast, by Application 2019 & 2032
- Table 24: United Kingdom Metal Magnesium Market Volume (K Tons) Forecast, by Application 2019 & 2032
- Table 25: Netherlands Metal Magnesium Market Revenue (Billion) Forecast, by Application 2019 & 2032
- Table 26: Netherlands Metal Magnesium Market Volume (K Tons) Forecast, by Application 2019 & 2032
- Table 27: Rest of Europe Metal Magnesium Market Revenue (Billion) Forecast, by Application 2019 & 2032
- Table 28: Rest of Europe Metal Magnesium Market Volume (K Tons) Forecast, by Application 2019 & 2032
- Table 29: Global Metal Magnesium Market Revenue Billion Forecast, by Country 2019 & 2032
- Table 30: Global Metal Magnesium Market Volume K Tons Forecast, by Country 2019 & 2032
- Table 31: China Metal Magnesium Market Revenue (Billion) Forecast, by Application 2019 & 2032
- Table 32: China Metal Magnesium Market Volume (K Tons) Forecast, by Application 2019 & 2032
- Table 33: Japan Metal Magnesium Market Revenue (Billion) Forecast, by Application 2019 & 2032
- Table 34: Japan Metal Magnesium Market Volume (K Tons) Forecast, by Application 2019 & 2032
- Table 35: India Metal Magnesium Market Revenue (Billion) Forecast, by Application 2019 & 2032
- Table 36: India Metal Magnesium Market Volume (K Tons) Forecast, by Application 2019 & 2032
- Table 37: South Korea Metal Magnesium Market Revenue (Billion) Forecast, by Application 2019 & 2032
- Table 38: South Korea Metal Magnesium Market Volume (K Tons) Forecast, by Application 2019 & 2032
- Table 39: Taiwan Metal Magnesium Market Revenue (Billion) Forecast, by Application 2019 & 2032
- Table 40: Taiwan Metal Magnesium Market Volume (K Tons) Forecast, by Application 2019 & 2032
- Table 41: Australia Metal Magnesium Market Revenue (Billion) Forecast, by Application 2019 & 2032
- Table 42: Australia Metal Magnesium Market Volume (K Tons) Forecast, by Application 2019 & 2032
- Table 43: Rest of Asia-Pacific Metal Magnesium Market Revenue (Billion) Forecast, by Application 2019 & 2032
- Table 44: Rest of Asia-Pacific Metal Magnesium Market Volume (K Tons) Forecast, by Application 2019 & 2032
- Table 45: Global Metal Magnesium Market Revenue Billion Forecast, by Country 2019 & 2032
- Table 46: Global Metal Magnesium Market Volume K Tons Forecast, by Country 2019 & 2032
- Table 47: Brazil Metal Magnesium Market Revenue (Billion) Forecast, by Application 2019 & 2032
- Table 48: Brazil Metal Magnesium Market Volume (K Tons) Forecast, by Application 2019 & 2032
- Table 49: Argentina Metal Magnesium Market Revenue (Billion) Forecast, by Application 2019 & 2032
- Table 50: Argentina Metal Magnesium Market Volume (K Tons) Forecast, by Application 2019 & 2032
- Table 51: Rest of South America Metal Magnesium Market Revenue (Billion) Forecast, by Application 2019 & 2032
- Table 52: Rest of South America Metal Magnesium Market Volume (K Tons) Forecast, by Application 2019 & 2032
- Table 53: Global Metal Magnesium Market Revenue Billion Forecast, by Country 2019 & 2032
- Table 54: Global Metal Magnesium Market Volume K Tons Forecast, by Country 2019 & 2032
- Table 55: Middle East Metal Magnesium Market Revenue (Billion) Forecast, by Application 2019 & 2032
- Table 56: Middle East Metal Magnesium Market Volume (K Tons) Forecast, by Application 2019 & 2032
- Table 57: Africa Metal Magnesium Market Revenue (Billion) Forecast, by Application 2019 & 2032
- Table 58: Africa Metal Magnesium Market Volume (K Tons) Forecast, by Application 2019 & 2032
- Table 59: Global Metal Magnesium Market Revenue Billion Forecast, by End-user Industry 2019 & 2032
- Table 60: Global Metal Magnesium Market Volume K Tons Forecast, by End-user Industry 2019 & 2032
- Table 61: Global Metal Magnesium Market Revenue Billion Forecast, by Country 2019 & 2032
- Table 62: Global Metal Magnesium Market Volume K Tons Forecast, by Country 2019 & 2032
- Table 63: China Metal Magnesium Market Revenue (Billion) Forecast, by Application 2019 & 2032
- Table 64: China Metal Magnesium Market Volume (K Tons) Forecast, by Application 2019 & 2032
- Table 65: India Metal Magnesium Market Revenue (Billion) Forecast, by Application 2019 & 2032
- Table 66: India Metal Magnesium Market Volume (K Tons) Forecast, by Application 2019 & 2032
- Table 67: Japan Metal Magnesium Market Revenue (Billion) Forecast, by Application 2019 & 2032
- Table 68: Japan Metal Magnesium Market Volume (K Tons) Forecast, by Application 2019 & 2032
- Table 69: South Korea Metal Magnesium Market Revenue (Billion) Forecast, by Application 2019 & 2032
- Table 70: South Korea Metal Magnesium Market Volume (K Tons) Forecast, by Application 2019 & 2032
- Table 71: Rest of Asia Pacific Metal Magnesium Market Revenue (Billion) Forecast, by Application 2019 & 2032
- Table 72: Rest of Asia Pacific Metal Magnesium Market Volume (K Tons) Forecast, by Application 2019 & 2032
- Table 73: Global Metal Magnesium Market Revenue Billion Forecast, by End-user Industry 2019 & 2032
- Table 74: Global Metal Magnesium Market Volume K Tons Forecast, by End-user Industry 2019 & 2032
- Table 75: Global Metal Magnesium Market Revenue Billion Forecast, by Country 2019 & 2032
- Table 76: Global Metal Magnesium Market Volume K Tons Forecast, by Country 2019 & 2032
- Table 77: United States Metal Magnesium Market Revenue (Billion) Forecast, by Application 2019 & 2032
- Table 78: United States Metal Magnesium Market Volume (K Tons) Forecast, by Application 2019 & 2032
- Table 79: Canada Metal Magnesium Market Revenue (Billion) Forecast, by Application 2019 & 2032
- Table 80: Canada Metal Magnesium Market Volume (K Tons) Forecast, by Application 2019 & 2032
- Table 81: Mexico Metal Magnesium Market Revenue (Billion) Forecast, by Application 2019 & 2032
- Table 82: Mexico Metal Magnesium Market Volume (K Tons) Forecast, by Application 2019 & 2032
- Table 83: Global Metal Magnesium Market Revenue Billion Forecast, by End-user Industry 2019 & 2032
- Table 84: Global Metal Magnesium Market Volume K Tons Forecast, by End-user Industry 2019 & 2032
- Table 85: Global Metal Magnesium Market Revenue Billion Forecast, by Country 2019 & 2032
- Table 86: Global Metal Magnesium Market Volume K Tons Forecast, by Country 2019 & 2032
- Table 87: Germany Metal Magnesium Market Revenue (Billion) Forecast, by Application 2019 & 2032
- Table 88: Germany Metal Magnesium Market Volume (K Tons) Forecast, by Application 2019 & 2032
- Table 89: United Kingdom Metal Magnesium Market Revenue (Billion) Forecast, by Application 2019 & 2032
- Table 90: United Kingdom Metal Magnesium Market Volume (K Tons) Forecast, by Application 2019 & 2032
- Table 91: Italy Metal Magnesium Market Revenue (Billion) Forecast, by Application 2019 & 2032
- Table 92: Italy Metal Magnesium Market Volume (K Tons) Forecast, by Application 2019 & 2032
- Table 93: France Metal Magnesium Market Revenue (Billion) Forecast, by Application 2019 & 2032
- Table 94: France Metal Magnesium Market Volume (K Tons) Forecast, by Application 2019 & 2032
- Table 95: Rest of Europe Metal Magnesium Market Revenue (Billion) Forecast, by Application 2019 & 2032
- Table 96: Rest of Europe Metal Magnesium Market Volume (K Tons) Forecast, by Application 2019 & 2032
- Table 97: Global Metal Magnesium Market Revenue Billion Forecast, by End-user Industry 2019 & 2032
- Table 98: Global Metal Magnesium Market Volume K Tons Forecast, by End-user Industry 2019 & 2032
- Table 99: Global Metal Magnesium Market Revenue Billion Forecast, by Country 2019 & 2032
- Table 100: Global Metal Magnesium Market Volume K Tons Forecast, by Country 2019 & 2032
- Table 101: Brazil Metal Magnesium Market Revenue (Billion) Forecast, by Application 2019 & 2032
- Table 102: Brazil Metal Magnesium Market Volume (K Tons) Forecast, by Application 2019 & 2032
- Table 103: Argentina Metal Magnesium Market Revenue (Billion) Forecast, by Application 2019 & 2032
- Table 104: Argentina Metal Magnesium Market Volume (K Tons) Forecast, by Application 2019 & 2032
- Table 105: Rest of South America Metal Magnesium Market Revenue (Billion) Forecast, by Application 2019 & 2032
- Table 106: Rest of South America Metal Magnesium Market Volume (K Tons) Forecast, by Application 2019 & 2032
- Table 107: Global Metal Magnesium Market Revenue Billion Forecast, by End-user Industry 2019 & 2032
- Table 108: Global Metal Magnesium Market Volume K Tons Forecast, by End-user Industry 2019 & 2032
- Table 109: Global Metal Magnesium Market Revenue Billion Forecast, by Country 2019 & 2032
- Table 110: Global Metal Magnesium Market Volume K Tons Forecast, by Country 2019 & 2032
- Table 111: Saudi Arabia Metal Magnesium Market Revenue (Billion) Forecast, by Application 2019 & 2032
- Table 112: Saudi Arabia Metal Magnesium Market Volume (K Tons) Forecast, by Application 2019 & 2032
- Table 113: South Africa Metal Magnesium Market Revenue (Billion) Forecast, by Application 2019 & 2032
- Table 114: South Africa Metal Magnesium Market Volume (K Tons) Forecast, by Application 2019 & 2032
- Table 115: Rest of Middle East and Africa Metal Magnesium Market Revenue (Billion) Forecast, by Application 2019 & 2032
- Table 116: Rest of Middle East and Africa Metal Magnesium Market Volume (K Tons) Forecast, by Application 2019 & 2032
Frequently Asked Questions
1. What is the projected Compound Annual Growth Rate (CAGR) of the Metal Magnesium Market?
The projected CAGR is approximately 5.4%.
2. Which companies are prominent players in the Metal Magnesium Market?
Key companies in the market include American Magnesium, Regal Metal, Wenxi Yinguang Magnesium Industry (group) Co Ltd, Fu Gu Yi De Magnesium Alloy Co Ltd, Taiyuan Tongxiang Metal Magnesium Co Ltd, Rima Industrial, Shanxi Bada Magnesium Co Ltd, Southern Magnesium & Chemicals Limited (SMCL), Nanjing Yunhai Special Metals Co Ltd, Solikamsk Magnesium Works, Western Magnesium Corporation, US Magnesium LLC, Dead Sea Magnesium (ICL Group).
3. What are the main segments of the Metal Magnesium Market?
The market segments include End-user Industry.
4. Can you provide details about the market size?
The market size is estimated to be USD 5.3 Billion as of 2022.
5. What are some drivers contributing to market growth?
Growing Demand for Alloying with Other Metals; Increasing Demand for Lightweight Materials in the Aerospace and Automotive Industry.
6. What are the notable trends driving market growth?
Increasing Usage in the Production of Aluminum Alloys.
7. Are there any restraints impacting market growth?
Fluctuation in Prices of Metal.
8. Can you provide examples of recent developments in the market?
February 2023: Western Magnesium Corporation announced its plan to build a new production facility for magnesium metal with an initial annual capacity of 25,000 metric tons and a new research and development center in Nevada. With the help of this new production facility, the company aims to serve automotive, aerospace, airline, eco-friendly technology companies, and Defense Contractors through this expansion.
9. What pricing options are available for accessing the report?
Pricing options include single-user, multi-user, and enterprise licenses priced at USD 4750, USD 5250, and USD 8750 respectively.
10. Is the market size provided in terms of value or volume?
The market size is provided in terms of value, measured in Billion and volume, measured in K Tons.
11. Are there any specific market keywords associated with the report?
Yes, the market keyword associated with the report is "Metal Magnesium Market," which aids in identifying and referencing the specific market segment covered.
12. How do I determine which pricing option suits my needs best?
The pricing options vary based on user requirements and access needs. Individual users may opt for single-user licenses, while businesses requiring broader access may choose multi-user or enterprise licenses for cost-effective access to the report.
13. Are there any additional resources or data provided in the Metal Magnesium Market report?
While the report offers comprehensive insights, it's advisable to review the specific contents or supplementary materials provided to ascertain if additional resources or data are available.
14. How can I stay updated on further developments or reports in the Metal Magnesium Market?
To stay informed about further developments, trends, and reports in the Metal Magnesium Market, consider subscribing to industry newsletters, following relevant companies and organizations, or regularly checking reputable industry news sources and publications.
Methodology
Step 1 - Identification of Relevant Samples Size from Population Database


Step 2 - Approaches for Defining Global Market Size (Value, Volume* & Price*)

Note*: In applicable scenarios
Step 3 - Data Sources
Primary Research
- Web Analytics
- Survey Reports
- Research Institute
- Latest Research Reports
- Opinion Leaders
Secondary Research
- Annual Reports
- White Paper
- Latest Press Release
- Industry Association
- Paid Database
- Investor Presentations

Step 4 - Data Triangulation
Involves using different sources of information in order to increase the validity of a study
These sources are likely to be stakeholders in a program - participants, other researchers, program staff, other community members, and so on.
Then we put all data in single framework & apply various statistical tools to find out the dynamic on the market.
During the analysis stage, feedback from the stakeholder groups would be compared to determine areas of agreement as well as areas of divergence


