
Key Insights
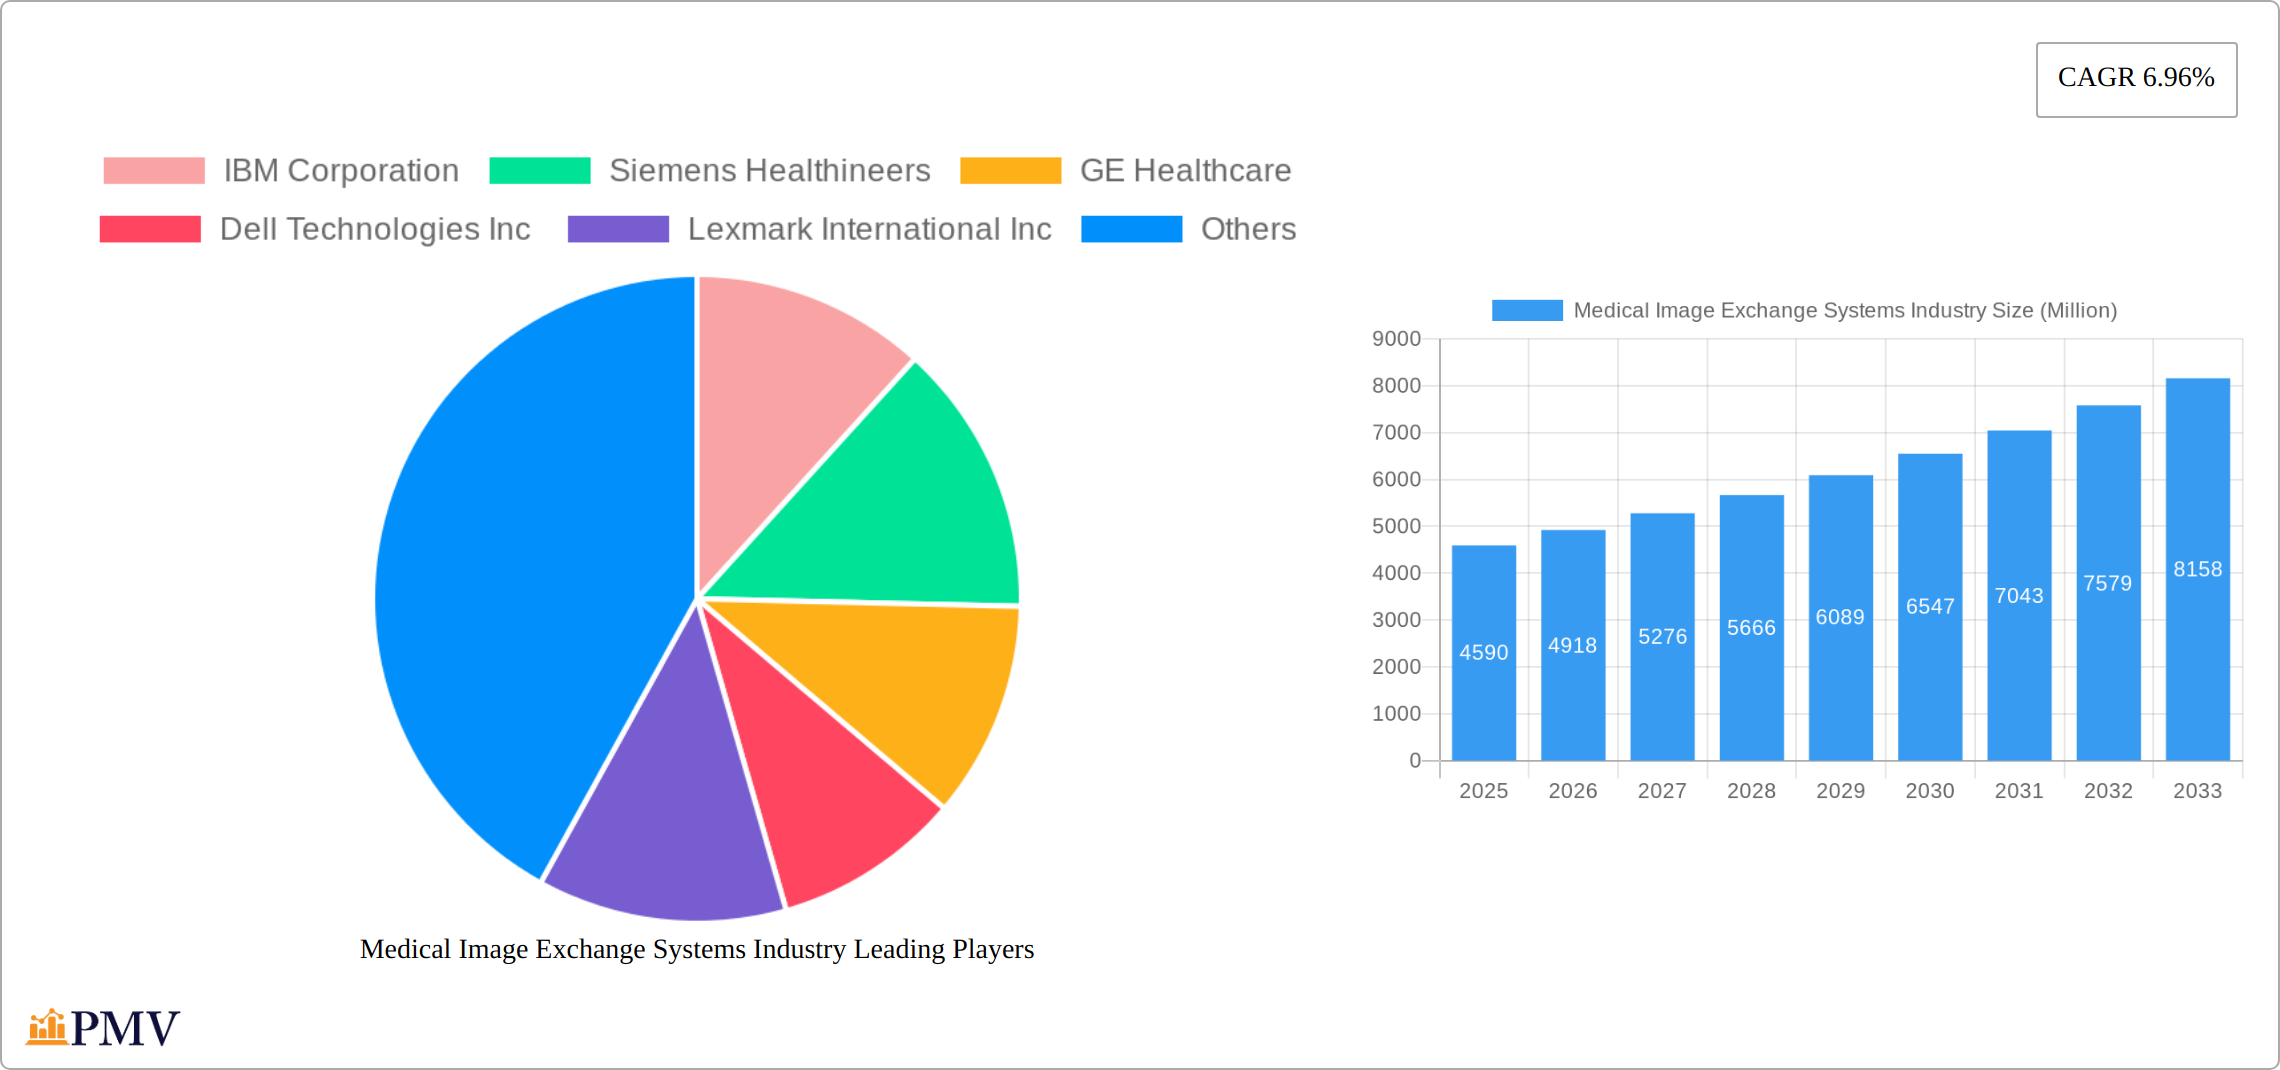
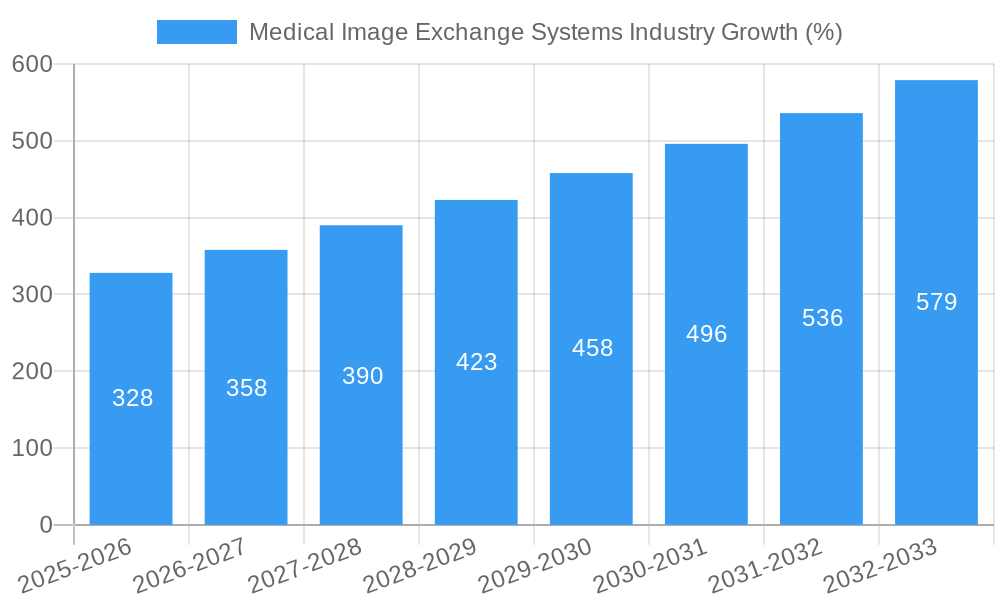
The Medical Image Exchange Systems (MIES) market, valued at $4.59 billion in 2025, is projected to experience robust growth, driven by a Compound Annual Growth Rate (CAGR) of 6.96% from 2025 to 2033. This expansion is fueled by several key factors. The increasing adoption of telehealth and remote patient monitoring necessitates efficient and secure image sharing solutions. Furthermore, the rising prevalence of chronic diseases, coupled with an aging global population, is leading to a surge in diagnostic imaging procedures, thus increasing demand for effective MIES. The shift towards value-based care models also incentivizes healthcare providers to optimize workflows and improve collaboration, making MIES integral to achieving these goals. Technological advancements, such as the development of cloud-based solutions and artificial intelligence (AI)-powered image analysis tools, are further contributing to market growth by enhancing efficiency, accessibility, and diagnostic accuracy. Finally, stringent regulatory mandates promoting interoperability and data security are pushing the adoption of standardized MIES across various healthcare settings.
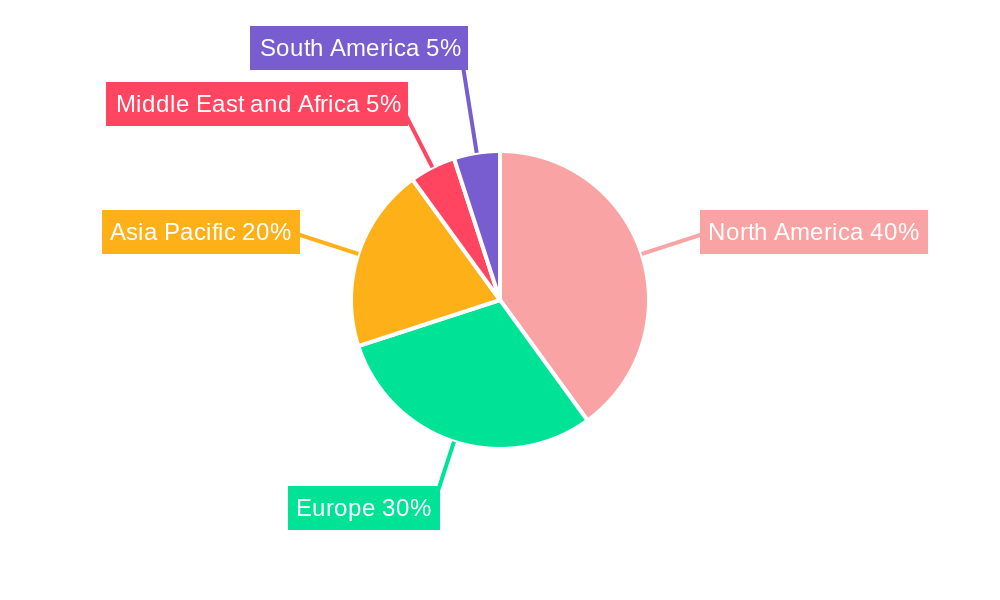
The market segmentation reveals significant opportunities across various end-users, with hospitals and diagnostic centers representing substantial portions of the market. Vendor-neutral archives (VNAs) and Picture Archiving and Communications Systems (PACS) dominate the systems segment, reflecting their established roles in managing and exchanging medical images. Geographically, North America is expected to maintain a leading market share due to high healthcare spending and technological advancements. However, regions like Asia-Pacific are poised for significant growth, propelled by increasing healthcare infrastructure development and rising disposable incomes. Competitive dynamics are shaped by established players like IBM, Siemens Healthineers, and GE Healthcare, along with emerging companies innovating in cloud-based and AI-driven solutions. The market's future trajectory hinges on continued technological innovation, regulatory support for interoperability, and expanding adoption across various healthcare settings globally.
Medical Image Exchange Systems Industry: A Comprehensive Market Report (2019-2033)
This comprehensive report provides a detailed analysis of the Medical Image Exchange Systems market, offering valuable insights into market dynamics, competitive landscapes, and future growth projections. The study period covers 2019-2033, with 2025 as the base and estimated year. The forecast period spans 2025-2033, and the historical period encompasses 2019-2024. The report is crucial for industry stakeholders, investors, and healthcare professionals seeking to understand the evolving landscape of medical image management and exchange. The market is estimated at xx Million in 2025 and projected to reach xx Million by 2033, exhibiting a CAGR of xx%.
Medical Image Exchange Systems Industry Market Structure & Competitive Dynamics
The Medical Image Exchange Systems market exhibits a moderately concentrated structure, with several major players holding significant market share. Key players such as IBM Corporation, Siemens Healthineers, GE Healthcare, and Dell Technologies Inc compete intensely, driving innovation and influencing market pricing. Market share estimates for 2025 are: IBM (xx%), Siemens (xx%), GE (xx%), Dell (xx%), with the remaining share distributed among other players like Lexmark International Inc, BridgeHead Software, Koninklijke Philips NV, Carestream Health Inc (Onex Corporation), McKesson Corporation, Novarad Corporation, Agfa-Gevaert Group, and Fujifilm Holdings Corporation.
The regulatory framework, particularly HIPAA and GDPR compliance, significantly impacts market dynamics. Innovation is primarily driven by advancements in cloud computing, artificial intelligence (AI), and big data analytics for improved image storage, retrieval, and analysis. The rise of vendor-neutral archives (VNAs) and the increasing adoption of cloud-based PACS systems are key trends shaping the market. Product substitutes are limited, primarily consisting of legacy systems, but the industry faces pressure from open-source solutions and innovative startups. Mergers and acquisitions (M&A) activity has been moderate, with deal values averaging xx Million over the past five years. Recent M&A activity reflects a focus on expanding product portfolios and geographic reach. End-user trends, such as the increasing adoption of telehealth and remote patient monitoring, are driving demand for interoperable imaging systems.
Medical Image Exchange Systems Industry Industry Trends & Insights
The Medical Image Exchange Systems market is experiencing robust growth fueled by several factors. The rising prevalence of chronic diseases necessitating frequent imaging procedures is a primary driver. Technological advancements like AI-powered image analysis and cloud-based solutions are improving efficiency and accessibility. Increasing government investments in healthcare infrastructure and initiatives promoting interoperability are accelerating market expansion. A shift towards value-based care and the need for better data management are also contributing factors. Consumer preferences are leaning towards seamless, user-friendly systems that integrate with existing workflows. This trend is reflected in the growing adoption of vendor-neutral archives and cloud-based PACS. Competitive dynamics are characterized by ongoing innovation, strategic partnerships, and a focus on improving interoperability. The market’s CAGR is projected at xx%, with market penetration increasing across all segments. The increasing adoption of telehealth and remote diagnostics is expected to significantly impact growth in the coming years.
Dominant Markets & Segments in Medical Image Exchange Systems Industry
The Medical Image Exchange Systems market is experiencing robust growth, driven by technological advancements, increasing healthcare spending, and a growing emphasis on interoperability. North America currently holds the largest market share, fueled by advanced healthcare infrastructure, high technological adoption rates, and significant investments in healthcare IT. However, Europe and the Asia-Pacific region are emerging as significant markets with substantial growth potential, presenting exciting opportunities for expansion and innovation.
Key Drivers for Regional Market Dominance:
- North America: Strong regulatory support for interoperability, high technological adoption, robust healthcare spending, and a mature market with established players.
- Europe: Growing demand for efficient healthcare solutions, increasing investments in digital health infrastructure, and the implementation of nationwide health IT initiatives.
- Asia-Pacific: Rising healthcare expenditure, increasing prevalence of chronic diseases, government initiatives promoting digital health, and a rapidly expanding middle class with increased access to healthcare.
Dominant Market Segments:
- End-User: Hospitals constitute the largest market segment due to the high volume of imaging procedures. However, diagnostic centers and ambulatory surgery centers are demonstrating significant growth, driven by increasing demand for specialized imaging services and efficient data management.
- System: Vendor Neutral Archives (VNAs) are experiencing rapid adoption due to their ability to integrate diverse imaging systems and enhance interoperability. While PACS remains a substantial segment, its growth is being complemented by the rise of VNAs and other advanced imaging management systems, such as cloud-based solutions and AI-powered platforms.
Medical Image Exchange Systems Industry Product Innovations
Recent product developments in medical image exchange systems emphasize enhanced interoperability, AI-powered image analysis, and cloud-based platforms. Vendors are focusing on creating user-friendly interfaces, improving workflow efficiency, and integrating data analytics for better clinical decision-making. The integration of AI enables automated image analysis, speeding up diagnoses and improving accuracy. Cloud-based solutions offer scalability, cost-effectiveness, and improved access to images from remote locations. These innovations are improving the market fit by addressing the increasing demand for efficient, secure, and cost-effective image management solutions.
Report Segmentation & Scope
This report segments the market based on end-user (hospitals, diagnostic centers, ambulatory surgery centers) and system type (vendor-neutral archives, PACS, other systems). Each segment is analyzed for market size, growth projections, and competitive dynamics. The hospitals segment is expected to witness significant growth owing to the increasing volume of imaging procedures and the need for efficient image management. The diagnostic centers segment is poised for growth due to the rising number of diagnostic imaging facilities. Ambulatory surgery centers are also seeing increasing adoption of these systems due to their need for efficient data management. VNAs are expected to dominate the system segment, driven by the increasing need for interoperability and data integration. PACS continues to hold a significant market share, but its growth is projected to be slightly slower than VNAs. The “other systems” segment includes various niche technologies and is expected to experience moderate growth.
Key Drivers of Medical Image Exchange Systems Industry Growth
Technological advancements, including AI-driven image analysis and cloud-based solutions, are primary growth drivers. The increasing prevalence of chronic diseases, necessitating frequent imaging, fuels market demand. Government initiatives promoting interoperability and electronic health records (EHR) integration are also critical drivers. Increased healthcare spending and a growing emphasis on value-based care contribute to market expansion. Furthermore, the rising adoption of telehealth and remote diagnostics is expected to significantly boost market growth in the coming years.
Challenges in the Medical Image Exchange Systems Industry Sector
High initial investment costs for implementing new systems, along with the complexity of integrating diverse imaging modalities, present significant challenges. Concerns about data security and privacy, especially with the increasing use of cloud-based solutions, are also major hurdles. Interoperability issues between different systems remain a challenge, hindering seamless data exchange. The competitive landscape is intense, with major players constantly striving to improve their offerings, creating pressure on pricing and margins. These factors can cumulatively impact market growth by delaying adoption and increasing implementation costs.
Leading Players in the Medical Image Exchange Systems Industry Market
- IBM Corporation
- Siemens Healthineers
- GE Healthcare
- Dell Technologies Inc
- Lexmark International Inc
- BridgeHead Software
- Koninklijke Philips NV
- Carestream Health Inc (Onex Corporation)
- McKesson Corporation
- Novarad Corporation
- Agfa-Gevaert Group
- Fujifilm Holdings Corporation
Key Developments in Medical Image Exchange Systems Industry Sector
March 2022: Intelerad Medical Systems launched its new Enterprise Imaging and Informatics Suite at the 2022 HIMSS Global Health Conference & Exhibition. This launch significantly enhanced the capabilities of vendor-neutral archives and improved interoperability across healthcare systems.
March 2022: Philips introduced cloud-enabled enterprise imaging informatics and analytics solutions, including Philips Health Suite Interoperability. This expansion of cloud-based offerings improved access and data management for healthcare providers.
Strategic Medical Image Exchange Systems Industry Market Outlook
The future of the Medical Image Exchange Systems market looks promising, driven by technological advancements, increased healthcare spending, and a growing focus on interoperability. Strategic opportunities lie in developing AI-powered diagnostic tools, expanding cloud-based solutions, and enhancing cybersecurity measures. Focusing on improving interoperability and user experience will be crucial for market success. Companies that can successfully integrate diverse imaging modalities and provide seamless data exchange will be well-positioned for growth. The market’s robust growth is expected to continue, driven by the convergence of technology, regulatory mandates, and changing healthcare delivery models.
Medical Image Exchange Systems Industry Segmentation
-
1. System
- 1.1. Vendor Neutral Archive
- 1.2. Picture Archiving and Communications System (PACS)
- 1.3. Other Systems
-
2. End-User
- 2.1. Hospitals
- 2.2. Diagnostic Centers
- 2.3. Ambulatory Surgery Centers
Medical Image Exchange Systems Industry Segmentation By Geography
-
1. North America
- 1.1. United States
- 1.2. Canada
- 1.3. Mexico
-
2. Europe
- 2.1. Germany
- 2.2. United Kingdom
- 2.3. France
- 2.4. Italy
- 2.5. Spain
- 2.6. Rest of Europe
-
3. Asia Pacific
- 3.1. China
- 3.2. Japan
- 3.3. India
- 3.4. Australia
- 3.5. South Korea
- 3.6. Rest of Asia Pacific
-
4. Middle East and Africa
- 4.1. GCC
- 4.2. South Africa
- 4.3. Rest of Middle East and Africa
-
5. South America
- 5.1. Brazil
- 5.2. Argentina
- 5.3. Rest of South America
Medical Image Exchange Systems Industry REPORT HIGHLIGHTS
| Aspects | Details |
|---|---|
| Study Period | 2019-2033 |
| Base Year | 2024 |
| Estimated Year | 2025 |
| Forecast Period | 2025-2033 |
| Historical Period | 2019-2024 |
| Growth Rate | CAGR of 6.96% from 2019-2033 |
| Segmentation |
|
Table of Contents
- 1. Introduction
- 1.1. Research Scope
- 1.2. Market Segmentation
- 1.3. Research Methodology
- 1.4. Definitions and Assumptions
- 2. Executive Summary
- 2.1. Introduction
- 3. Market Dynamics
- 3.1. Introduction
- 3.2. Market Drivers
- 3.2.1. Technological Innovations in the Diagnostic Imaging and Image Management; Rising Prevalence of Chronic Diseases; Emergence of Big Data in Healthcare
- 3.3. Market Restrains
- 3.3.1. Cost Associated With Implementation of Medical Imaging Management Solutions; Decrease In the Supply of SPECT and PET Systems due to the Shortage of Radioisotopes
- 3.4. Market Trends
- 3.4.1. Picture Archiving and Communications Systems (PACS) is Expected to Record Notable CAGR in the Market During the Forecast Period
- 4. Market Factor Analysis
- 4.1. Porters Five Forces
- 4.2. Supply/Value Chain
- 4.3. PESTEL analysis
- 4.4. Market Entropy
- 4.5. Patent/Trademark Analysis
- 5. Global Medical Image Exchange Systems Industry Analysis, Insights and Forecast, 2019-2031
- 5.1. Market Analysis, Insights and Forecast - by System
- 5.1.1. Vendor Neutral Archive
- 5.1.2. Picture Archiving and Communications System (PACS)
- 5.1.3. Other Systems
- 5.2. Market Analysis, Insights and Forecast - by End-User
- 5.2.1. Hospitals
- 5.2.2. Diagnostic Centers
- 5.2.3. Ambulatory Surgery Centers
- 5.3. Market Analysis, Insights and Forecast - by Region
- 5.3.1. North America
- 5.3.2. Europe
- 5.3.3. Asia Pacific
- 5.3.4. Middle East and Africa
- 5.3.5. South America
- 5.1. Market Analysis, Insights and Forecast - by System
- 6. North America Medical Image Exchange Systems Industry Analysis, Insights and Forecast, 2019-2031
- 6.1. Market Analysis, Insights and Forecast - by System
- 6.1.1. Vendor Neutral Archive
- 6.1.2. Picture Archiving and Communications System (PACS)
- 6.1.3. Other Systems
- 6.2. Market Analysis, Insights and Forecast - by End-User
- 6.2.1. Hospitals
- 6.2.2. Diagnostic Centers
- 6.2.3. Ambulatory Surgery Centers
- 6.1. Market Analysis, Insights and Forecast - by System
- 7. Europe Medical Image Exchange Systems Industry Analysis, Insights and Forecast, 2019-2031
- 7.1. Market Analysis, Insights and Forecast - by System
- 7.1.1. Vendor Neutral Archive
- 7.1.2. Picture Archiving and Communications System (PACS)
- 7.1.3. Other Systems
- 7.2. Market Analysis, Insights and Forecast - by End-User
- 7.2.1. Hospitals
- 7.2.2. Diagnostic Centers
- 7.2.3. Ambulatory Surgery Centers
- 7.1. Market Analysis, Insights and Forecast - by System
- 8. Asia Pacific Medical Image Exchange Systems Industry Analysis, Insights and Forecast, 2019-2031
- 8.1. Market Analysis, Insights and Forecast - by System
- 8.1.1. Vendor Neutral Archive
- 8.1.2. Picture Archiving and Communications System (PACS)
- 8.1.3. Other Systems
- 8.2. Market Analysis, Insights and Forecast - by End-User
- 8.2.1. Hospitals
- 8.2.2. Diagnostic Centers
- 8.2.3. Ambulatory Surgery Centers
- 8.1. Market Analysis, Insights and Forecast - by System
- 9. Middle East and Africa Medical Image Exchange Systems Industry Analysis, Insights and Forecast, 2019-2031
- 9.1. Market Analysis, Insights and Forecast - by System
- 9.1.1. Vendor Neutral Archive
- 9.1.2. Picture Archiving and Communications System (PACS)
- 9.1.3. Other Systems
- 9.2. Market Analysis, Insights and Forecast - by End-User
- 9.2.1. Hospitals
- 9.2.2. Diagnostic Centers
- 9.2.3. Ambulatory Surgery Centers
- 9.1. Market Analysis, Insights and Forecast - by System
- 10. South America Medical Image Exchange Systems Industry Analysis, Insights and Forecast, 2019-2031
- 10.1. Market Analysis, Insights and Forecast - by System
- 10.1.1. Vendor Neutral Archive
- 10.1.2. Picture Archiving and Communications System (PACS)
- 10.1.3. Other Systems
- 10.2. Market Analysis, Insights and Forecast - by End-User
- 10.2.1. Hospitals
- 10.2.2. Diagnostic Centers
- 10.2.3. Ambulatory Surgery Centers
- 10.1. Market Analysis, Insights and Forecast - by System
- 11. North America Medical Image Exchange Systems Industry Analysis, Insights and Forecast, 2019-2031
- 11.1. Market Analysis, Insights and Forecast - By Country/Sub-region
- 11.1.1 United States
- 11.1.2 Canada
- 11.1.3 Mexico
- 12. Europe Medical Image Exchange Systems Industry Analysis, Insights and Forecast, 2019-2031
- 12.1. Market Analysis, Insights and Forecast - By Country/Sub-region
- 12.1.1 Germany
- 12.1.2 United Kingdom
- 12.1.3 France
- 12.1.4 Italy
- 12.1.5 Spain
- 12.1.6 Rest of Europe
- 13. Asia Pacific Medical Image Exchange Systems Industry Analysis, Insights and Forecast, 2019-2031
- 13.1. Market Analysis, Insights and Forecast - By Country/Sub-region
- 13.1.1 China
- 13.1.2 Japan
- 13.1.3 India
- 13.1.4 Australia
- 13.1.5 South Korea
- 13.1.6 Rest of Asia Pacific
- 14. Middle East and Africa Medical Image Exchange Systems Industry Analysis, Insights and Forecast, 2019-2031
- 14.1. Market Analysis, Insights and Forecast - By Country/Sub-region
- 14.1.1 GCC
- 14.1.2 South Africa
- 14.1.3 Rest of Middle East and Africa
- 15. South America Medical Image Exchange Systems Industry Analysis, Insights and Forecast, 2019-2031
- 15.1. Market Analysis, Insights and Forecast - By Country/Sub-region
- 15.1.1 Brazil
- 15.1.2 Argentina
- 15.1.3 Rest of South America
- 16. Competitive Analysis
- 16.1. Global Market Share Analysis 2024
- 16.2. Company Profiles
- 16.2.1 IBM Corporation
- 16.2.1.1. Overview
- 16.2.1.2. Products
- 16.2.1.3. SWOT Analysis
- 16.2.1.4. Recent Developments
- 16.2.1.5. Financials (Based on Availability)
- 16.2.2 Siemens Healthineers
- 16.2.2.1. Overview
- 16.2.2.2. Products
- 16.2.2.3. SWOT Analysis
- 16.2.2.4. Recent Developments
- 16.2.2.5. Financials (Based on Availability)
- 16.2.3 GE Healthcare
- 16.2.3.1. Overview
- 16.2.3.2. Products
- 16.2.3.3. SWOT Analysis
- 16.2.3.4. Recent Developments
- 16.2.3.5. Financials (Based on Availability)
- 16.2.4 Dell Technologies Inc
- 16.2.4.1. Overview
- 16.2.4.2. Products
- 16.2.4.3. SWOT Analysis
- 16.2.4.4. Recent Developments
- 16.2.4.5. Financials (Based on Availability)
- 16.2.5 Lexmark International Inc
- 16.2.5.1. Overview
- 16.2.5.2. Products
- 16.2.5.3. SWOT Analysis
- 16.2.5.4. Recent Developments
- 16.2.5.5. Financials (Based on Availability)
- 16.2.6 BridgeHead Software
- 16.2.6.1. Overview
- 16.2.6.2. Products
- 16.2.6.3. SWOT Analysis
- 16.2.6.4. Recent Developments
- 16.2.6.5. Financials (Based on Availability)
- 16.2.7 Koninklijke Philips NV
- 16.2.7.1. Overview
- 16.2.7.2. Products
- 16.2.7.3. SWOT Analysis
- 16.2.7.4. Recent Developments
- 16.2.7.5. Financials (Based on Availability)
- 16.2.8 Carestream Health Inc (Onex Corporation)
- 16.2.8.1. Overview
- 16.2.8.2. Products
- 16.2.8.3. SWOT Analysis
- 16.2.8.4. Recent Developments
- 16.2.8.5. Financials (Based on Availability)
- 16.2.9 McKesson Corporation
- 16.2.9.1. Overview
- 16.2.9.2. Products
- 16.2.9.3. SWOT Analysis
- 16.2.9.4. Recent Developments
- 16.2.9.5. Financials (Based on Availability)
- 16.2.10 Novarad Corporation
- 16.2.10.1. Overview
- 16.2.10.2. Products
- 16.2.10.3. SWOT Analysis
- 16.2.10.4. Recent Developments
- 16.2.10.5. Financials (Based on Availability)
- 16.2.11 Agfa-Gevaert Group
- 16.2.11.1. Overview
- 16.2.11.2. Products
- 16.2.11.3. SWOT Analysis
- 16.2.11.4. Recent Developments
- 16.2.11.5. Financials (Based on Availability)
- 16.2.12 Fujifilm Holdings Corporation
- 16.2.12.1. Overview
- 16.2.12.2. Products
- 16.2.12.3. SWOT Analysis
- 16.2.12.4. Recent Developments
- 16.2.12.5. Financials (Based on Availability)
- 16.2.1 IBM Corporation
List of Figures
- Figure 1: Global Medical Image Exchange Systems Industry Revenue Breakdown (Million, %) by Region 2024 & 2032
- Figure 2: Global Medical Image Exchange Systems Industry Volume Breakdown (K Unit, %) by Region 2024 & 2032
- Figure 3: North America Medical Image Exchange Systems Industry Revenue (Million), by Country 2024 & 2032
- Figure 4: North America Medical Image Exchange Systems Industry Volume (K Unit), by Country 2024 & 2032
- Figure 5: North America Medical Image Exchange Systems Industry Revenue Share (%), by Country 2024 & 2032
- Figure 6: North America Medical Image Exchange Systems Industry Volume Share (%), by Country 2024 & 2032
- Figure 7: Europe Medical Image Exchange Systems Industry Revenue (Million), by Country 2024 & 2032
- Figure 8: Europe Medical Image Exchange Systems Industry Volume (K Unit), by Country 2024 & 2032
- Figure 9: Europe Medical Image Exchange Systems Industry Revenue Share (%), by Country 2024 & 2032
- Figure 10: Europe Medical Image Exchange Systems Industry Volume Share (%), by Country 2024 & 2032
- Figure 11: Asia Pacific Medical Image Exchange Systems Industry Revenue (Million), by Country 2024 & 2032
- Figure 12: Asia Pacific Medical Image Exchange Systems Industry Volume (K Unit), by Country 2024 & 2032
- Figure 13: Asia Pacific Medical Image Exchange Systems Industry Revenue Share (%), by Country 2024 & 2032
- Figure 14: Asia Pacific Medical Image Exchange Systems Industry Volume Share (%), by Country 2024 & 2032
- Figure 15: Middle East and Africa Medical Image Exchange Systems Industry Revenue (Million), by Country 2024 & 2032
- Figure 16: Middle East and Africa Medical Image Exchange Systems Industry Volume (K Unit), by Country 2024 & 2032
- Figure 17: Middle East and Africa Medical Image Exchange Systems Industry Revenue Share (%), by Country 2024 & 2032
- Figure 18: Middle East and Africa Medical Image Exchange Systems Industry Volume Share (%), by Country 2024 & 2032
- Figure 19: South America Medical Image Exchange Systems Industry Revenue (Million), by Country 2024 & 2032
- Figure 20: South America Medical Image Exchange Systems Industry Volume (K Unit), by Country 2024 & 2032
- Figure 21: South America Medical Image Exchange Systems Industry Revenue Share (%), by Country 2024 & 2032
- Figure 22: South America Medical Image Exchange Systems Industry Volume Share (%), by Country 2024 & 2032
- Figure 23: North America Medical Image Exchange Systems Industry Revenue (Million), by System 2024 & 2032
- Figure 24: North America Medical Image Exchange Systems Industry Volume (K Unit), by System 2024 & 2032
- Figure 25: North America Medical Image Exchange Systems Industry Revenue Share (%), by System 2024 & 2032
- Figure 26: North America Medical Image Exchange Systems Industry Volume Share (%), by System 2024 & 2032
- Figure 27: North America Medical Image Exchange Systems Industry Revenue (Million), by End-User 2024 & 2032
- Figure 28: North America Medical Image Exchange Systems Industry Volume (K Unit), by End-User 2024 & 2032
- Figure 29: North America Medical Image Exchange Systems Industry Revenue Share (%), by End-User 2024 & 2032
- Figure 30: North America Medical Image Exchange Systems Industry Volume Share (%), by End-User 2024 & 2032
- Figure 31: North America Medical Image Exchange Systems Industry Revenue (Million), by Country 2024 & 2032
- Figure 32: North America Medical Image Exchange Systems Industry Volume (K Unit), by Country 2024 & 2032
- Figure 33: North America Medical Image Exchange Systems Industry Revenue Share (%), by Country 2024 & 2032
- Figure 34: North America Medical Image Exchange Systems Industry Volume Share (%), by Country 2024 & 2032
- Figure 35: Europe Medical Image Exchange Systems Industry Revenue (Million), by System 2024 & 2032
- Figure 36: Europe Medical Image Exchange Systems Industry Volume (K Unit), by System 2024 & 2032
- Figure 37: Europe Medical Image Exchange Systems Industry Revenue Share (%), by System 2024 & 2032
- Figure 38: Europe Medical Image Exchange Systems Industry Volume Share (%), by System 2024 & 2032
- Figure 39: Europe Medical Image Exchange Systems Industry Revenue (Million), by End-User 2024 & 2032
- Figure 40: Europe Medical Image Exchange Systems Industry Volume (K Unit), by End-User 2024 & 2032
- Figure 41: Europe Medical Image Exchange Systems Industry Revenue Share (%), by End-User 2024 & 2032
- Figure 42: Europe Medical Image Exchange Systems Industry Volume Share (%), by End-User 2024 & 2032
- Figure 43: Europe Medical Image Exchange Systems Industry Revenue (Million), by Country 2024 & 2032
- Figure 44: Europe Medical Image Exchange Systems Industry Volume (K Unit), by Country 2024 & 2032
- Figure 45: Europe Medical Image Exchange Systems Industry Revenue Share (%), by Country 2024 & 2032
- Figure 46: Europe Medical Image Exchange Systems Industry Volume Share (%), by Country 2024 & 2032
- Figure 47: Asia Pacific Medical Image Exchange Systems Industry Revenue (Million), by System 2024 & 2032
- Figure 48: Asia Pacific Medical Image Exchange Systems Industry Volume (K Unit), by System 2024 & 2032
- Figure 49: Asia Pacific Medical Image Exchange Systems Industry Revenue Share (%), by System 2024 & 2032
- Figure 50: Asia Pacific Medical Image Exchange Systems Industry Volume Share (%), by System 2024 & 2032
- Figure 51: Asia Pacific Medical Image Exchange Systems Industry Revenue (Million), by End-User 2024 & 2032
- Figure 52: Asia Pacific Medical Image Exchange Systems Industry Volume (K Unit), by End-User 2024 & 2032
- Figure 53: Asia Pacific Medical Image Exchange Systems Industry Revenue Share (%), by End-User 2024 & 2032
- Figure 54: Asia Pacific Medical Image Exchange Systems Industry Volume Share (%), by End-User 2024 & 2032
- Figure 55: Asia Pacific Medical Image Exchange Systems Industry Revenue (Million), by Country 2024 & 2032
- Figure 56: Asia Pacific Medical Image Exchange Systems Industry Volume (K Unit), by Country 2024 & 2032
- Figure 57: Asia Pacific Medical Image Exchange Systems Industry Revenue Share (%), by Country 2024 & 2032
- Figure 58: Asia Pacific Medical Image Exchange Systems Industry Volume Share (%), by Country 2024 & 2032
- Figure 59: Middle East and Africa Medical Image Exchange Systems Industry Revenue (Million), by System 2024 & 2032
- Figure 60: Middle East and Africa Medical Image Exchange Systems Industry Volume (K Unit), by System 2024 & 2032
- Figure 61: Middle East and Africa Medical Image Exchange Systems Industry Revenue Share (%), by System 2024 & 2032
- Figure 62: Middle East and Africa Medical Image Exchange Systems Industry Volume Share (%), by System 2024 & 2032
- Figure 63: Middle East and Africa Medical Image Exchange Systems Industry Revenue (Million), by End-User 2024 & 2032
- Figure 64: Middle East and Africa Medical Image Exchange Systems Industry Volume (K Unit), by End-User 2024 & 2032
- Figure 65: Middle East and Africa Medical Image Exchange Systems Industry Revenue Share (%), by End-User 2024 & 2032
- Figure 66: Middle East and Africa Medical Image Exchange Systems Industry Volume Share (%), by End-User 2024 & 2032
- Figure 67: Middle East and Africa Medical Image Exchange Systems Industry Revenue (Million), by Country 2024 & 2032
- Figure 68: Middle East and Africa Medical Image Exchange Systems Industry Volume (K Unit), by Country 2024 & 2032
- Figure 69: Middle East and Africa Medical Image Exchange Systems Industry Revenue Share (%), by Country 2024 & 2032
- Figure 70: Middle East and Africa Medical Image Exchange Systems Industry Volume Share (%), by Country 2024 & 2032
- Figure 71: South America Medical Image Exchange Systems Industry Revenue (Million), by System 2024 & 2032
- Figure 72: South America Medical Image Exchange Systems Industry Volume (K Unit), by System 2024 & 2032
- Figure 73: South America Medical Image Exchange Systems Industry Revenue Share (%), by System 2024 & 2032
- Figure 74: South America Medical Image Exchange Systems Industry Volume Share (%), by System 2024 & 2032
- Figure 75: South America Medical Image Exchange Systems Industry Revenue (Million), by End-User 2024 & 2032
- Figure 76: South America Medical Image Exchange Systems Industry Volume (K Unit), by End-User 2024 & 2032
- Figure 77: South America Medical Image Exchange Systems Industry Revenue Share (%), by End-User 2024 & 2032
- Figure 78: South America Medical Image Exchange Systems Industry Volume Share (%), by End-User 2024 & 2032
- Figure 79: South America Medical Image Exchange Systems Industry Revenue (Million), by Country 2024 & 2032
- Figure 80: South America Medical Image Exchange Systems Industry Volume (K Unit), by Country 2024 & 2032
- Figure 81: South America Medical Image Exchange Systems Industry Revenue Share (%), by Country 2024 & 2032
- Figure 82: South America Medical Image Exchange Systems Industry Volume Share (%), by Country 2024 & 2032
List of Tables
- Table 1: Global Medical Image Exchange Systems Industry Revenue Million Forecast, by Region 2019 & 2032
- Table 2: Global Medical Image Exchange Systems Industry Volume K Unit Forecast, by Region 2019 & 2032
- Table 3: Global Medical Image Exchange Systems Industry Revenue Million Forecast, by System 2019 & 2032
- Table 4: Global Medical Image Exchange Systems Industry Volume K Unit Forecast, by System 2019 & 2032
- Table 5: Global Medical Image Exchange Systems Industry Revenue Million Forecast, by End-User 2019 & 2032
- Table 6: Global Medical Image Exchange Systems Industry Volume K Unit Forecast, by End-User 2019 & 2032
- Table 7: Global Medical Image Exchange Systems Industry Revenue Million Forecast, by Region 2019 & 2032
- Table 8: Global Medical Image Exchange Systems Industry Volume K Unit Forecast, by Region 2019 & 2032
- Table 9: Global Medical Image Exchange Systems Industry Revenue Million Forecast, by Country 2019 & 2032
- Table 10: Global Medical Image Exchange Systems Industry Volume K Unit Forecast, by Country 2019 & 2032
- Table 11: United States Medical Image Exchange Systems Industry Revenue (Million) Forecast, by Application 2019 & 2032
- Table 12: United States Medical Image Exchange Systems Industry Volume (K Unit) Forecast, by Application 2019 & 2032
- Table 13: Canada Medical Image Exchange Systems Industry Revenue (Million) Forecast, by Application 2019 & 2032
- Table 14: Canada Medical Image Exchange Systems Industry Volume (K Unit) Forecast, by Application 2019 & 2032
- Table 15: Mexico Medical Image Exchange Systems Industry Revenue (Million) Forecast, by Application 2019 & 2032
- Table 16: Mexico Medical Image Exchange Systems Industry Volume (K Unit) Forecast, by Application 2019 & 2032
- Table 17: Global Medical Image Exchange Systems Industry Revenue Million Forecast, by Country 2019 & 2032
- Table 18: Global Medical Image Exchange Systems Industry Volume K Unit Forecast, by Country 2019 & 2032
- Table 19: Germany Medical Image Exchange Systems Industry Revenue (Million) Forecast, by Application 2019 & 2032
- Table 20: Germany Medical Image Exchange Systems Industry Volume (K Unit) Forecast, by Application 2019 & 2032
- Table 21: United Kingdom Medical Image Exchange Systems Industry Revenue (Million) Forecast, by Application 2019 & 2032
- Table 22: United Kingdom Medical Image Exchange Systems Industry Volume (K Unit) Forecast, by Application 2019 & 2032
- Table 23: France Medical Image Exchange Systems Industry Revenue (Million) Forecast, by Application 2019 & 2032
- Table 24: France Medical Image Exchange Systems Industry Volume (K Unit) Forecast, by Application 2019 & 2032
- Table 25: Italy Medical Image Exchange Systems Industry Revenue (Million) Forecast, by Application 2019 & 2032
- Table 26: Italy Medical Image Exchange Systems Industry Volume (K Unit) Forecast, by Application 2019 & 2032
- Table 27: Spain Medical Image Exchange Systems Industry Revenue (Million) Forecast, by Application 2019 & 2032
- Table 28: Spain Medical Image Exchange Systems Industry Volume (K Unit) Forecast, by Application 2019 & 2032
- Table 29: Rest of Europe Medical Image Exchange Systems Industry Revenue (Million) Forecast, by Application 2019 & 2032
- Table 30: Rest of Europe Medical Image Exchange Systems Industry Volume (K Unit) Forecast, by Application 2019 & 2032
- Table 31: Global Medical Image Exchange Systems Industry Revenue Million Forecast, by Country 2019 & 2032
- Table 32: Global Medical Image Exchange Systems Industry Volume K Unit Forecast, by Country 2019 & 2032
- Table 33: China Medical Image Exchange Systems Industry Revenue (Million) Forecast, by Application 2019 & 2032
- Table 34: China Medical Image Exchange Systems Industry Volume (K Unit) Forecast, by Application 2019 & 2032
- Table 35: Japan Medical Image Exchange Systems Industry Revenue (Million) Forecast, by Application 2019 & 2032
- Table 36: Japan Medical Image Exchange Systems Industry Volume (K Unit) Forecast, by Application 2019 & 2032
- Table 37: India Medical Image Exchange Systems Industry Revenue (Million) Forecast, by Application 2019 & 2032
- Table 38: India Medical Image Exchange Systems Industry Volume (K Unit) Forecast, by Application 2019 & 2032
- Table 39: Australia Medical Image Exchange Systems Industry Revenue (Million) Forecast, by Application 2019 & 2032
- Table 40: Australia Medical Image Exchange Systems Industry Volume (K Unit) Forecast, by Application 2019 & 2032
- Table 41: South Korea Medical Image Exchange Systems Industry Revenue (Million) Forecast, by Application 2019 & 2032
- Table 42: South Korea Medical Image Exchange Systems Industry Volume (K Unit) Forecast, by Application 2019 & 2032
- Table 43: Rest of Asia Pacific Medical Image Exchange Systems Industry Revenue (Million) Forecast, by Application 2019 & 2032
- Table 44: Rest of Asia Pacific Medical Image Exchange Systems Industry Volume (K Unit) Forecast, by Application 2019 & 2032
- Table 45: Global Medical Image Exchange Systems Industry Revenue Million Forecast, by Country 2019 & 2032
- Table 46: Global Medical Image Exchange Systems Industry Volume K Unit Forecast, by Country 2019 & 2032
- Table 47: GCC Medical Image Exchange Systems Industry Revenue (Million) Forecast, by Application 2019 & 2032
- Table 48: GCC Medical Image Exchange Systems Industry Volume (K Unit) Forecast, by Application 2019 & 2032
- Table 49: South Africa Medical Image Exchange Systems Industry Revenue (Million) Forecast, by Application 2019 & 2032
- Table 50: South Africa Medical Image Exchange Systems Industry Volume (K Unit) Forecast, by Application 2019 & 2032
- Table 51: Rest of Middle East and Africa Medical Image Exchange Systems Industry Revenue (Million) Forecast, by Application 2019 & 2032
- Table 52: Rest of Middle East and Africa Medical Image Exchange Systems Industry Volume (K Unit) Forecast, by Application 2019 & 2032
- Table 53: Global Medical Image Exchange Systems Industry Revenue Million Forecast, by Country 2019 & 2032
- Table 54: Global Medical Image Exchange Systems Industry Volume K Unit Forecast, by Country 2019 & 2032
- Table 55: Brazil Medical Image Exchange Systems Industry Revenue (Million) Forecast, by Application 2019 & 2032
- Table 56: Brazil Medical Image Exchange Systems Industry Volume (K Unit) Forecast, by Application 2019 & 2032
- Table 57: Argentina Medical Image Exchange Systems Industry Revenue (Million) Forecast, by Application 2019 & 2032
- Table 58: Argentina Medical Image Exchange Systems Industry Volume (K Unit) Forecast, by Application 2019 & 2032
- Table 59: Rest of South America Medical Image Exchange Systems Industry Revenue (Million) Forecast, by Application 2019 & 2032
- Table 60: Rest of South America Medical Image Exchange Systems Industry Volume (K Unit) Forecast, by Application 2019 & 2032
- Table 61: Global Medical Image Exchange Systems Industry Revenue Million Forecast, by System 2019 & 2032
- Table 62: Global Medical Image Exchange Systems Industry Volume K Unit Forecast, by System 2019 & 2032
- Table 63: Global Medical Image Exchange Systems Industry Revenue Million Forecast, by End-User 2019 & 2032
- Table 64: Global Medical Image Exchange Systems Industry Volume K Unit Forecast, by End-User 2019 & 2032
- Table 65: Global Medical Image Exchange Systems Industry Revenue Million Forecast, by Country 2019 & 2032
- Table 66: Global Medical Image Exchange Systems Industry Volume K Unit Forecast, by Country 2019 & 2032
- Table 67: United States Medical Image Exchange Systems Industry Revenue (Million) Forecast, by Application 2019 & 2032
- Table 68: United States Medical Image Exchange Systems Industry Volume (K Unit) Forecast, by Application 2019 & 2032
- Table 69: Canada Medical Image Exchange Systems Industry Revenue (Million) Forecast, by Application 2019 & 2032
- Table 70: Canada Medical Image Exchange Systems Industry Volume (K Unit) Forecast, by Application 2019 & 2032
- Table 71: Mexico Medical Image Exchange Systems Industry Revenue (Million) Forecast, by Application 2019 & 2032
- Table 72: Mexico Medical Image Exchange Systems Industry Volume (K Unit) Forecast, by Application 2019 & 2032
- Table 73: Global Medical Image Exchange Systems Industry Revenue Million Forecast, by System 2019 & 2032
- Table 74: Global Medical Image Exchange Systems Industry Volume K Unit Forecast, by System 2019 & 2032
- Table 75: Global Medical Image Exchange Systems Industry Revenue Million Forecast, by End-User 2019 & 2032
- Table 76: Global Medical Image Exchange Systems Industry Volume K Unit Forecast, by End-User 2019 & 2032
- Table 77: Global Medical Image Exchange Systems Industry Revenue Million Forecast, by Country 2019 & 2032
- Table 78: Global Medical Image Exchange Systems Industry Volume K Unit Forecast, by Country 2019 & 2032
- Table 79: Germany Medical Image Exchange Systems Industry Revenue (Million) Forecast, by Application 2019 & 2032
- Table 80: Germany Medical Image Exchange Systems Industry Volume (K Unit) Forecast, by Application 2019 & 2032
- Table 81: United Kingdom Medical Image Exchange Systems Industry Revenue (Million) Forecast, by Application 2019 & 2032
- Table 82: United Kingdom Medical Image Exchange Systems Industry Volume (K Unit) Forecast, by Application 2019 & 2032
- Table 83: France Medical Image Exchange Systems Industry Revenue (Million) Forecast, by Application 2019 & 2032
- Table 84: France Medical Image Exchange Systems Industry Volume (K Unit) Forecast, by Application 2019 & 2032
- Table 85: Italy Medical Image Exchange Systems Industry Revenue (Million) Forecast, by Application 2019 & 2032
- Table 86: Italy Medical Image Exchange Systems Industry Volume (K Unit) Forecast, by Application 2019 & 2032
- Table 87: Spain Medical Image Exchange Systems Industry Revenue (Million) Forecast, by Application 2019 & 2032
- Table 88: Spain Medical Image Exchange Systems Industry Volume (K Unit) Forecast, by Application 2019 & 2032
- Table 89: Rest of Europe Medical Image Exchange Systems Industry Revenue (Million) Forecast, by Application 2019 & 2032
- Table 90: Rest of Europe Medical Image Exchange Systems Industry Volume (K Unit) Forecast, by Application 2019 & 2032
- Table 91: Global Medical Image Exchange Systems Industry Revenue Million Forecast, by System 2019 & 2032
- Table 92: Global Medical Image Exchange Systems Industry Volume K Unit Forecast, by System 2019 & 2032
- Table 93: Global Medical Image Exchange Systems Industry Revenue Million Forecast, by End-User 2019 & 2032
- Table 94: Global Medical Image Exchange Systems Industry Volume K Unit Forecast, by End-User 2019 & 2032
- Table 95: Global Medical Image Exchange Systems Industry Revenue Million Forecast, by Country 2019 & 2032
- Table 96: Global Medical Image Exchange Systems Industry Volume K Unit Forecast, by Country 2019 & 2032
- Table 97: China Medical Image Exchange Systems Industry Revenue (Million) Forecast, by Application 2019 & 2032
- Table 98: China Medical Image Exchange Systems Industry Volume (K Unit) Forecast, by Application 2019 & 2032
- Table 99: Japan Medical Image Exchange Systems Industry Revenue (Million) Forecast, by Application 2019 & 2032
- Table 100: Japan Medical Image Exchange Systems Industry Volume (K Unit) Forecast, by Application 2019 & 2032
- Table 101: India Medical Image Exchange Systems Industry Revenue (Million) Forecast, by Application 2019 & 2032
- Table 102: India Medical Image Exchange Systems Industry Volume (K Unit) Forecast, by Application 2019 & 2032
- Table 103: Australia Medical Image Exchange Systems Industry Revenue (Million) Forecast, by Application 2019 & 2032
- Table 104: Australia Medical Image Exchange Systems Industry Volume (K Unit) Forecast, by Application 2019 & 2032
- Table 105: South Korea Medical Image Exchange Systems Industry Revenue (Million) Forecast, by Application 2019 & 2032
- Table 106: South Korea Medical Image Exchange Systems Industry Volume (K Unit) Forecast, by Application 2019 & 2032
- Table 107: Rest of Asia Pacific Medical Image Exchange Systems Industry Revenue (Million) Forecast, by Application 2019 & 2032
- Table 108: Rest of Asia Pacific Medical Image Exchange Systems Industry Volume (K Unit) Forecast, by Application 2019 & 2032
- Table 109: Global Medical Image Exchange Systems Industry Revenue Million Forecast, by System 2019 & 2032
- Table 110: Global Medical Image Exchange Systems Industry Volume K Unit Forecast, by System 2019 & 2032
- Table 111: Global Medical Image Exchange Systems Industry Revenue Million Forecast, by End-User 2019 & 2032
- Table 112: Global Medical Image Exchange Systems Industry Volume K Unit Forecast, by End-User 2019 & 2032
- Table 113: Global Medical Image Exchange Systems Industry Revenue Million Forecast, by Country 2019 & 2032
- Table 114: Global Medical Image Exchange Systems Industry Volume K Unit Forecast, by Country 2019 & 2032
- Table 115: GCC Medical Image Exchange Systems Industry Revenue (Million) Forecast, by Application 2019 & 2032
- Table 116: GCC Medical Image Exchange Systems Industry Volume (K Unit) Forecast, by Application 2019 & 2032
- Table 117: South Africa Medical Image Exchange Systems Industry Revenue (Million) Forecast, by Application 2019 & 2032
- Table 118: South Africa Medical Image Exchange Systems Industry Volume (K Unit) Forecast, by Application 2019 & 2032
- Table 119: Rest of Middle East and Africa Medical Image Exchange Systems Industry Revenue (Million) Forecast, by Application 2019 & 2032
- Table 120: Rest of Middle East and Africa Medical Image Exchange Systems Industry Volume (K Unit) Forecast, by Application 2019 & 2032
- Table 121: Global Medical Image Exchange Systems Industry Revenue Million Forecast, by System 2019 & 2032
- Table 122: Global Medical Image Exchange Systems Industry Volume K Unit Forecast, by System 2019 & 2032
- Table 123: Global Medical Image Exchange Systems Industry Revenue Million Forecast, by End-User 2019 & 2032
- Table 124: Global Medical Image Exchange Systems Industry Volume K Unit Forecast, by End-User 2019 & 2032
- Table 125: Global Medical Image Exchange Systems Industry Revenue Million Forecast, by Country 2019 & 2032
- Table 126: Global Medical Image Exchange Systems Industry Volume K Unit Forecast, by Country 2019 & 2032
- Table 127: Brazil Medical Image Exchange Systems Industry Revenue (Million) Forecast, by Application 2019 & 2032
- Table 128: Brazil Medical Image Exchange Systems Industry Volume (K Unit) Forecast, by Application 2019 & 2032
- Table 129: Argentina Medical Image Exchange Systems Industry Revenue (Million) Forecast, by Application 2019 & 2032
- Table 130: Argentina Medical Image Exchange Systems Industry Volume (K Unit) Forecast, by Application 2019 & 2032
- Table 131: Rest of South America Medical Image Exchange Systems Industry Revenue (Million) Forecast, by Application 2019 & 2032
- Table 132: Rest of South America Medical Image Exchange Systems Industry Volume (K Unit) Forecast, by Application 2019 & 2032
Frequently Asked Questions
1. What is the projected Compound Annual Growth Rate (CAGR) of the Medical Image Exchange Systems Industry?
The projected CAGR is approximately 6.96%.
2. Which companies are prominent players in the Medical Image Exchange Systems Industry?
Key companies in the market include IBM Corporation, Siemens Healthineers, GE Healthcare, Dell Technologies Inc , Lexmark International Inc, BridgeHead Software, Koninklijke Philips NV, Carestream Health Inc (Onex Corporation), McKesson Corporation, Novarad Corporation, Agfa-Gevaert Group, Fujifilm Holdings Corporation.
3. What are the main segments of the Medical Image Exchange Systems Industry?
The market segments include System, End-User.
4. Can you provide details about the market size?
The market size is estimated to be USD 4.59 Million as of 2022.
5. What are some drivers contributing to market growth?
Technological Innovations in the Diagnostic Imaging and Image Management; Rising Prevalence of Chronic Diseases; Emergence of Big Data in Healthcare.
6. What are the notable trends driving market growth?
Picture Archiving and Communications Systems (PACS) is Expected to Record Notable CAGR in the Market During the Forecast Period.
7. Are there any restraints impacting market growth?
Cost Associated With Implementation of Medical Imaging Management Solutions; Decrease In the Supply of SPECT and PET Systems due to the Shortage of Radioisotopes.
8. Can you provide examples of recent developments in the market?
March 2022: Intelerad Medical Systems launched its new Enterprise Imaging and Informatics Suite at the 2022 HIMSS Global Health Conference & Exhibition. Intelerad's suite empowers hospitals and health systems to break down siloed data and create a seamless, vendor-neutral information hub, integrating vital patient data across the entire healthcare ecosystem.
9. What pricing options are available for accessing the report?
Pricing options include single-user, multi-user, and enterprise licenses priced at USD 4750, USD 5250, and USD 8750 respectively.
10. Is the market size provided in terms of value or volume?
The market size is provided in terms of value, measured in Million and volume, measured in K Unit.
11. Are there any specific market keywords associated with the report?
Yes, the market keyword associated with the report is "Medical Image Exchange Systems Industry," which aids in identifying and referencing the specific market segment covered.
12. How do I determine which pricing option suits my needs best?
The pricing options vary based on user requirements and access needs. Individual users may opt for single-user licenses, while businesses requiring broader access may choose multi-user or enterprise licenses for cost-effective access to the report.
13. Are there any additional resources or data provided in the Medical Image Exchange Systems Industry report?
While the report offers comprehensive insights, it's advisable to review the specific contents or supplementary materials provided to ascertain if additional resources or data are available.
14. How can I stay updated on further developments or reports in the Medical Image Exchange Systems Industry?
To stay informed about further developments, trends, and reports in the Medical Image Exchange Systems Industry, consider subscribing to industry newsletters, following relevant companies and organizations, or regularly checking reputable industry news sources and publications.
Methodology
Step 1 - Identification of Relevant Samples Size from Population Database


Step 2 - Approaches for Defining Global Market Size (Value, Volume* & Price*)

Note*: In applicable scenarios
Step 3 - Data Sources
Primary Research
- Web Analytics
- Survey Reports
- Research Institute
- Latest Research Reports
- Opinion Leaders
Secondary Research
- Annual Reports
- White Paper
- Latest Press Release
- Industry Association
- Paid Database
- Investor Presentations

Step 4 - Data Triangulation
Involves using different sources of information in order to increase the validity of a study
These sources are likely to be stakeholders in a program - participants, other researchers, program staff, other community members, and so on.
Then we put all data in single framework & apply various statistical tools to find out the dynamic on the market.
During the analysis stage, feedback from the stakeholder groups would be compared to determine areas of agreement as well as areas of divergence


