
Key Insights
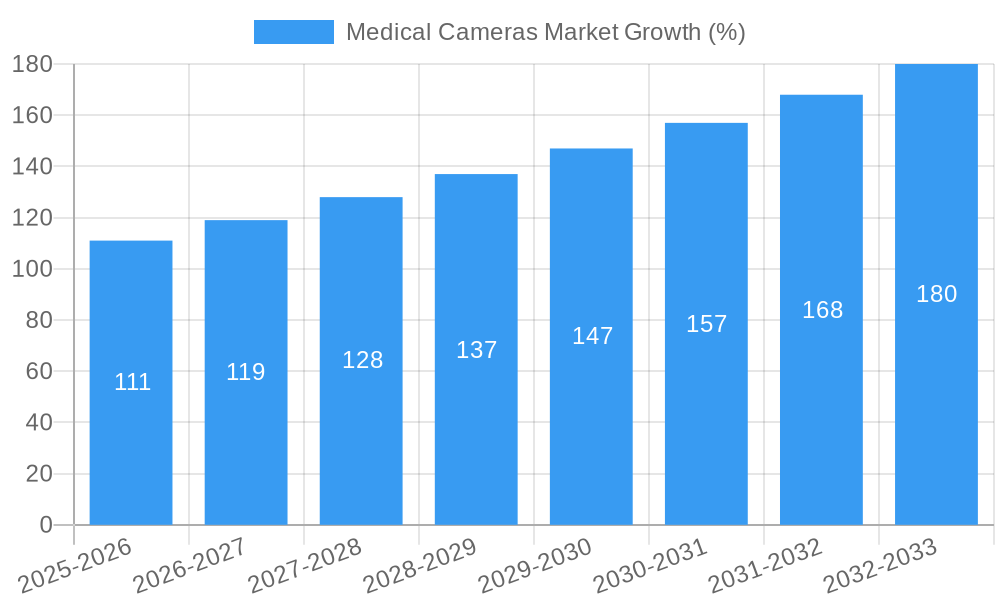
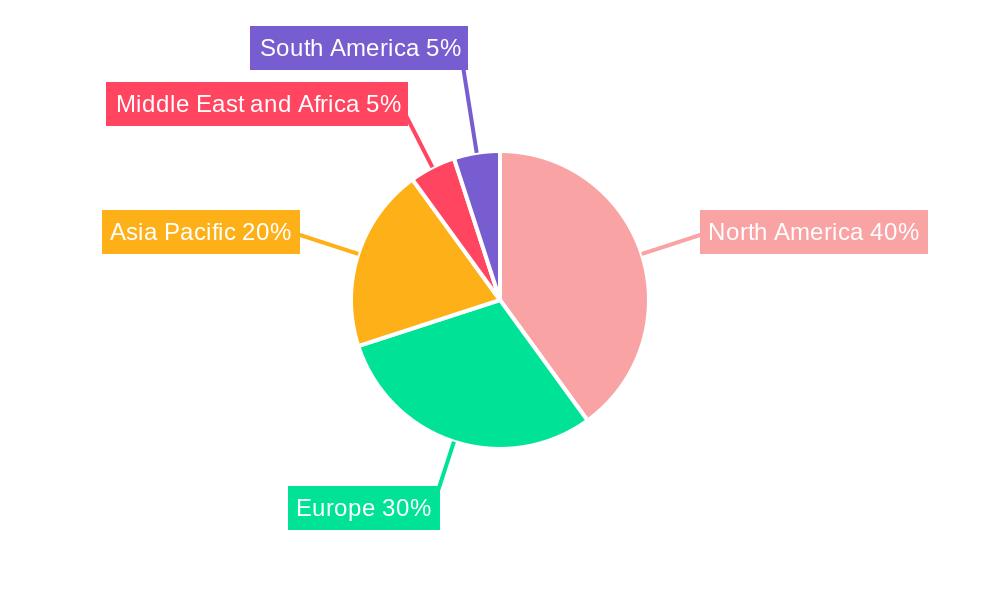
The global medical cameras market is experiencing robust growth, driven by the increasing prevalence of chronic diseases necessitating advanced diagnostic and surgical procedures. The market's 7.60% CAGR from 2019-2024 suggests a substantial expansion, projected to continue in the forecast period (2025-2033). Technological advancements, particularly in high-definition (HD) and 4K imaging, are key drivers, enabling improved image clarity and precision for minimally invasive surgeries and detailed diagnostics. The rising adoption of minimally invasive surgical techniques further fuels market growth, as these procedures heavily rely on real-time, high-quality visual guidance provided by medical cameras. Segmentation reveals strong growth across various types, with dental, dermatology, and endoscopy cameras leading the way due to their widespread application and increasing demand. High-definition cameras are gaining significant traction over standard-definition cameras due to their superior image quality and improved diagnostic capabilities. The market is geographically diverse, with North America and Europe holding a significant share, attributable to advanced healthcare infrastructure and higher adoption rates. However, Asia Pacific is expected to show significant growth in the coming years due to increasing healthcare expenditure and rising disposable incomes.
Market restraints include the high initial investment costs associated with advanced medical cameras and the need for specialized training for their efficient operation. However, ongoing technological improvements are leading to more affordable and user-friendly systems, potentially mitigating this constraint. The competitive landscape is characterized by both established players and emerging companies, fostering innovation and driving down costs, further benefiting market expansion. Key players are focusing on strategic partnerships, acquisitions, and product development to maintain their competitive edge. The market is expected to see continued growth, fueled by technological innovations and the increasing demand for improved diagnostic and surgical capabilities. The expanding global elderly population further contributes to the growth, as age-related diseases often require advanced imaging techniques.
This in-depth report provides a comprehensive analysis of the global Medical Cameras Market, covering the period from 2019 to 2033. It offers valuable insights into market size, segmentation, growth drivers, challenges, competitive dynamics, and future outlook. The report is essential for industry stakeholders, investors, and researchers seeking a thorough understanding of this dynamic market. The base year for this report is 2025, with estimations for 2025 and forecasts spanning from 2025 to 2033, while the historical period covered is 2019-2024.
Medical Cameras Market Structure & Competitive Dynamics
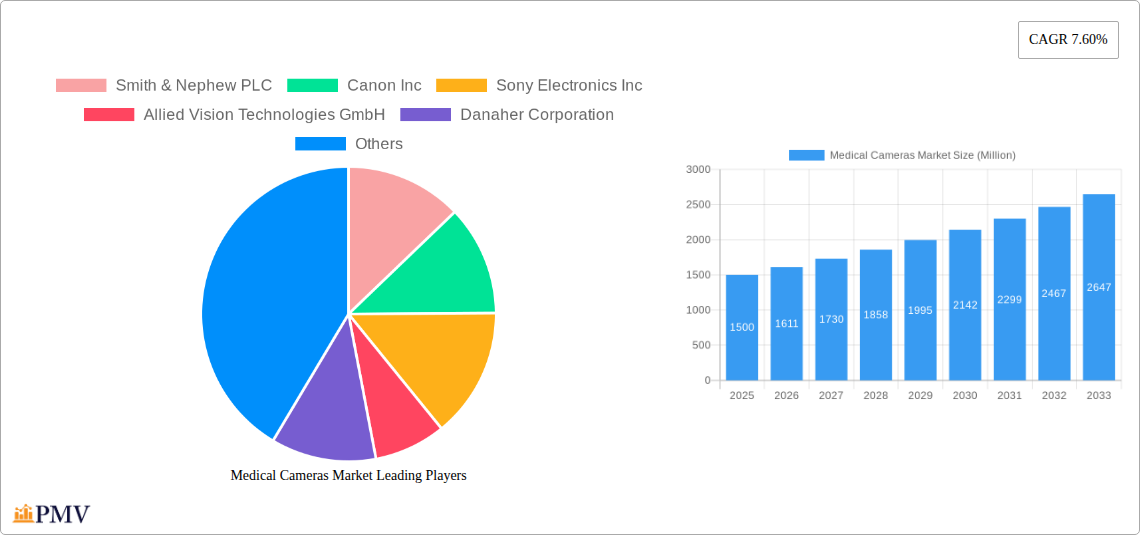
The Medical Cameras Market exhibits a moderately concentrated structure, with several key players holding significant market share. The market is characterized by a dynamic innovation ecosystem, driven by advancements in imaging technology, miniaturization, and wireless connectivity. Stringent regulatory frameworks governing medical device approvals impact market entry and growth. The market faces competition from substitute technologies, such as ultrasound and MRI, though the advantages of medical cameras in specific procedures maintain their demand. End-user trends, particularly the growing adoption of minimally invasive surgeries and the increasing preference for high-definition imaging, significantly influence market growth. Mergers and acquisitions (M&A) play a crucial role in shaping the competitive landscape. For example, the M&A deal value in 2024 is estimated at xx Million, driving consolidation and technological integration. Market share distribution among the top 5 players is approximately 60%, with Smith & Nephew PLC, Canon Inc, Sony Electronics Inc, Allied Vision Technologies GmbH, and Danaher Corporation leading the pack. Other key players include: Richard und Annemarie Wolf Stiftung (Richard Wolf GmbH), Carestream Dental LLC, Carl Zeiss AG, Topcon Corporation, Stryker Corporation, Canfield Scientific Inc, and Olympus Corporation. The average market share for a single company is around 12%.
Medical Cameras Market Industry Trends & Insights
The global Medical Cameras Market is poised for significant growth, projected to reach xx Million by 2033, exhibiting a CAGR of xx% during the forecast period (2025-2033). This growth is fueled by several factors, including technological advancements leading to improved image quality, increased adoption of minimally invasive surgical procedures, rising prevalence of chronic diseases requiring frequent imaging, and expanding healthcare infrastructure in emerging economies. Technological disruptions, such as the integration of artificial intelligence (AI) and machine learning (ML) for image analysis and improved diagnostic capabilities, are reshaping the market landscape. Consumer preferences are shifting towards high-definition, wireless, and user-friendly cameras. Competitive dynamics are characterized by intense R&D efforts, strategic partnerships, and product differentiation. Market penetration of high-definition cameras is projected to reach xx% by 2033, significantly surpassing standard-definition cameras.
Dominant Markets & Segments in Medical Cameras Market
The North American region currently dominates the Medical Cameras Market, driven by robust healthcare infrastructure, high technological adoption rates, and favorable regulatory environments. Within this region, the United States holds the largest market share. Key drivers for this dominance include strong economic conditions, substantial investments in healthcare technology, and a high prevalence of chronic diseases.
By Type: Ophthalmology cameras and endoscopy cameras are currently the leading segments, experiencing strong growth due to the increasing demand for minimally invasive procedures and advanced diagnostic capabilities. Dental cameras are showing steady growth due to increasing demand in dental clinics and improvements in digital imaging. The surgical microscopy camera segment is expected to show the fastest growth.
By Resolution: High-definition cameras are rapidly gaining market share, owing to their superior image quality and enhanced diagnostic capabilities. This segment's growth is exceeding that of standard-definition cameras significantly.
By End-User: Hospitals constitute the largest segment, followed by specialty clinics. The ambulatory surgery centers segment is expected to witness high growth due to the rising preference for outpatient procedures.
Medical Cameras Market Product Innovations
Recent product innovations focus on enhancing image quality, improving portability, incorporating wireless capabilities, and integrating advanced features such as AI-powered image analysis. This trend caters to the growing demand for efficient, cost-effective, and high-quality medical imaging solutions, aligning with the needs of both healthcare professionals and patients. Examples include the launch of high-definition wireless endoscopy cameras and advanced dermatology cameras with improved imaging capabilities.
Report Segmentation & Scope
This report segments the Medical Cameras Market by type (Dental Cameras, Dermatology Cameras, Endoscopy Cameras, Ophthalmology Cameras, Surgical Microscopy Cameras, Other Cameras), resolution (Standard-Definition Cameras, High-Definition Cameras), and end-user (Hospitals, Specialty Clinics, Ambulatory Surgery Centers, Other End-Users). Each segment is analyzed in detail, providing insights into market size, growth projections, and competitive dynamics. The high-definition camera segment demonstrates the highest growth projection due to its superior image quality and wider application. The endoscopy cameras segment will lead in the “by type” segmentation due to the increasing number of minimally invasive surgical procedures. Hospitals remain the largest end-user segment.
Key Drivers of Medical Cameras Market Growth
The Medical Cameras Market is propelled by several key factors: advancements in imaging technologies offering superior image quality and enhanced diagnostic capabilities; the increasing adoption of minimally invasive surgical procedures; the rising prevalence of chronic diseases requiring frequent imaging; substantial investments in healthcare infrastructure in both developed and developing nations; and favorable regulatory frameworks supporting the adoption of advanced medical imaging technologies. Government initiatives promoting digital healthcare are also driving market growth.
Challenges in the Medical Cameras Market Sector
The Medical Cameras Market faces challenges including stringent regulatory approvals for new medical devices, potential supply chain disruptions impacting production and delivery times, and intense competition among established players and new entrants. High initial investment costs for advanced camera systems and the need for skilled professionals to operate and maintain these systems also pose challenges. These factors collectively exert pressure on market growth and profitability.
Leading Players in the Medical Cameras Market Market
- Smith & Nephew PLC
- Canon Inc
- Sony Electronics Inc
- Allied Vision Technologies GmbH
- Danaher Corporation
- Richard und Annemarie Wolf Stiftung (Richard Wolf GmbH)
- Carestream Dental LLC
- Carl Zeiss AG
- Topcon Corporation
- Stryker Corporation
- Canfield Scientific Inc
- Olympus Corporation
Key Developments in Medical Cameras Market Sector
- June 2022: Casio Computer Co., Ltd. launched the DZ-D100 dermatology camera and DZ-S50 dermatology scope in Europe, expanding its presence in the dermatology imaging market.
- March 2022: Endoluxe launched a high-definition wireless endoscopy camera, the TowerTech, enhancing visualization during endoscopic surgical procedures. This innovation significantly improved surgical precision and efficiency.
Strategic Medical Cameras Market Market Outlook
The Medical Cameras Market presents significant growth opportunities, driven by continuous technological advancements, increasing healthcare expenditure, and the growing demand for minimally invasive procedures. Strategic partnerships, mergers and acquisitions, and expansion into emerging markets represent key growth accelerators. Focus on developing innovative products with enhanced features, such as AI-powered image analysis, will be crucial for success in this competitive market.
Medical Cameras Market Segmentation
-
1. Type
- 1.1. Dental Cameras
- 1.2. Dermatology Cameras
- 1.3. Endoscopy Cameras
- 1.4. Ophthalmology Cameras
- 1.5. Surgical Microscopy Cameras
- 1.6. Other Cameras
-
2. Resolution
- 2.1. Standard-Definition Cameras
- 2.2. High-Definition Cameras
-
3. End-User
- 3.1. Hospitals
- 3.2. Specialty Clinics
- 3.3. Ambulatory Surgery Centers
- 3.4. Other End-Users
Medical Cameras Market Segmentation By Geography
-
1. North America
- 1.1. United States
- 1.2. Canada
- 1.3. Mexico
-
2. Europe
- 2.1. Germany
- 2.2. United Kingdom
- 2.3. France
- 2.4. Italy
- 2.5. Spain
- 2.6. Rest of Europe
-
3. Asia Pacific
- 3.1. China
- 3.2. Japan
- 3.3. India
- 3.4. Australia
- 3.5. South Korea
- 3.6. Rest of Asia Pacific
-
4. Middle East and Africa
- 4.1. GCC
- 4.2. South Africa
- 4.3. Rest of Middle East and Africa
-
5. South America
- 5.1. Brazil
- 5.2. Argentina
- 5.3. Rest of South America
Medical Cameras Market REPORT HIGHLIGHTS
| Aspects | Details |
|---|---|
| Study Period | 2019-2033 |
| Base Year | 2024 |
| Estimated Year | 2025 |
| Forecast Period | 2025-2033 |
| Historical Period | 2019-2024 |
| Growth Rate | CAGR of 7.60% from 2019-2033 |
| Segmentation |
|
Table of Contents
- 1. Introduction
- 1.1. Research Scope
- 1.2. Market Segmentation
- 1.3. Research Methodology
- 1.4. Definitions and Assumptions
- 2. Executive Summary
- 2.1. Introduction
- 3. Market Dynamics
- 3.1. Introduction
- 3.2. Market Drivers
- 3.2.1. Rising Demand for High-definition Visuals in Surgical Procedures and Advancement in Medical Cameras; Growing Use of Medical Cameras and Microscopes for Surgeries
- 3.3. Market Restrains
- 3.3.1. High Cost and Requirement of Substantial Investment
- 3.4. Market Trends
- 3.4.1. Endoscopy Cameras Segment to is Expected to Witness Significant Growth over the Forecast Period.
- 4. Market Factor Analysis
- 4.1. Porters Five Forces
- 4.2. Supply/Value Chain
- 4.3. PESTEL analysis
- 4.4. Market Entropy
- 4.5. Patent/Trademark Analysis
- 5. Global Medical Cameras Market Analysis, Insights and Forecast, 2019-2031
- 5.1. Market Analysis, Insights and Forecast - by Type
- 5.1.1. Dental Cameras
- 5.1.2. Dermatology Cameras
- 5.1.3. Endoscopy Cameras
- 5.1.4. Ophthalmology Cameras
- 5.1.5. Surgical Microscopy Cameras
- 5.1.6. Other Cameras
- 5.2. Market Analysis, Insights and Forecast - by Resolution
- 5.2.1. Standard-Definition Cameras
- 5.2.2. High-Definition Cameras
- 5.3. Market Analysis, Insights and Forecast - by End-User
- 5.3.1. Hospitals
- 5.3.2. Specialty Clinics
- 5.3.3. Ambulatory Surgery Centers
- 5.3.4. Other End-Users
- 5.4. Market Analysis, Insights and Forecast - by Region
- 5.4.1. North America
- 5.4.2. Europe
- 5.4.3. Asia Pacific
- 5.4.4. Middle East and Africa
- 5.4.5. South America
- 5.1. Market Analysis, Insights and Forecast - by Type
- 6. North America Medical Cameras Market Analysis, Insights and Forecast, 2019-2031
- 6.1. Market Analysis, Insights and Forecast - by Type
- 6.1.1. Dental Cameras
- 6.1.2. Dermatology Cameras
- 6.1.3. Endoscopy Cameras
- 6.1.4. Ophthalmology Cameras
- 6.1.5. Surgical Microscopy Cameras
- 6.1.6. Other Cameras
- 6.2. Market Analysis, Insights and Forecast - by Resolution
- 6.2.1. Standard-Definition Cameras
- 6.2.2. High-Definition Cameras
- 6.3. Market Analysis, Insights and Forecast - by End-User
- 6.3.1. Hospitals
- 6.3.2. Specialty Clinics
- 6.3.3. Ambulatory Surgery Centers
- 6.3.4. Other End-Users
- 6.1. Market Analysis, Insights and Forecast - by Type
- 7. Europe Medical Cameras Market Analysis, Insights and Forecast, 2019-2031
- 7.1. Market Analysis, Insights and Forecast - by Type
- 7.1.1. Dental Cameras
- 7.1.2. Dermatology Cameras
- 7.1.3. Endoscopy Cameras
- 7.1.4. Ophthalmology Cameras
- 7.1.5. Surgical Microscopy Cameras
- 7.1.6. Other Cameras
- 7.2. Market Analysis, Insights and Forecast - by Resolution
- 7.2.1. Standard-Definition Cameras
- 7.2.2. High-Definition Cameras
- 7.3. Market Analysis, Insights and Forecast - by End-User
- 7.3.1. Hospitals
- 7.3.2. Specialty Clinics
- 7.3.3. Ambulatory Surgery Centers
- 7.3.4. Other End-Users
- 7.1. Market Analysis, Insights and Forecast - by Type
- 8. Asia Pacific Medical Cameras Market Analysis, Insights and Forecast, 2019-2031
- 8.1. Market Analysis, Insights and Forecast - by Type
- 8.1.1. Dental Cameras
- 8.1.2. Dermatology Cameras
- 8.1.3. Endoscopy Cameras
- 8.1.4. Ophthalmology Cameras
- 8.1.5. Surgical Microscopy Cameras
- 8.1.6. Other Cameras
- 8.2. Market Analysis, Insights and Forecast - by Resolution
- 8.2.1. Standard-Definition Cameras
- 8.2.2. High-Definition Cameras
- 8.3. Market Analysis, Insights and Forecast - by End-User
- 8.3.1. Hospitals
- 8.3.2. Specialty Clinics
- 8.3.3. Ambulatory Surgery Centers
- 8.3.4. Other End-Users
- 8.1. Market Analysis, Insights and Forecast - by Type
- 9. Middle East and Africa Medical Cameras Market Analysis, Insights and Forecast, 2019-2031
- 9.1. Market Analysis, Insights and Forecast - by Type
- 9.1.1. Dental Cameras
- 9.1.2. Dermatology Cameras
- 9.1.3. Endoscopy Cameras
- 9.1.4. Ophthalmology Cameras
- 9.1.5. Surgical Microscopy Cameras
- 9.1.6. Other Cameras
- 9.2. Market Analysis, Insights and Forecast - by Resolution
- 9.2.1. Standard-Definition Cameras
- 9.2.2. High-Definition Cameras
- 9.3. Market Analysis, Insights and Forecast - by End-User
- 9.3.1. Hospitals
- 9.3.2. Specialty Clinics
- 9.3.3. Ambulatory Surgery Centers
- 9.3.4. Other End-Users
- 9.1. Market Analysis, Insights and Forecast - by Type
- 10. South America Medical Cameras Market Analysis, Insights and Forecast, 2019-2031
- 10.1. Market Analysis, Insights and Forecast - by Type
- 10.1.1. Dental Cameras
- 10.1.2. Dermatology Cameras
- 10.1.3. Endoscopy Cameras
- 10.1.4. Ophthalmology Cameras
- 10.1.5. Surgical Microscopy Cameras
- 10.1.6. Other Cameras
- 10.2. Market Analysis, Insights and Forecast - by Resolution
- 10.2.1. Standard-Definition Cameras
- 10.2.2. High-Definition Cameras
- 10.3. Market Analysis, Insights and Forecast - by End-User
- 10.3.1. Hospitals
- 10.3.2. Specialty Clinics
- 10.3.3. Ambulatory Surgery Centers
- 10.3.4. Other End-Users
- 10.1. Market Analysis, Insights and Forecast - by Type
- 11. North America Medical Cameras Market Analysis, Insights and Forecast, 2019-2031
- 11.1. Market Analysis, Insights and Forecast - By Country/Sub-region
- 11.1.1 United States
- 11.1.2 Canada
- 11.1.3 Mexico
- 12. Europe Medical Cameras Market Analysis, Insights and Forecast, 2019-2031
- 12.1. Market Analysis, Insights and Forecast - By Country/Sub-region
- 12.1.1 Germany
- 12.1.2 United Kingdom
- 12.1.3 France
- 12.1.4 Italy
- 12.1.5 Spain
- 12.1.6 Rest of Europe
- 13. Asia Pacific Medical Cameras Market Analysis, Insights and Forecast, 2019-2031
- 13.1. Market Analysis, Insights and Forecast - By Country/Sub-region
- 13.1.1 China
- 13.1.2 Japan
- 13.1.3 India
- 13.1.4 Australia
- 13.1.5 South Korea
- 13.1.6 Rest of Asia Pacific
- 14. Middle East and Africa Medical Cameras Market Analysis, Insights and Forecast, 2019-2031
- 14.1. Market Analysis, Insights and Forecast - By Country/Sub-region
- 14.1.1 GCC
- 14.1.2 South Africa
- 14.1.3 Rest of Middle East and Africa
- 15. South America Medical Cameras Market Analysis, Insights and Forecast, 2019-2031
- 15.1. Market Analysis, Insights and Forecast - By Country/Sub-region
- 15.1.1 Brazil
- 15.1.2 Argentina
- 15.1.3 Rest of South America
- 16. Competitive Analysis
- 16.1. Global Market Share Analysis 2024
- 16.2. Company Profiles
- 16.2.1 Smith & Nephew PLC
- 16.2.1.1. Overview
- 16.2.1.2. Products
- 16.2.1.3. SWOT Analysis
- 16.2.1.4. Recent Developments
- 16.2.1.5. Financials (Based on Availability)
- 16.2.2 Canon Inc
- 16.2.2.1. Overview
- 16.2.2.2. Products
- 16.2.2.3. SWOT Analysis
- 16.2.2.4. Recent Developments
- 16.2.2.5. Financials (Based on Availability)
- 16.2.3 Sony Electronics Inc
- 16.2.3.1. Overview
- 16.2.3.2. Products
- 16.2.3.3. SWOT Analysis
- 16.2.3.4. Recent Developments
- 16.2.3.5. Financials (Based on Availability)
- 16.2.4 Allied Vision Technologies GmbH
- 16.2.4.1. Overview
- 16.2.4.2. Products
- 16.2.4.3. SWOT Analysis
- 16.2.4.4. Recent Developments
- 16.2.4.5. Financials (Based on Availability)
- 16.2.5 Danaher Corporation
- 16.2.5.1. Overview
- 16.2.5.2. Products
- 16.2.5.3. SWOT Analysis
- 16.2.5.4. Recent Developments
- 16.2.5.5. Financials (Based on Availability)
- 16.2.6 Richard und Annemarie Wolf Stiftung (Richard Wolf GmbH)
- 16.2.6.1. Overview
- 16.2.6.2. Products
- 16.2.6.3. SWOT Analysis
- 16.2.6.4. Recent Developments
- 16.2.6.5. Financials (Based on Availability)
- 16.2.7 Carestream Dental LLC
- 16.2.7.1. Overview
- 16.2.7.2. Products
- 16.2.7.3. SWOT Analysis
- 16.2.7.4. Recent Developments
- 16.2.7.5. Financials (Based on Availability)
- 16.2.8 Carl Zeiss AG
- 16.2.8.1. Overview
- 16.2.8.2. Products
- 16.2.8.3. SWOT Analysis
- 16.2.8.4. Recent Developments
- 16.2.8.5. Financials (Based on Availability)
- 16.2.9 Topcon Corporation
- 16.2.9.1. Overview
- 16.2.9.2. Products
- 16.2.9.3. SWOT Analysis
- 16.2.9.4. Recent Developments
- 16.2.9.5. Financials (Based on Availability)
- 16.2.10 Stryker Corporation
- 16.2.10.1. Overview
- 16.2.10.2. Products
- 16.2.10.3. SWOT Analysis
- 16.2.10.4. Recent Developments
- 16.2.10.5. Financials (Based on Availability)
- 16.2.11 Canfield Scientific Inc
- 16.2.11.1. Overview
- 16.2.11.2. Products
- 16.2.11.3. SWOT Analysis
- 16.2.11.4. Recent Developments
- 16.2.11.5. Financials (Based on Availability)
- 16.2.12 Olympus Corporation
- 16.2.12.1. Overview
- 16.2.12.2. Products
- 16.2.12.3. SWOT Analysis
- 16.2.12.4. Recent Developments
- 16.2.12.5. Financials (Based on Availability)
- 16.2.1 Smith & Nephew PLC
List of Figures
- Figure 1: Global Medical Cameras Market Revenue Breakdown (Million, %) by Region 2024 & 2032
- Figure 2: Global Medical Cameras Market Volume Breakdown (K Unit, %) by Region 2024 & 2032
- Figure 3: North America Medical Cameras Market Revenue (Million), by Country 2024 & 2032
- Figure 4: North America Medical Cameras Market Volume (K Unit), by Country 2024 & 2032
- Figure 5: North America Medical Cameras Market Revenue Share (%), by Country 2024 & 2032
- Figure 6: North America Medical Cameras Market Volume Share (%), by Country 2024 & 2032
- Figure 7: Europe Medical Cameras Market Revenue (Million), by Country 2024 & 2032
- Figure 8: Europe Medical Cameras Market Volume (K Unit), by Country 2024 & 2032
- Figure 9: Europe Medical Cameras Market Revenue Share (%), by Country 2024 & 2032
- Figure 10: Europe Medical Cameras Market Volume Share (%), by Country 2024 & 2032
- Figure 11: Asia Pacific Medical Cameras Market Revenue (Million), by Country 2024 & 2032
- Figure 12: Asia Pacific Medical Cameras Market Volume (K Unit), by Country 2024 & 2032
- Figure 13: Asia Pacific Medical Cameras Market Revenue Share (%), by Country 2024 & 2032
- Figure 14: Asia Pacific Medical Cameras Market Volume Share (%), by Country 2024 & 2032
- Figure 15: Middle East and Africa Medical Cameras Market Revenue (Million), by Country 2024 & 2032
- Figure 16: Middle East and Africa Medical Cameras Market Volume (K Unit), by Country 2024 & 2032
- Figure 17: Middle East and Africa Medical Cameras Market Revenue Share (%), by Country 2024 & 2032
- Figure 18: Middle East and Africa Medical Cameras Market Volume Share (%), by Country 2024 & 2032
- Figure 19: South America Medical Cameras Market Revenue (Million), by Country 2024 & 2032
- Figure 20: South America Medical Cameras Market Volume (K Unit), by Country 2024 & 2032
- Figure 21: South America Medical Cameras Market Revenue Share (%), by Country 2024 & 2032
- Figure 22: South America Medical Cameras Market Volume Share (%), by Country 2024 & 2032
- Figure 23: North America Medical Cameras Market Revenue (Million), by Type 2024 & 2032
- Figure 24: North America Medical Cameras Market Volume (K Unit), by Type 2024 & 2032
- Figure 25: North America Medical Cameras Market Revenue Share (%), by Type 2024 & 2032
- Figure 26: North America Medical Cameras Market Volume Share (%), by Type 2024 & 2032
- Figure 27: North America Medical Cameras Market Revenue (Million), by Resolution 2024 & 2032
- Figure 28: North America Medical Cameras Market Volume (K Unit), by Resolution 2024 & 2032
- Figure 29: North America Medical Cameras Market Revenue Share (%), by Resolution 2024 & 2032
- Figure 30: North America Medical Cameras Market Volume Share (%), by Resolution 2024 & 2032
- Figure 31: North America Medical Cameras Market Revenue (Million), by End-User 2024 & 2032
- Figure 32: North America Medical Cameras Market Volume (K Unit), by End-User 2024 & 2032
- Figure 33: North America Medical Cameras Market Revenue Share (%), by End-User 2024 & 2032
- Figure 34: North America Medical Cameras Market Volume Share (%), by End-User 2024 & 2032
- Figure 35: North America Medical Cameras Market Revenue (Million), by Country 2024 & 2032
- Figure 36: North America Medical Cameras Market Volume (K Unit), by Country 2024 & 2032
- Figure 37: North America Medical Cameras Market Revenue Share (%), by Country 2024 & 2032
- Figure 38: North America Medical Cameras Market Volume Share (%), by Country 2024 & 2032
- Figure 39: Europe Medical Cameras Market Revenue (Million), by Type 2024 & 2032
- Figure 40: Europe Medical Cameras Market Volume (K Unit), by Type 2024 & 2032
- Figure 41: Europe Medical Cameras Market Revenue Share (%), by Type 2024 & 2032
- Figure 42: Europe Medical Cameras Market Volume Share (%), by Type 2024 & 2032
- Figure 43: Europe Medical Cameras Market Revenue (Million), by Resolution 2024 & 2032
- Figure 44: Europe Medical Cameras Market Volume (K Unit), by Resolution 2024 & 2032
- Figure 45: Europe Medical Cameras Market Revenue Share (%), by Resolution 2024 & 2032
- Figure 46: Europe Medical Cameras Market Volume Share (%), by Resolution 2024 & 2032
- Figure 47: Europe Medical Cameras Market Revenue (Million), by End-User 2024 & 2032
- Figure 48: Europe Medical Cameras Market Volume (K Unit), by End-User 2024 & 2032
- Figure 49: Europe Medical Cameras Market Revenue Share (%), by End-User 2024 & 2032
- Figure 50: Europe Medical Cameras Market Volume Share (%), by End-User 2024 & 2032
- Figure 51: Europe Medical Cameras Market Revenue (Million), by Country 2024 & 2032
- Figure 52: Europe Medical Cameras Market Volume (K Unit), by Country 2024 & 2032
- Figure 53: Europe Medical Cameras Market Revenue Share (%), by Country 2024 & 2032
- Figure 54: Europe Medical Cameras Market Volume Share (%), by Country 2024 & 2032
- Figure 55: Asia Pacific Medical Cameras Market Revenue (Million), by Type 2024 & 2032
- Figure 56: Asia Pacific Medical Cameras Market Volume (K Unit), by Type 2024 & 2032
- Figure 57: Asia Pacific Medical Cameras Market Revenue Share (%), by Type 2024 & 2032
- Figure 58: Asia Pacific Medical Cameras Market Volume Share (%), by Type 2024 & 2032
- Figure 59: Asia Pacific Medical Cameras Market Revenue (Million), by Resolution 2024 & 2032
- Figure 60: Asia Pacific Medical Cameras Market Volume (K Unit), by Resolution 2024 & 2032
- Figure 61: Asia Pacific Medical Cameras Market Revenue Share (%), by Resolution 2024 & 2032
- Figure 62: Asia Pacific Medical Cameras Market Volume Share (%), by Resolution 2024 & 2032
- Figure 63: Asia Pacific Medical Cameras Market Revenue (Million), by End-User 2024 & 2032
- Figure 64: Asia Pacific Medical Cameras Market Volume (K Unit), by End-User 2024 & 2032
- Figure 65: Asia Pacific Medical Cameras Market Revenue Share (%), by End-User 2024 & 2032
- Figure 66: Asia Pacific Medical Cameras Market Volume Share (%), by End-User 2024 & 2032
- Figure 67: Asia Pacific Medical Cameras Market Revenue (Million), by Country 2024 & 2032
- Figure 68: Asia Pacific Medical Cameras Market Volume (K Unit), by Country 2024 & 2032
- Figure 69: Asia Pacific Medical Cameras Market Revenue Share (%), by Country 2024 & 2032
- Figure 70: Asia Pacific Medical Cameras Market Volume Share (%), by Country 2024 & 2032
- Figure 71: Middle East and Africa Medical Cameras Market Revenue (Million), by Type 2024 & 2032
- Figure 72: Middle East and Africa Medical Cameras Market Volume (K Unit), by Type 2024 & 2032
- Figure 73: Middle East and Africa Medical Cameras Market Revenue Share (%), by Type 2024 & 2032
- Figure 74: Middle East and Africa Medical Cameras Market Volume Share (%), by Type 2024 & 2032
- Figure 75: Middle East and Africa Medical Cameras Market Revenue (Million), by Resolution 2024 & 2032
- Figure 76: Middle East and Africa Medical Cameras Market Volume (K Unit), by Resolution 2024 & 2032
- Figure 77: Middle East and Africa Medical Cameras Market Revenue Share (%), by Resolution 2024 & 2032
- Figure 78: Middle East and Africa Medical Cameras Market Volume Share (%), by Resolution 2024 & 2032
- Figure 79: Middle East and Africa Medical Cameras Market Revenue (Million), by End-User 2024 & 2032
- Figure 80: Middle East and Africa Medical Cameras Market Volume (K Unit), by End-User 2024 & 2032
- Figure 81: Middle East and Africa Medical Cameras Market Revenue Share (%), by End-User 2024 & 2032
- Figure 82: Middle East and Africa Medical Cameras Market Volume Share (%), by End-User 2024 & 2032
- Figure 83: Middle East and Africa Medical Cameras Market Revenue (Million), by Country 2024 & 2032
- Figure 84: Middle East and Africa Medical Cameras Market Volume (K Unit), by Country 2024 & 2032
- Figure 85: Middle East and Africa Medical Cameras Market Revenue Share (%), by Country 2024 & 2032
- Figure 86: Middle East and Africa Medical Cameras Market Volume Share (%), by Country 2024 & 2032
- Figure 87: South America Medical Cameras Market Revenue (Million), by Type 2024 & 2032
- Figure 88: South America Medical Cameras Market Volume (K Unit), by Type 2024 & 2032
- Figure 89: South America Medical Cameras Market Revenue Share (%), by Type 2024 & 2032
- Figure 90: South America Medical Cameras Market Volume Share (%), by Type 2024 & 2032
- Figure 91: South America Medical Cameras Market Revenue (Million), by Resolution 2024 & 2032
- Figure 92: South America Medical Cameras Market Volume (K Unit), by Resolution 2024 & 2032
- Figure 93: South America Medical Cameras Market Revenue Share (%), by Resolution 2024 & 2032
- Figure 94: South America Medical Cameras Market Volume Share (%), by Resolution 2024 & 2032
- Figure 95: South America Medical Cameras Market Revenue (Million), by End-User 2024 & 2032
- Figure 96: South America Medical Cameras Market Volume (K Unit), by End-User 2024 & 2032
- Figure 97: South America Medical Cameras Market Revenue Share (%), by End-User 2024 & 2032
- Figure 98: South America Medical Cameras Market Volume Share (%), by End-User 2024 & 2032
- Figure 99: South America Medical Cameras Market Revenue (Million), by Country 2024 & 2032
- Figure 100: South America Medical Cameras Market Volume (K Unit), by Country 2024 & 2032
- Figure 101: South America Medical Cameras Market Revenue Share (%), by Country 2024 & 2032
- Figure 102: South America Medical Cameras Market Volume Share (%), by Country 2024 & 2032
List of Tables
- Table 1: Global Medical Cameras Market Revenue Million Forecast, by Region 2019 & 2032
- Table 2: Global Medical Cameras Market Volume K Unit Forecast, by Region 2019 & 2032
- Table 3: Global Medical Cameras Market Revenue Million Forecast, by Type 2019 & 2032
- Table 4: Global Medical Cameras Market Volume K Unit Forecast, by Type 2019 & 2032
- Table 5: Global Medical Cameras Market Revenue Million Forecast, by Resolution 2019 & 2032
- Table 6: Global Medical Cameras Market Volume K Unit Forecast, by Resolution 2019 & 2032
- Table 7: Global Medical Cameras Market Revenue Million Forecast, by End-User 2019 & 2032
- Table 8: Global Medical Cameras Market Volume K Unit Forecast, by End-User 2019 & 2032
- Table 9: Global Medical Cameras Market Revenue Million Forecast, by Region 2019 & 2032
- Table 10: Global Medical Cameras Market Volume K Unit Forecast, by Region 2019 & 2032
- Table 11: Global Medical Cameras Market Revenue Million Forecast, by Country 2019 & 2032
- Table 12: Global Medical Cameras Market Volume K Unit Forecast, by Country 2019 & 2032
- Table 13: United States Medical Cameras Market Revenue (Million) Forecast, by Application 2019 & 2032
- Table 14: United States Medical Cameras Market Volume (K Unit) Forecast, by Application 2019 & 2032
- Table 15: Canada Medical Cameras Market Revenue (Million) Forecast, by Application 2019 & 2032
- Table 16: Canada Medical Cameras Market Volume (K Unit) Forecast, by Application 2019 & 2032
- Table 17: Mexico Medical Cameras Market Revenue (Million) Forecast, by Application 2019 & 2032
- Table 18: Mexico Medical Cameras Market Volume (K Unit) Forecast, by Application 2019 & 2032
- Table 19: Global Medical Cameras Market Revenue Million Forecast, by Country 2019 & 2032
- Table 20: Global Medical Cameras Market Volume K Unit Forecast, by Country 2019 & 2032
- Table 21: Germany Medical Cameras Market Revenue (Million) Forecast, by Application 2019 & 2032
- Table 22: Germany Medical Cameras Market Volume (K Unit) Forecast, by Application 2019 & 2032
- Table 23: United Kingdom Medical Cameras Market Revenue (Million) Forecast, by Application 2019 & 2032
- Table 24: United Kingdom Medical Cameras Market Volume (K Unit) Forecast, by Application 2019 & 2032
- Table 25: France Medical Cameras Market Revenue (Million) Forecast, by Application 2019 & 2032
- Table 26: France Medical Cameras Market Volume (K Unit) Forecast, by Application 2019 & 2032
- Table 27: Italy Medical Cameras Market Revenue (Million) Forecast, by Application 2019 & 2032
- Table 28: Italy Medical Cameras Market Volume (K Unit) Forecast, by Application 2019 & 2032
- Table 29: Spain Medical Cameras Market Revenue (Million) Forecast, by Application 2019 & 2032
- Table 30: Spain Medical Cameras Market Volume (K Unit) Forecast, by Application 2019 & 2032
- Table 31: Rest of Europe Medical Cameras Market Revenue (Million) Forecast, by Application 2019 & 2032
- Table 32: Rest of Europe Medical Cameras Market Volume (K Unit) Forecast, by Application 2019 & 2032
- Table 33: Global Medical Cameras Market Revenue Million Forecast, by Country 2019 & 2032
- Table 34: Global Medical Cameras Market Volume K Unit Forecast, by Country 2019 & 2032
- Table 35: China Medical Cameras Market Revenue (Million) Forecast, by Application 2019 & 2032
- Table 36: China Medical Cameras Market Volume (K Unit) Forecast, by Application 2019 & 2032
- Table 37: Japan Medical Cameras Market Revenue (Million) Forecast, by Application 2019 & 2032
- Table 38: Japan Medical Cameras Market Volume (K Unit) Forecast, by Application 2019 & 2032
- Table 39: India Medical Cameras Market Revenue (Million) Forecast, by Application 2019 & 2032
- Table 40: India Medical Cameras Market Volume (K Unit) Forecast, by Application 2019 & 2032
- Table 41: Australia Medical Cameras Market Revenue (Million) Forecast, by Application 2019 & 2032
- Table 42: Australia Medical Cameras Market Volume (K Unit) Forecast, by Application 2019 & 2032
- Table 43: South Korea Medical Cameras Market Revenue (Million) Forecast, by Application 2019 & 2032
- Table 44: South Korea Medical Cameras Market Volume (K Unit) Forecast, by Application 2019 & 2032
- Table 45: Rest of Asia Pacific Medical Cameras Market Revenue (Million) Forecast, by Application 2019 & 2032
- Table 46: Rest of Asia Pacific Medical Cameras Market Volume (K Unit) Forecast, by Application 2019 & 2032
- Table 47: Global Medical Cameras Market Revenue Million Forecast, by Country 2019 & 2032
- Table 48: Global Medical Cameras Market Volume K Unit Forecast, by Country 2019 & 2032
- Table 49: GCC Medical Cameras Market Revenue (Million) Forecast, by Application 2019 & 2032
- Table 50: GCC Medical Cameras Market Volume (K Unit) Forecast, by Application 2019 & 2032
- Table 51: South Africa Medical Cameras Market Revenue (Million) Forecast, by Application 2019 & 2032
- Table 52: South Africa Medical Cameras Market Volume (K Unit) Forecast, by Application 2019 & 2032
- Table 53: Rest of Middle East and Africa Medical Cameras Market Revenue (Million) Forecast, by Application 2019 & 2032
- Table 54: Rest of Middle East and Africa Medical Cameras Market Volume (K Unit) Forecast, by Application 2019 & 2032
- Table 55: Global Medical Cameras Market Revenue Million Forecast, by Country 2019 & 2032
- Table 56: Global Medical Cameras Market Volume K Unit Forecast, by Country 2019 & 2032
- Table 57: Brazil Medical Cameras Market Revenue (Million) Forecast, by Application 2019 & 2032
- Table 58: Brazil Medical Cameras Market Volume (K Unit) Forecast, by Application 2019 & 2032
- Table 59: Argentina Medical Cameras Market Revenue (Million) Forecast, by Application 2019 & 2032
- Table 60: Argentina Medical Cameras Market Volume (K Unit) Forecast, by Application 2019 & 2032
- Table 61: Rest of South America Medical Cameras Market Revenue (Million) Forecast, by Application 2019 & 2032
- Table 62: Rest of South America Medical Cameras Market Volume (K Unit) Forecast, by Application 2019 & 2032
- Table 63: Global Medical Cameras Market Revenue Million Forecast, by Type 2019 & 2032
- Table 64: Global Medical Cameras Market Volume K Unit Forecast, by Type 2019 & 2032
- Table 65: Global Medical Cameras Market Revenue Million Forecast, by Resolution 2019 & 2032
- Table 66: Global Medical Cameras Market Volume K Unit Forecast, by Resolution 2019 & 2032
- Table 67: Global Medical Cameras Market Revenue Million Forecast, by End-User 2019 & 2032
- Table 68: Global Medical Cameras Market Volume K Unit Forecast, by End-User 2019 & 2032
- Table 69: Global Medical Cameras Market Revenue Million Forecast, by Country 2019 & 2032
- Table 70: Global Medical Cameras Market Volume K Unit Forecast, by Country 2019 & 2032
- Table 71: United States Medical Cameras Market Revenue (Million) Forecast, by Application 2019 & 2032
- Table 72: United States Medical Cameras Market Volume (K Unit) Forecast, by Application 2019 & 2032
- Table 73: Canada Medical Cameras Market Revenue (Million) Forecast, by Application 2019 & 2032
- Table 74: Canada Medical Cameras Market Volume (K Unit) Forecast, by Application 2019 & 2032
- Table 75: Mexico Medical Cameras Market Revenue (Million) Forecast, by Application 2019 & 2032
- Table 76: Mexico Medical Cameras Market Volume (K Unit) Forecast, by Application 2019 & 2032
- Table 77: Global Medical Cameras Market Revenue Million Forecast, by Type 2019 & 2032
- Table 78: Global Medical Cameras Market Volume K Unit Forecast, by Type 2019 & 2032
- Table 79: Global Medical Cameras Market Revenue Million Forecast, by Resolution 2019 & 2032
- Table 80: Global Medical Cameras Market Volume K Unit Forecast, by Resolution 2019 & 2032
- Table 81: Global Medical Cameras Market Revenue Million Forecast, by End-User 2019 & 2032
- Table 82: Global Medical Cameras Market Volume K Unit Forecast, by End-User 2019 & 2032
- Table 83: Global Medical Cameras Market Revenue Million Forecast, by Country 2019 & 2032
- Table 84: Global Medical Cameras Market Volume K Unit Forecast, by Country 2019 & 2032
- Table 85: Germany Medical Cameras Market Revenue (Million) Forecast, by Application 2019 & 2032
- Table 86: Germany Medical Cameras Market Volume (K Unit) Forecast, by Application 2019 & 2032
- Table 87: United Kingdom Medical Cameras Market Revenue (Million) Forecast, by Application 2019 & 2032
- Table 88: United Kingdom Medical Cameras Market Volume (K Unit) Forecast, by Application 2019 & 2032
- Table 89: France Medical Cameras Market Revenue (Million) Forecast, by Application 2019 & 2032
- Table 90: France Medical Cameras Market Volume (K Unit) Forecast, by Application 2019 & 2032
- Table 91: Italy Medical Cameras Market Revenue (Million) Forecast, by Application 2019 & 2032
- Table 92: Italy Medical Cameras Market Volume (K Unit) Forecast, by Application 2019 & 2032
- Table 93: Spain Medical Cameras Market Revenue (Million) Forecast, by Application 2019 & 2032
- Table 94: Spain Medical Cameras Market Volume (K Unit) Forecast, by Application 2019 & 2032
- Table 95: Rest of Europe Medical Cameras Market Revenue (Million) Forecast, by Application 2019 & 2032
- Table 96: Rest of Europe Medical Cameras Market Volume (K Unit) Forecast, by Application 2019 & 2032
- Table 97: Global Medical Cameras Market Revenue Million Forecast, by Type 2019 & 2032
- Table 98: Global Medical Cameras Market Volume K Unit Forecast, by Type 2019 & 2032
- Table 99: Global Medical Cameras Market Revenue Million Forecast, by Resolution 2019 & 2032
- Table 100: Global Medical Cameras Market Volume K Unit Forecast, by Resolution 2019 & 2032
- Table 101: Global Medical Cameras Market Revenue Million Forecast, by End-User 2019 & 2032
- Table 102: Global Medical Cameras Market Volume K Unit Forecast, by End-User 2019 & 2032
- Table 103: Global Medical Cameras Market Revenue Million Forecast, by Country 2019 & 2032
- Table 104: Global Medical Cameras Market Volume K Unit Forecast, by Country 2019 & 2032
- Table 105: China Medical Cameras Market Revenue (Million) Forecast, by Application 2019 & 2032
- Table 106: China Medical Cameras Market Volume (K Unit) Forecast, by Application 2019 & 2032
- Table 107: Japan Medical Cameras Market Revenue (Million) Forecast, by Application 2019 & 2032
- Table 108: Japan Medical Cameras Market Volume (K Unit) Forecast, by Application 2019 & 2032
- Table 109: India Medical Cameras Market Revenue (Million) Forecast, by Application 2019 & 2032
- Table 110: India Medical Cameras Market Volume (K Unit) Forecast, by Application 2019 & 2032
- Table 111: Australia Medical Cameras Market Revenue (Million) Forecast, by Application 2019 & 2032
- Table 112: Australia Medical Cameras Market Volume (K Unit) Forecast, by Application 2019 & 2032
- Table 113: South Korea Medical Cameras Market Revenue (Million) Forecast, by Application 2019 & 2032
- Table 114: South Korea Medical Cameras Market Volume (K Unit) Forecast, by Application 2019 & 2032
- Table 115: Rest of Asia Pacific Medical Cameras Market Revenue (Million) Forecast, by Application 2019 & 2032
- Table 116: Rest of Asia Pacific Medical Cameras Market Volume (K Unit) Forecast, by Application 2019 & 2032
- Table 117: Global Medical Cameras Market Revenue Million Forecast, by Type 2019 & 2032
- Table 118: Global Medical Cameras Market Volume K Unit Forecast, by Type 2019 & 2032
- Table 119: Global Medical Cameras Market Revenue Million Forecast, by Resolution 2019 & 2032
- Table 120: Global Medical Cameras Market Volume K Unit Forecast, by Resolution 2019 & 2032
- Table 121: Global Medical Cameras Market Revenue Million Forecast, by End-User 2019 & 2032
- Table 122: Global Medical Cameras Market Volume K Unit Forecast, by End-User 2019 & 2032
- Table 123: Global Medical Cameras Market Revenue Million Forecast, by Country 2019 & 2032
- Table 124: Global Medical Cameras Market Volume K Unit Forecast, by Country 2019 & 2032
- Table 125: GCC Medical Cameras Market Revenue (Million) Forecast, by Application 2019 & 2032
- Table 126: GCC Medical Cameras Market Volume (K Unit) Forecast, by Application 2019 & 2032
- Table 127: South Africa Medical Cameras Market Revenue (Million) Forecast, by Application 2019 & 2032
- Table 128: South Africa Medical Cameras Market Volume (K Unit) Forecast, by Application 2019 & 2032
- Table 129: Rest of Middle East and Africa Medical Cameras Market Revenue (Million) Forecast, by Application 2019 & 2032
- Table 130: Rest of Middle East and Africa Medical Cameras Market Volume (K Unit) Forecast, by Application 2019 & 2032
- Table 131: Global Medical Cameras Market Revenue Million Forecast, by Type 2019 & 2032
- Table 132: Global Medical Cameras Market Volume K Unit Forecast, by Type 2019 & 2032
- Table 133: Global Medical Cameras Market Revenue Million Forecast, by Resolution 2019 & 2032
- Table 134: Global Medical Cameras Market Volume K Unit Forecast, by Resolution 2019 & 2032
- Table 135: Global Medical Cameras Market Revenue Million Forecast, by End-User 2019 & 2032
- Table 136: Global Medical Cameras Market Volume K Unit Forecast, by End-User 2019 & 2032
- Table 137: Global Medical Cameras Market Revenue Million Forecast, by Country 2019 & 2032
- Table 138: Global Medical Cameras Market Volume K Unit Forecast, by Country 2019 & 2032
- Table 139: Brazil Medical Cameras Market Revenue (Million) Forecast, by Application 2019 & 2032
- Table 140: Brazil Medical Cameras Market Volume (K Unit) Forecast, by Application 2019 & 2032
- Table 141: Argentina Medical Cameras Market Revenue (Million) Forecast, by Application 2019 & 2032
- Table 142: Argentina Medical Cameras Market Volume (K Unit) Forecast, by Application 2019 & 2032
- Table 143: Rest of South America Medical Cameras Market Revenue (Million) Forecast, by Application 2019 & 2032
- Table 144: Rest of South America Medical Cameras Market Volume (K Unit) Forecast, by Application 2019 & 2032
Frequently Asked Questions
1. What is the projected Compound Annual Growth Rate (CAGR) of the Medical Cameras Market?
The projected CAGR is approximately 7.60%.
2. Which companies are prominent players in the Medical Cameras Market?
Key companies in the market include Smith & Nephew PLC, Canon Inc, Sony Electronics Inc, Allied Vision Technologies GmbH, Danaher Corporation, Richard und Annemarie Wolf Stiftung (Richard Wolf GmbH), Carestream Dental LLC, Carl Zeiss AG, Topcon Corporation, Stryker Corporation, Canfield Scientific Inc, Olympus Corporation.
3. What are the main segments of the Medical Cameras Market?
The market segments include Type, Resolution, End-User.
4. Can you provide details about the market size?
The market size is estimated to be USD XX Million as of 2022.
5. What are some drivers contributing to market growth?
Rising Demand for High-definition Visuals in Surgical Procedures and Advancement in Medical Cameras; Growing Use of Medical Cameras and Microscopes for Surgeries.
6. What are the notable trends driving market growth?
Endoscopy Cameras Segment to is Expected to Witness Significant Growth over the Forecast Period..
7. Are there any restraints impacting market growth?
High Cost and Requirement of Substantial Investment.
8. Can you provide examples of recent developments in the market?
In June 2022, Casio Computer Co., Ltd reported the launched DZ-D100 dermatology camera and DZ-S50 dermatology scope in Europe.
9. What pricing options are available for accessing the report?
Pricing options include single-user, multi-user, and enterprise licenses priced at USD 4750, USD 5250, and USD 8750 respectively.
10. Is the market size provided in terms of value or volume?
The market size is provided in terms of value, measured in Million and volume, measured in K Unit.
11. Are there any specific market keywords associated with the report?
Yes, the market keyword associated with the report is "Medical Cameras Market," which aids in identifying and referencing the specific market segment covered.
12. How do I determine which pricing option suits my needs best?
The pricing options vary based on user requirements and access needs. Individual users may opt for single-user licenses, while businesses requiring broader access may choose multi-user or enterprise licenses for cost-effective access to the report.
13. Are there any additional resources or data provided in the Medical Cameras Market report?
While the report offers comprehensive insights, it's advisable to review the specific contents or supplementary materials provided to ascertain if additional resources or data are available.
14. How can I stay updated on further developments or reports in the Medical Cameras Market?
To stay informed about further developments, trends, and reports in the Medical Cameras Market, consider subscribing to industry newsletters, following relevant companies and organizations, or regularly checking reputable industry news sources and publications.
Methodology
Step 1 - Identification of Relevant Samples Size from Population Database


Step 2 - Approaches for Defining Global Market Size (Value, Volume* & Price*)

Note*: In applicable scenarios
Step 3 - Data Sources
Primary Research
- Web Analytics
- Survey Reports
- Research Institute
- Latest Research Reports
- Opinion Leaders
Secondary Research
- Annual Reports
- White Paper
- Latest Press Release
- Industry Association
- Paid Database
- Investor Presentations

Step 4 - Data Triangulation
Involves using different sources of information in order to increase the validity of a study
These sources are likely to be stakeholders in a program - participants, other researchers, program staff, other community members, and so on.
Then we put all data in single framework & apply various statistical tools to find out the dynamic on the market.
During the analysis stage, feedback from the stakeholder groups would be compared to determine areas of agreement as well as areas of divergence


