
Key Insights
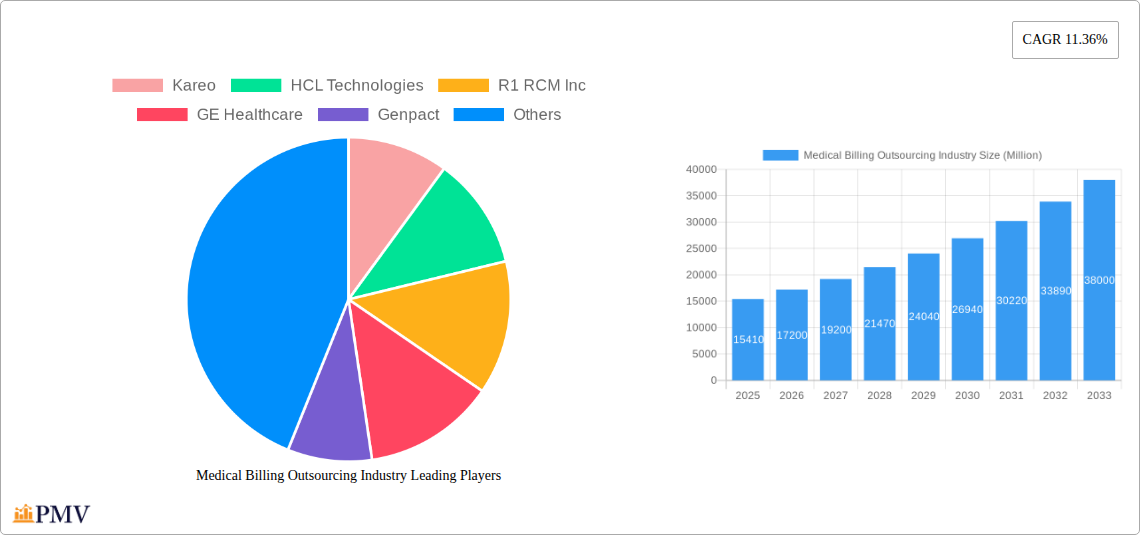
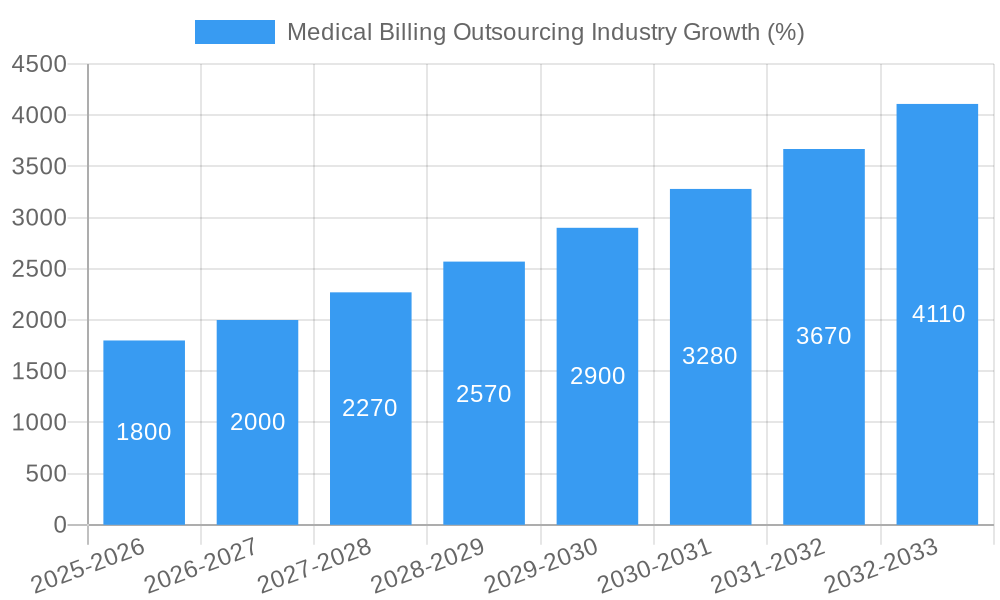
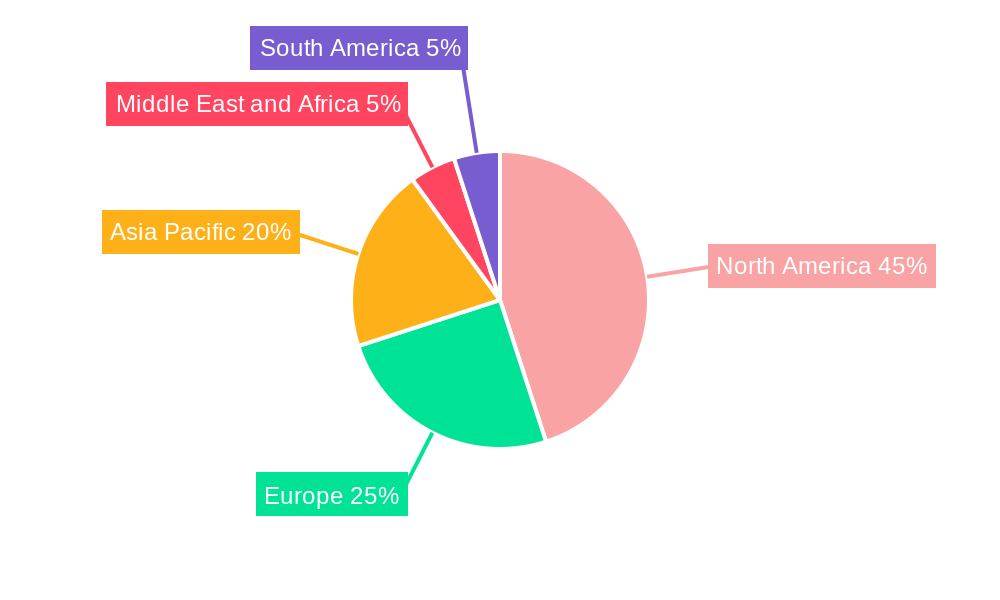
The medical billing outsourcing market, valued at $15.41 billion in 2025, is experiencing robust growth, projected to expand at a compound annual growth rate (CAGR) of 11.36% from 2025 to 2033. This surge is driven by several key factors. Increasing healthcare costs and administrative burdens are compelling healthcare providers – hospitals, physician offices, and other end-users – to seek efficient and cost-effective billing solutions. Outsourcing allows these providers to focus on patient care while leveraging the expertise of specialized billing companies to improve revenue cycle management. Technological advancements, such as cloud-based billing platforms and AI-powered solutions, are streamlining processes, enhancing accuracy, and reducing turnaround times. The growing adoption of electronic health records (EHRs) and the increasing complexities of healthcare insurance regulations also contribute to the market's expansion. The market is segmented by service (front-end and back-end) and end-user, with hospitals and physician offices constituting significant portions of the market. North America currently holds the largest market share, driven by factors like advanced technological infrastructure and high healthcare expenditure. However, the Asia-Pacific region is poised for significant growth due to its expanding healthcare sector and increasing adoption of outsourced billing services.
Competition is fierce, with established players like Kareo, HCL Technologies, R1 RCM Inc, GE Healthcare, Genpact, Experian Information Solutions Inc, Quest Diagnostics, Cerner Corporation, Allscripts Healthcare Solutions Inc, The SSI Groups, McKesson Corporation, and EClinicalWorks vying for market share. These companies are constantly innovating to provide comprehensive solutions and gain a competitive edge. The future growth of the market will likely be shaped by continued technological advancements, regulatory changes, and the evolving needs of healthcare providers. Strategies focusing on data analytics, improved security, and personalized services will likely be key differentiators for success in this dynamic market. Furthermore, consolidation within the industry and strategic partnerships are expected to further shape the competitive landscape.
Medical Billing Outsourcing Industry: Market Report 2019-2033
This comprehensive report provides an in-depth analysis of the Medical Billing Outsourcing industry, offering crucial insights for stakeholders, investors, and industry professionals. The study period spans from 2019 to 2033, with 2025 serving as the base and estimated year. The report projects a market valued at xx Million in 2025 and forecasts significant growth throughout the 2025-2033 forecast period. This report analyzes market dynamics, competitive landscapes, and future trends, with a focus on key players like Kareo, HCL Technologies, R1 RCM Inc, GE Healthcare, and others.
Medical Billing Outsourcing Industry Market Structure & Competitive Dynamics
The Medical Billing Outsourcing market exhibits a moderately concentrated structure, with several large players holding significant market share. However, the presence of numerous smaller, specialized firms fosters a dynamic competitive landscape. The industry is characterized by ongoing innovation in technology, such as AI-driven automation and cloud-based solutions, influencing market dynamics. Regulatory frameworks, including HIPAA compliance and data security regulations, heavily impact operational strategies and necessitate robust compliance programs. Product substitutes, such as in-house billing departments, exist but face increasing pressure due to the cost-effectiveness and efficiency offered by outsourcing. End-user trends, including the growing adoption of electronic health records (EHRs) and the increasing demand for streamlined revenue cycle management, fuel market expansion. The industry also witnesses frequent mergers and acquisitions (M&A) activities, with significant deals shaping market consolidation and influencing competitive dynamics. For example, the acquisition of Cerner's RevWorks by R1 RCM Inc. in 2020 significantly altered the market landscape. The total M&A deal value over the historical period (2019-2024) is estimated to be around xx Million. Market share distribution among the top 10 players currently stands at approximately xx%, with the largest players holding between 5% and 15% individually.
Medical Billing Outsourcing Industry Industry Trends & Insights
The Medical Billing Outsourcing industry is experiencing robust growth, driven by several key factors. The increasing adoption of EHRs and the associated complexities of billing processes are pushing healthcare providers to outsource billing operations. The rising volume of medical claims and the need for efficient revenue cycle management contribute to significant market expansion. Technological advancements, such as AI-powered automation and machine learning algorithms, are streamlining processes and improving accuracy, resulting in cost savings and enhanced efficiency. These technological disruptions are also driving market consolidation, with larger companies acquiring smaller firms to integrate innovative technologies. Consumer preferences are shifting towards convenient, technology-enabled healthcare solutions, fueling the demand for robust billing and revenue cycle management systems. The industry's competitive dynamics are marked by intense competition, both between established players and emerging companies, leading to continuous innovation and service enhancements. The Compound Annual Growth Rate (CAGR) for the period 2019-2024 is estimated to be around xx%, indicating significant market expansion. Market penetration of outsourced billing services in the physician office segment stands at approximately xx%, showing considerable potential for future growth.
Dominant Markets & Segments in Medical Billing Outsourcing Industry
The North American region currently dominates the Medical Billing Outsourcing market, driven by factors including higher healthcare spending, advanced technological infrastructure, and a high concentration of healthcare providers. The United States is a particularly significant market within this region.
- Key Drivers for North American Dominance:
- Advanced healthcare infrastructure.
- High healthcare expenditure.
- Stringent regulatory frameworks driving outsourcing needs.
- High adoption of advanced technologies.
By Service: The back-end segment holds the largest market share, owing to its greater complexity and the high demand for specialized expertise in claims processing, payment posting, and accounts receivable management.
By End-User: Hospitals represent the most significant end-user segment, reflecting their large billing volumes and the complexities associated with managing revenue cycles in this setting. The physician office segment also demonstrates considerable growth potential.
Medical Billing Outsourcing Industry Product Innovations
Recent product innovations focus on AI-powered automation for claims processing, real-time analytics dashboards for revenue cycle management, and cloud-based solutions for enhanced scalability and accessibility. These innovations aim to improve accuracy, reduce costs, and enhance efficiency. Competitive advantages are increasingly linked to technological proficiency, data security measures, and specialized expertise in navigating complex regulatory environments. The market is witnessing a shift toward integrated platforms that streamline the entire revenue cycle, offering comprehensive solutions rather than isolated services.
Report Segmentation & Scope
This report segments the market by service (front-end and back-end) and by end-user (hospitals, physician offices, and other end-users).
By Service: The front-end segment, encompassing patient registration and insurance verification, is expected to grow at a CAGR of xx% during the forecast period. The back-end segment, encompassing claims processing and payment posting, is poised to grow at a CAGR of xx%, reflecting its crucial role in revenue cycle optimization.
By End-User: The hospitals segment is projected to dominate the market throughout the forecast period, showing a CAGR of xx%, driven by high billing volumes and increasing reliance on efficient revenue cycle management. The physician offices segment is expected to witness considerable growth, with a projected CAGR of xx%, fueled by growing adoption of EHRs and the increasing need for efficient billing solutions. The "other end-users" segment includes various healthcare providers with less volume than hospitals and physician offices, exhibiting a CAGR of xx% during the forecast period.
Key Drivers of Medical Billing Outsourcing Industry Growth
Several factors drive industry growth. The increasing adoption of electronic health records (EHRs) increases the complexities of billing, while simultaneously creating opportunities for automation and efficiency gains through outsourcing. The growing volume of medical claims, stringent regulatory compliance requirements, and the need to improve revenue cycle management all contribute to this expansion. Additionally, the cost-effectiveness of outsourcing, freeing up internal resources for core clinical operations, is a strong driver. Technological advancements, particularly in AI and automation, further enhance efficiency and accuracy, making outsourcing an attractive option.
Challenges in the Medical Billing Outsourcing Industry Sector
Key challenges include navigating complex regulatory landscapes (e.g., HIPAA compliance), maintaining data security, and managing fluctuating healthcare reimbursement rates, which can affect profitability. Competition among providers is intense, requiring continuous innovation and service differentiation. Supply chain issues, such as delays in claim processing due to payer backlogs, also pose operational challenges. These issues collectively affect the industry's overall efficiency and cost structure. The estimated impact of these challenges on the overall market size is projected at a reduction of approximately xx Million annually.
Leading Players in the Medical Billing Outsourcing Industry Market
- Kareo
- HCL Technologies
- R1 RCM Inc
- GE Healthcare
- Genpact
- Experian Information Solutions Inc
- Quest Diagnostics
- Cerner Corporation
- Allscripts Healthcare Solutions Inc
- The SSI Groups
- McKesson Corporation
- EClinicalWorks
Key Developments in Medical Billing Outsourcing Industry Sector
- November 2020: Conduent Incorporated announced a commercial agreement with Experian Health, enhancing prescription drug assistance approvals.
- June 2020: R1 RCM Inc. acquired Cerner's RevWorks services business, significantly expanding its market share.
Strategic Medical Billing Outsourcing Industry Market Outlook
The Medical Billing Outsourcing market is poised for continued growth, driven by technological advancements, increasing demand for efficient revenue cycle management, and the rising volume of medical claims. Strategic opportunities lie in leveraging AI and automation to enhance operational efficiency, investing in robust cybersecurity measures, and expanding into emerging markets. Partnerships and acquisitions will play a crucial role in shaping market dynamics. The market's potential for innovation and growth remains significant, particularly in areas like predictive analytics and patient engagement.
Medical Billing Outsourcing Industry Segmentation
-
1. Service
- 1.1. Front End
- 1.2. Back End
-
2. End User
- 2.1. Hospitals
- 2.2. Physicians Office
- 2.3. Other End Users
Medical Billing Outsourcing Industry Segmentation By Geography
-
1. North America
- 1.1. United States
- 1.2. Canada
- 1.3. Mexico
-
2. Europe
- 2.1. Germany
- 2.2. United Kingdom
- 2.3. France
- 2.4. Italy
- 2.5. Spain
- 2.6. Rest of Europe
-
3. Asia Pacific
- 3.1. China
- 3.2. Japan
- 3.3. India
- 3.4. Australia
- 3.5. South Korea
- 3.6. Rest of Asia Pacific
-
4. Middle East and Africa
- 4.1. GCC
- 4.2. South Africa
- 4.3. Rest of Middle East and Africa
-
5. South America
- 5.1. Brazil
- 5.2. Argentina
- 5.3. Rest of South America
Medical Billing Outsourcing Industry REPORT HIGHLIGHTS
| Aspects | Details |
|---|---|
| Study Period | 2019-2033 |
| Base Year | 2024 |
| Estimated Year | 2025 |
| Forecast Period | 2025-2033 |
| Historical Period | 2019-2024 |
| Growth Rate | CAGR of 11.36% from 2019-2033 |
| Segmentation |
|
Table of Contents
- 1. Introduction
- 1.1. Research Scope
- 1.2. Market Segmentation
- 1.3. Research Methodology
- 1.4. Definitions and Assumptions
- 2. Executive Summary
- 2.1. Introduction
- 3. Market Dynamics
- 3.1. Introduction
- 3.2. Market Drivers
- 3.2.1. Growing Emphasis on Compliance and Risk Management; Increasing Need to Make Billing Processes Efficient; Efforts to Contain and Decrease In-house Processing Costs
- 3.3. Market Restrains
- 3.3.1. Increasing Legislative and Regulatory Pressure; High Costs of Technology and Privacy Issues
- 3.4. Market Trends
- 3.4.1. Hospital Outsourced Medical Billing is Expected to Grow at a Good Rate Over the Forecast Period
- 4. Market Factor Analysis
- 4.1. Porters Five Forces
- 4.2. Supply/Value Chain
- 4.3. PESTEL analysis
- 4.4. Market Entropy
- 4.5. Patent/Trademark Analysis
- 5. Global Medical Billing Outsourcing Industry Analysis, Insights and Forecast, 2019-2031
- 5.1. Market Analysis, Insights and Forecast - by Service
- 5.1.1. Front End
- 5.1.2. Back End
- 5.2. Market Analysis, Insights and Forecast - by End User
- 5.2.1. Hospitals
- 5.2.2. Physicians Office
- 5.2.3. Other End Users
- 5.3. Market Analysis, Insights and Forecast - by Region
- 5.3.1. North America
- 5.3.2. Europe
- 5.3.3. Asia Pacific
- 5.3.4. Middle East and Africa
- 5.3.5. South America
- 5.1. Market Analysis, Insights and Forecast - by Service
- 6. North America Medical Billing Outsourcing Industry Analysis, Insights and Forecast, 2019-2031
- 6.1. Market Analysis, Insights and Forecast - by Service
- 6.1.1. Front End
- 6.1.2. Back End
- 6.2. Market Analysis, Insights and Forecast - by End User
- 6.2.1. Hospitals
- 6.2.2. Physicians Office
- 6.2.3. Other End Users
- 6.1. Market Analysis, Insights and Forecast - by Service
- 7. Europe Medical Billing Outsourcing Industry Analysis, Insights and Forecast, 2019-2031
- 7.1. Market Analysis, Insights and Forecast - by Service
- 7.1.1. Front End
- 7.1.2. Back End
- 7.2. Market Analysis, Insights and Forecast - by End User
- 7.2.1. Hospitals
- 7.2.2. Physicians Office
- 7.2.3. Other End Users
- 7.1. Market Analysis, Insights and Forecast - by Service
- 8. Asia Pacific Medical Billing Outsourcing Industry Analysis, Insights and Forecast, 2019-2031
- 8.1. Market Analysis, Insights and Forecast - by Service
- 8.1.1. Front End
- 8.1.2. Back End
- 8.2. Market Analysis, Insights and Forecast - by End User
- 8.2.1. Hospitals
- 8.2.2. Physicians Office
- 8.2.3. Other End Users
- 8.1. Market Analysis, Insights and Forecast - by Service
- 9. Middle East and Africa Medical Billing Outsourcing Industry Analysis, Insights and Forecast, 2019-2031
- 9.1. Market Analysis, Insights and Forecast - by Service
- 9.1.1. Front End
- 9.1.2. Back End
- 9.2. Market Analysis, Insights and Forecast - by End User
- 9.2.1. Hospitals
- 9.2.2. Physicians Office
- 9.2.3. Other End Users
- 9.1. Market Analysis, Insights and Forecast - by Service
- 10. South America Medical Billing Outsourcing Industry Analysis, Insights and Forecast, 2019-2031
- 10.1. Market Analysis, Insights and Forecast - by Service
- 10.1.1. Front End
- 10.1.2. Back End
- 10.2. Market Analysis, Insights and Forecast - by End User
- 10.2.1. Hospitals
- 10.2.2. Physicians Office
- 10.2.3. Other End Users
- 10.1. Market Analysis, Insights and Forecast - by Service
- 11. North America Medical Billing Outsourcing Industry Analysis, Insights and Forecast, 2019-2031
- 11.1. Market Analysis, Insights and Forecast - By Country/Sub-region
- 11.1.1 United States
- 11.1.2 Canada
- 11.1.3 Mexico
- 12. Europe Medical Billing Outsourcing Industry Analysis, Insights and Forecast, 2019-2031
- 12.1. Market Analysis, Insights and Forecast - By Country/Sub-region
- 12.1.1 Germany
- 12.1.2 United Kingdom
- 12.1.3 France
- 12.1.4 Italy
- 12.1.5 Spain
- 12.1.6 Rest of Europe
- 13. Asia Pacific Medical Billing Outsourcing Industry Analysis, Insights and Forecast, 2019-2031
- 13.1. Market Analysis, Insights and Forecast - By Country/Sub-region
- 13.1.1 China
- 13.1.2 Japan
- 13.1.3 India
- 13.1.4 Australia
- 13.1.5 South Korea
- 13.1.6 Rest of Asia Pacific
- 14. Middle East and Africa Medical Billing Outsourcing Industry Analysis, Insights and Forecast, 2019-2031
- 14.1. Market Analysis, Insights and Forecast - By Country/Sub-region
- 14.1.1 GCC
- 14.1.2 South Africa
- 14.1.3 Rest of Middle East and Africa
- 15. South America Medical Billing Outsourcing Industry Analysis, Insights and Forecast, 2019-2031
- 15.1. Market Analysis, Insights and Forecast - By Country/Sub-region
- 15.1.1 Brazil
- 15.1.2 Argentina
- 15.1.3 Rest of South America
- 16. Competitive Analysis
- 16.1. Global Market Share Analysis 2024
- 16.2. Company Profiles
- 16.2.1 Kareo
- 16.2.1.1. Overview
- 16.2.1.2. Products
- 16.2.1.3. SWOT Analysis
- 16.2.1.4. Recent Developments
- 16.2.1.5. Financials (Based on Availability)
- 16.2.2 HCL Technologies
- 16.2.2.1. Overview
- 16.2.2.2. Products
- 16.2.2.3. SWOT Analysis
- 16.2.2.4. Recent Developments
- 16.2.2.5. Financials (Based on Availability)
- 16.2.3 R1 RCM Inc
- 16.2.3.1. Overview
- 16.2.3.2. Products
- 16.2.3.3. SWOT Analysis
- 16.2.3.4. Recent Developments
- 16.2.3.5. Financials (Based on Availability)
- 16.2.4 GE Healthcare
- 16.2.4.1. Overview
- 16.2.4.2. Products
- 16.2.4.3. SWOT Analysis
- 16.2.4.4. Recent Developments
- 16.2.4.5. Financials (Based on Availability)
- 16.2.5 Genpact
- 16.2.5.1. Overview
- 16.2.5.2. Products
- 16.2.5.3. SWOT Analysis
- 16.2.5.4. Recent Developments
- 16.2.5.5. Financials (Based on Availability)
- 16.2.6 Experian Information Solutions Inc
- 16.2.6.1. Overview
- 16.2.6.2. Products
- 16.2.6.3. SWOT Analysis
- 16.2.6.4. Recent Developments
- 16.2.6.5. Financials (Based on Availability)
- 16.2.7 Quest Diagnostics
- 16.2.7.1. Overview
- 16.2.7.2. Products
- 16.2.7.3. SWOT Analysis
- 16.2.7.4. Recent Developments
- 16.2.7.5. Financials (Based on Availability)
- 16.2.8 Cerner Corporation
- 16.2.8.1. Overview
- 16.2.8.2. Products
- 16.2.8.3. SWOT Analysis
- 16.2.8.4. Recent Developments
- 16.2.8.5. Financials (Based on Availability)
- 16.2.9 Allscripts Healthcare Solutions Inc
- 16.2.9.1. Overview
- 16.2.9.2. Products
- 16.2.9.3. SWOT Analysis
- 16.2.9.4. Recent Developments
- 16.2.9.5. Financials (Based on Availability)
- 16.2.10 The SSI Groups
- 16.2.10.1. Overview
- 16.2.10.2. Products
- 16.2.10.3. SWOT Analysis
- 16.2.10.4. Recent Developments
- 16.2.10.5. Financials (Based on Availability)
- 16.2.11 McKesson Corporation
- 16.2.11.1. Overview
- 16.2.11.2. Products
- 16.2.11.3. SWOT Analysis
- 16.2.11.4. Recent Developments
- 16.2.11.5. Financials (Based on Availability)
- 16.2.12 EClinicalWorks
- 16.2.12.1. Overview
- 16.2.12.2. Products
- 16.2.12.3. SWOT Analysis
- 16.2.12.4. Recent Developments
- 16.2.12.5. Financials (Based on Availability)
- 16.2.1 Kareo
List of Figures
- Figure 1: Global Medical Billing Outsourcing Industry Revenue Breakdown (Million, %) by Region 2024 & 2032
- Figure 2: Global Medical Billing Outsourcing Industry Volume Breakdown (K Unit, %) by Region 2024 & 2032
- Figure 3: North America Medical Billing Outsourcing Industry Revenue (Million), by Country 2024 & 2032
- Figure 4: North America Medical Billing Outsourcing Industry Volume (K Unit), by Country 2024 & 2032
- Figure 5: North America Medical Billing Outsourcing Industry Revenue Share (%), by Country 2024 & 2032
- Figure 6: North America Medical Billing Outsourcing Industry Volume Share (%), by Country 2024 & 2032
- Figure 7: Europe Medical Billing Outsourcing Industry Revenue (Million), by Country 2024 & 2032
- Figure 8: Europe Medical Billing Outsourcing Industry Volume (K Unit), by Country 2024 & 2032
- Figure 9: Europe Medical Billing Outsourcing Industry Revenue Share (%), by Country 2024 & 2032
- Figure 10: Europe Medical Billing Outsourcing Industry Volume Share (%), by Country 2024 & 2032
- Figure 11: Asia Pacific Medical Billing Outsourcing Industry Revenue (Million), by Country 2024 & 2032
- Figure 12: Asia Pacific Medical Billing Outsourcing Industry Volume (K Unit), by Country 2024 & 2032
- Figure 13: Asia Pacific Medical Billing Outsourcing Industry Revenue Share (%), by Country 2024 & 2032
- Figure 14: Asia Pacific Medical Billing Outsourcing Industry Volume Share (%), by Country 2024 & 2032
- Figure 15: Middle East and Africa Medical Billing Outsourcing Industry Revenue (Million), by Country 2024 & 2032
- Figure 16: Middle East and Africa Medical Billing Outsourcing Industry Volume (K Unit), by Country 2024 & 2032
- Figure 17: Middle East and Africa Medical Billing Outsourcing Industry Revenue Share (%), by Country 2024 & 2032
- Figure 18: Middle East and Africa Medical Billing Outsourcing Industry Volume Share (%), by Country 2024 & 2032
- Figure 19: South America Medical Billing Outsourcing Industry Revenue (Million), by Country 2024 & 2032
- Figure 20: South America Medical Billing Outsourcing Industry Volume (K Unit), by Country 2024 & 2032
- Figure 21: South America Medical Billing Outsourcing Industry Revenue Share (%), by Country 2024 & 2032
- Figure 22: South America Medical Billing Outsourcing Industry Volume Share (%), by Country 2024 & 2032
- Figure 23: North America Medical Billing Outsourcing Industry Revenue (Million), by Service 2024 & 2032
- Figure 24: North America Medical Billing Outsourcing Industry Volume (K Unit), by Service 2024 & 2032
- Figure 25: North America Medical Billing Outsourcing Industry Revenue Share (%), by Service 2024 & 2032
- Figure 26: North America Medical Billing Outsourcing Industry Volume Share (%), by Service 2024 & 2032
- Figure 27: North America Medical Billing Outsourcing Industry Revenue (Million), by End User 2024 & 2032
- Figure 28: North America Medical Billing Outsourcing Industry Volume (K Unit), by End User 2024 & 2032
- Figure 29: North America Medical Billing Outsourcing Industry Revenue Share (%), by End User 2024 & 2032
- Figure 30: North America Medical Billing Outsourcing Industry Volume Share (%), by End User 2024 & 2032
- Figure 31: North America Medical Billing Outsourcing Industry Revenue (Million), by Country 2024 & 2032
- Figure 32: North America Medical Billing Outsourcing Industry Volume (K Unit), by Country 2024 & 2032
- Figure 33: North America Medical Billing Outsourcing Industry Revenue Share (%), by Country 2024 & 2032
- Figure 34: North America Medical Billing Outsourcing Industry Volume Share (%), by Country 2024 & 2032
- Figure 35: Europe Medical Billing Outsourcing Industry Revenue (Million), by Service 2024 & 2032
- Figure 36: Europe Medical Billing Outsourcing Industry Volume (K Unit), by Service 2024 & 2032
- Figure 37: Europe Medical Billing Outsourcing Industry Revenue Share (%), by Service 2024 & 2032
- Figure 38: Europe Medical Billing Outsourcing Industry Volume Share (%), by Service 2024 & 2032
- Figure 39: Europe Medical Billing Outsourcing Industry Revenue (Million), by End User 2024 & 2032
- Figure 40: Europe Medical Billing Outsourcing Industry Volume (K Unit), by End User 2024 & 2032
- Figure 41: Europe Medical Billing Outsourcing Industry Revenue Share (%), by End User 2024 & 2032
- Figure 42: Europe Medical Billing Outsourcing Industry Volume Share (%), by End User 2024 & 2032
- Figure 43: Europe Medical Billing Outsourcing Industry Revenue (Million), by Country 2024 & 2032
- Figure 44: Europe Medical Billing Outsourcing Industry Volume (K Unit), by Country 2024 & 2032
- Figure 45: Europe Medical Billing Outsourcing Industry Revenue Share (%), by Country 2024 & 2032
- Figure 46: Europe Medical Billing Outsourcing Industry Volume Share (%), by Country 2024 & 2032
- Figure 47: Asia Pacific Medical Billing Outsourcing Industry Revenue (Million), by Service 2024 & 2032
- Figure 48: Asia Pacific Medical Billing Outsourcing Industry Volume (K Unit), by Service 2024 & 2032
- Figure 49: Asia Pacific Medical Billing Outsourcing Industry Revenue Share (%), by Service 2024 & 2032
- Figure 50: Asia Pacific Medical Billing Outsourcing Industry Volume Share (%), by Service 2024 & 2032
- Figure 51: Asia Pacific Medical Billing Outsourcing Industry Revenue (Million), by End User 2024 & 2032
- Figure 52: Asia Pacific Medical Billing Outsourcing Industry Volume (K Unit), by End User 2024 & 2032
- Figure 53: Asia Pacific Medical Billing Outsourcing Industry Revenue Share (%), by End User 2024 & 2032
- Figure 54: Asia Pacific Medical Billing Outsourcing Industry Volume Share (%), by End User 2024 & 2032
- Figure 55: Asia Pacific Medical Billing Outsourcing Industry Revenue (Million), by Country 2024 & 2032
- Figure 56: Asia Pacific Medical Billing Outsourcing Industry Volume (K Unit), by Country 2024 & 2032
- Figure 57: Asia Pacific Medical Billing Outsourcing Industry Revenue Share (%), by Country 2024 & 2032
- Figure 58: Asia Pacific Medical Billing Outsourcing Industry Volume Share (%), by Country 2024 & 2032
- Figure 59: Middle East and Africa Medical Billing Outsourcing Industry Revenue (Million), by Service 2024 & 2032
- Figure 60: Middle East and Africa Medical Billing Outsourcing Industry Volume (K Unit), by Service 2024 & 2032
- Figure 61: Middle East and Africa Medical Billing Outsourcing Industry Revenue Share (%), by Service 2024 & 2032
- Figure 62: Middle East and Africa Medical Billing Outsourcing Industry Volume Share (%), by Service 2024 & 2032
- Figure 63: Middle East and Africa Medical Billing Outsourcing Industry Revenue (Million), by End User 2024 & 2032
- Figure 64: Middle East and Africa Medical Billing Outsourcing Industry Volume (K Unit), by End User 2024 & 2032
- Figure 65: Middle East and Africa Medical Billing Outsourcing Industry Revenue Share (%), by End User 2024 & 2032
- Figure 66: Middle East and Africa Medical Billing Outsourcing Industry Volume Share (%), by End User 2024 & 2032
- Figure 67: Middle East and Africa Medical Billing Outsourcing Industry Revenue (Million), by Country 2024 & 2032
- Figure 68: Middle East and Africa Medical Billing Outsourcing Industry Volume (K Unit), by Country 2024 & 2032
- Figure 69: Middle East and Africa Medical Billing Outsourcing Industry Revenue Share (%), by Country 2024 & 2032
- Figure 70: Middle East and Africa Medical Billing Outsourcing Industry Volume Share (%), by Country 2024 & 2032
- Figure 71: South America Medical Billing Outsourcing Industry Revenue (Million), by Service 2024 & 2032
- Figure 72: South America Medical Billing Outsourcing Industry Volume (K Unit), by Service 2024 & 2032
- Figure 73: South America Medical Billing Outsourcing Industry Revenue Share (%), by Service 2024 & 2032
- Figure 74: South America Medical Billing Outsourcing Industry Volume Share (%), by Service 2024 & 2032
- Figure 75: South America Medical Billing Outsourcing Industry Revenue (Million), by End User 2024 & 2032
- Figure 76: South America Medical Billing Outsourcing Industry Volume (K Unit), by End User 2024 & 2032
- Figure 77: South America Medical Billing Outsourcing Industry Revenue Share (%), by End User 2024 & 2032
- Figure 78: South America Medical Billing Outsourcing Industry Volume Share (%), by End User 2024 & 2032
- Figure 79: South America Medical Billing Outsourcing Industry Revenue (Million), by Country 2024 & 2032
- Figure 80: South America Medical Billing Outsourcing Industry Volume (K Unit), by Country 2024 & 2032
- Figure 81: South America Medical Billing Outsourcing Industry Revenue Share (%), by Country 2024 & 2032
- Figure 82: South America Medical Billing Outsourcing Industry Volume Share (%), by Country 2024 & 2032
List of Tables
- Table 1: Global Medical Billing Outsourcing Industry Revenue Million Forecast, by Region 2019 & 2032
- Table 2: Global Medical Billing Outsourcing Industry Volume K Unit Forecast, by Region 2019 & 2032
- Table 3: Global Medical Billing Outsourcing Industry Revenue Million Forecast, by Service 2019 & 2032
- Table 4: Global Medical Billing Outsourcing Industry Volume K Unit Forecast, by Service 2019 & 2032
- Table 5: Global Medical Billing Outsourcing Industry Revenue Million Forecast, by End User 2019 & 2032
- Table 6: Global Medical Billing Outsourcing Industry Volume K Unit Forecast, by End User 2019 & 2032
- Table 7: Global Medical Billing Outsourcing Industry Revenue Million Forecast, by Region 2019 & 2032
- Table 8: Global Medical Billing Outsourcing Industry Volume K Unit Forecast, by Region 2019 & 2032
- Table 9: Global Medical Billing Outsourcing Industry Revenue Million Forecast, by Country 2019 & 2032
- Table 10: Global Medical Billing Outsourcing Industry Volume K Unit Forecast, by Country 2019 & 2032
- Table 11: United States Medical Billing Outsourcing Industry Revenue (Million) Forecast, by Application 2019 & 2032
- Table 12: United States Medical Billing Outsourcing Industry Volume (K Unit) Forecast, by Application 2019 & 2032
- Table 13: Canada Medical Billing Outsourcing Industry Revenue (Million) Forecast, by Application 2019 & 2032
- Table 14: Canada Medical Billing Outsourcing Industry Volume (K Unit) Forecast, by Application 2019 & 2032
- Table 15: Mexico Medical Billing Outsourcing Industry Revenue (Million) Forecast, by Application 2019 & 2032
- Table 16: Mexico Medical Billing Outsourcing Industry Volume (K Unit) Forecast, by Application 2019 & 2032
- Table 17: Global Medical Billing Outsourcing Industry Revenue Million Forecast, by Country 2019 & 2032
- Table 18: Global Medical Billing Outsourcing Industry Volume K Unit Forecast, by Country 2019 & 2032
- Table 19: Germany Medical Billing Outsourcing Industry Revenue (Million) Forecast, by Application 2019 & 2032
- Table 20: Germany Medical Billing Outsourcing Industry Volume (K Unit) Forecast, by Application 2019 & 2032
- Table 21: United Kingdom Medical Billing Outsourcing Industry Revenue (Million) Forecast, by Application 2019 & 2032
- Table 22: United Kingdom Medical Billing Outsourcing Industry Volume (K Unit) Forecast, by Application 2019 & 2032
- Table 23: France Medical Billing Outsourcing Industry Revenue (Million) Forecast, by Application 2019 & 2032
- Table 24: France Medical Billing Outsourcing Industry Volume (K Unit) Forecast, by Application 2019 & 2032
- Table 25: Italy Medical Billing Outsourcing Industry Revenue (Million) Forecast, by Application 2019 & 2032
- Table 26: Italy Medical Billing Outsourcing Industry Volume (K Unit) Forecast, by Application 2019 & 2032
- Table 27: Spain Medical Billing Outsourcing Industry Revenue (Million) Forecast, by Application 2019 & 2032
- Table 28: Spain Medical Billing Outsourcing Industry Volume (K Unit) Forecast, by Application 2019 & 2032
- Table 29: Rest of Europe Medical Billing Outsourcing Industry Revenue (Million) Forecast, by Application 2019 & 2032
- Table 30: Rest of Europe Medical Billing Outsourcing Industry Volume (K Unit) Forecast, by Application 2019 & 2032
- Table 31: Global Medical Billing Outsourcing Industry Revenue Million Forecast, by Country 2019 & 2032
- Table 32: Global Medical Billing Outsourcing Industry Volume K Unit Forecast, by Country 2019 & 2032
- Table 33: China Medical Billing Outsourcing Industry Revenue (Million) Forecast, by Application 2019 & 2032
- Table 34: China Medical Billing Outsourcing Industry Volume (K Unit) Forecast, by Application 2019 & 2032
- Table 35: Japan Medical Billing Outsourcing Industry Revenue (Million) Forecast, by Application 2019 & 2032
- Table 36: Japan Medical Billing Outsourcing Industry Volume (K Unit) Forecast, by Application 2019 & 2032
- Table 37: India Medical Billing Outsourcing Industry Revenue (Million) Forecast, by Application 2019 & 2032
- Table 38: India Medical Billing Outsourcing Industry Volume (K Unit) Forecast, by Application 2019 & 2032
- Table 39: Australia Medical Billing Outsourcing Industry Revenue (Million) Forecast, by Application 2019 & 2032
- Table 40: Australia Medical Billing Outsourcing Industry Volume (K Unit) Forecast, by Application 2019 & 2032
- Table 41: South Korea Medical Billing Outsourcing Industry Revenue (Million) Forecast, by Application 2019 & 2032
- Table 42: South Korea Medical Billing Outsourcing Industry Volume (K Unit) Forecast, by Application 2019 & 2032
- Table 43: Rest of Asia Pacific Medical Billing Outsourcing Industry Revenue (Million) Forecast, by Application 2019 & 2032
- Table 44: Rest of Asia Pacific Medical Billing Outsourcing Industry Volume (K Unit) Forecast, by Application 2019 & 2032
- Table 45: Global Medical Billing Outsourcing Industry Revenue Million Forecast, by Country 2019 & 2032
- Table 46: Global Medical Billing Outsourcing Industry Volume K Unit Forecast, by Country 2019 & 2032
- Table 47: GCC Medical Billing Outsourcing Industry Revenue (Million) Forecast, by Application 2019 & 2032
- Table 48: GCC Medical Billing Outsourcing Industry Volume (K Unit) Forecast, by Application 2019 & 2032
- Table 49: South Africa Medical Billing Outsourcing Industry Revenue (Million) Forecast, by Application 2019 & 2032
- Table 50: South Africa Medical Billing Outsourcing Industry Volume (K Unit) Forecast, by Application 2019 & 2032
- Table 51: Rest of Middle East and Africa Medical Billing Outsourcing Industry Revenue (Million) Forecast, by Application 2019 & 2032
- Table 52: Rest of Middle East and Africa Medical Billing Outsourcing Industry Volume (K Unit) Forecast, by Application 2019 & 2032
- Table 53: Global Medical Billing Outsourcing Industry Revenue Million Forecast, by Country 2019 & 2032
- Table 54: Global Medical Billing Outsourcing Industry Volume K Unit Forecast, by Country 2019 & 2032
- Table 55: Brazil Medical Billing Outsourcing Industry Revenue (Million) Forecast, by Application 2019 & 2032
- Table 56: Brazil Medical Billing Outsourcing Industry Volume (K Unit) Forecast, by Application 2019 & 2032
- Table 57: Argentina Medical Billing Outsourcing Industry Revenue (Million) Forecast, by Application 2019 & 2032
- Table 58: Argentina Medical Billing Outsourcing Industry Volume (K Unit) Forecast, by Application 2019 & 2032
- Table 59: Rest of South America Medical Billing Outsourcing Industry Revenue (Million) Forecast, by Application 2019 & 2032
- Table 60: Rest of South America Medical Billing Outsourcing Industry Volume (K Unit) Forecast, by Application 2019 & 2032
- Table 61: Global Medical Billing Outsourcing Industry Revenue Million Forecast, by Service 2019 & 2032
- Table 62: Global Medical Billing Outsourcing Industry Volume K Unit Forecast, by Service 2019 & 2032
- Table 63: Global Medical Billing Outsourcing Industry Revenue Million Forecast, by End User 2019 & 2032
- Table 64: Global Medical Billing Outsourcing Industry Volume K Unit Forecast, by End User 2019 & 2032
- Table 65: Global Medical Billing Outsourcing Industry Revenue Million Forecast, by Country 2019 & 2032
- Table 66: Global Medical Billing Outsourcing Industry Volume K Unit Forecast, by Country 2019 & 2032
- Table 67: United States Medical Billing Outsourcing Industry Revenue (Million) Forecast, by Application 2019 & 2032
- Table 68: United States Medical Billing Outsourcing Industry Volume (K Unit) Forecast, by Application 2019 & 2032
- Table 69: Canada Medical Billing Outsourcing Industry Revenue (Million) Forecast, by Application 2019 & 2032
- Table 70: Canada Medical Billing Outsourcing Industry Volume (K Unit) Forecast, by Application 2019 & 2032
- Table 71: Mexico Medical Billing Outsourcing Industry Revenue (Million) Forecast, by Application 2019 & 2032
- Table 72: Mexico Medical Billing Outsourcing Industry Volume (K Unit) Forecast, by Application 2019 & 2032
- Table 73: Global Medical Billing Outsourcing Industry Revenue Million Forecast, by Service 2019 & 2032
- Table 74: Global Medical Billing Outsourcing Industry Volume K Unit Forecast, by Service 2019 & 2032
- Table 75: Global Medical Billing Outsourcing Industry Revenue Million Forecast, by End User 2019 & 2032
- Table 76: Global Medical Billing Outsourcing Industry Volume K Unit Forecast, by End User 2019 & 2032
- Table 77: Global Medical Billing Outsourcing Industry Revenue Million Forecast, by Country 2019 & 2032
- Table 78: Global Medical Billing Outsourcing Industry Volume K Unit Forecast, by Country 2019 & 2032
- Table 79: Germany Medical Billing Outsourcing Industry Revenue (Million) Forecast, by Application 2019 & 2032
- Table 80: Germany Medical Billing Outsourcing Industry Volume (K Unit) Forecast, by Application 2019 & 2032
- Table 81: United Kingdom Medical Billing Outsourcing Industry Revenue (Million) Forecast, by Application 2019 & 2032
- Table 82: United Kingdom Medical Billing Outsourcing Industry Volume (K Unit) Forecast, by Application 2019 & 2032
- Table 83: France Medical Billing Outsourcing Industry Revenue (Million) Forecast, by Application 2019 & 2032
- Table 84: France Medical Billing Outsourcing Industry Volume (K Unit) Forecast, by Application 2019 & 2032
- Table 85: Italy Medical Billing Outsourcing Industry Revenue (Million) Forecast, by Application 2019 & 2032
- Table 86: Italy Medical Billing Outsourcing Industry Volume (K Unit) Forecast, by Application 2019 & 2032
- Table 87: Spain Medical Billing Outsourcing Industry Revenue (Million) Forecast, by Application 2019 & 2032
- Table 88: Spain Medical Billing Outsourcing Industry Volume (K Unit) Forecast, by Application 2019 & 2032
- Table 89: Rest of Europe Medical Billing Outsourcing Industry Revenue (Million) Forecast, by Application 2019 & 2032
- Table 90: Rest of Europe Medical Billing Outsourcing Industry Volume (K Unit) Forecast, by Application 2019 & 2032
- Table 91: Global Medical Billing Outsourcing Industry Revenue Million Forecast, by Service 2019 & 2032
- Table 92: Global Medical Billing Outsourcing Industry Volume K Unit Forecast, by Service 2019 & 2032
- Table 93: Global Medical Billing Outsourcing Industry Revenue Million Forecast, by End User 2019 & 2032
- Table 94: Global Medical Billing Outsourcing Industry Volume K Unit Forecast, by End User 2019 & 2032
- Table 95: Global Medical Billing Outsourcing Industry Revenue Million Forecast, by Country 2019 & 2032
- Table 96: Global Medical Billing Outsourcing Industry Volume K Unit Forecast, by Country 2019 & 2032
- Table 97: China Medical Billing Outsourcing Industry Revenue (Million) Forecast, by Application 2019 & 2032
- Table 98: China Medical Billing Outsourcing Industry Volume (K Unit) Forecast, by Application 2019 & 2032
- Table 99: Japan Medical Billing Outsourcing Industry Revenue (Million) Forecast, by Application 2019 & 2032
- Table 100: Japan Medical Billing Outsourcing Industry Volume (K Unit) Forecast, by Application 2019 & 2032
- Table 101: India Medical Billing Outsourcing Industry Revenue (Million) Forecast, by Application 2019 & 2032
- Table 102: India Medical Billing Outsourcing Industry Volume (K Unit) Forecast, by Application 2019 & 2032
- Table 103: Australia Medical Billing Outsourcing Industry Revenue (Million) Forecast, by Application 2019 & 2032
- Table 104: Australia Medical Billing Outsourcing Industry Volume (K Unit) Forecast, by Application 2019 & 2032
- Table 105: South Korea Medical Billing Outsourcing Industry Revenue (Million) Forecast, by Application 2019 & 2032
- Table 106: South Korea Medical Billing Outsourcing Industry Volume (K Unit) Forecast, by Application 2019 & 2032
- Table 107: Rest of Asia Pacific Medical Billing Outsourcing Industry Revenue (Million) Forecast, by Application 2019 & 2032
- Table 108: Rest of Asia Pacific Medical Billing Outsourcing Industry Volume (K Unit) Forecast, by Application 2019 & 2032
- Table 109: Global Medical Billing Outsourcing Industry Revenue Million Forecast, by Service 2019 & 2032
- Table 110: Global Medical Billing Outsourcing Industry Volume K Unit Forecast, by Service 2019 & 2032
- Table 111: Global Medical Billing Outsourcing Industry Revenue Million Forecast, by End User 2019 & 2032
- Table 112: Global Medical Billing Outsourcing Industry Volume K Unit Forecast, by End User 2019 & 2032
- Table 113: Global Medical Billing Outsourcing Industry Revenue Million Forecast, by Country 2019 & 2032
- Table 114: Global Medical Billing Outsourcing Industry Volume K Unit Forecast, by Country 2019 & 2032
- Table 115: GCC Medical Billing Outsourcing Industry Revenue (Million) Forecast, by Application 2019 & 2032
- Table 116: GCC Medical Billing Outsourcing Industry Volume (K Unit) Forecast, by Application 2019 & 2032
- Table 117: South Africa Medical Billing Outsourcing Industry Revenue (Million) Forecast, by Application 2019 & 2032
- Table 118: South Africa Medical Billing Outsourcing Industry Volume (K Unit) Forecast, by Application 2019 & 2032
- Table 119: Rest of Middle East and Africa Medical Billing Outsourcing Industry Revenue (Million) Forecast, by Application 2019 & 2032
- Table 120: Rest of Middle East and Africa Medical Billing Outsourcing Industry Volume (K Unit) Forecast, by Application 2019 & 2032
- Table 121: Global Medical Billing Outsourcing Industry Revenue Million Forecast, by Service 2019 & 2032
- Table 122: Global Medical Billing Outsourcing Industry Volume K Unit Forecast, by Service 2019 & 2032
- Table 123: Global Medical Billing Outsourcing Industry Revenue Million Forecast, by End User 2019 & 2032
- Table 124: Global Medical Billing Outsourcing Industry Volume K Unit Forecast, by End User 2019 & 2032
- Table 125: Global Medical Billing Outsourcing Industry Revenue Million Forecast, by Country 2019 & 2032
- Table 126: Global Medical Billing Outsourcing Industry Volume K Unit Forecast, by Country 2019 & 2032
- Table 127: Brazil Medical Billing Outsourcing Industry Revenue (Million) Forecast, by Application 2019 & 2032
- Table 128: Brazil Medical Billing Outsourcing Industry Volume (K Unit) Forecast, by Application 2019 & 2032
- Table 129: Argentina Medical Billing Outsourcing Industry Revenue (Million) Forecast, by Application 2019 & 2032
- Table 130: Argentina Medical Billing Outsourcing Industry Volume (K Unit) Forecast, by Application 2019 & 2032
- Table 131: Rest of South America Medical Billing Outsourcing Industry Revenue (Million) Forecast, by Application 2019 & 2032
- Table 132: Rest of South America Medical Billing Outsourcing Industry Volume (K Unit) Forecast, by Application 2019 & 2032
Frequently Asked Questions
1. What is the projected Compound Annual Growth Rate (CAGR) of the Medical Billing Outsourcing Industry?
The projected CAGR is approximately 11.36%.
2. Which companies are prominent players in the Medical Billing Outsourcing Industry?
Key companies in the market include Kareo, HCL Technologies, R1 RCM Inc, GE Healthcare, Genpact, Experian Information Solutions Inc, Quest Diagnostics, Cerner Corporation, Allscripts Healthcare Solutions Inc, The SSI Groups, McKesson Corporation, EClinicalWorks.
3. What are the main segments of the Medical Billing Outsourcing Industry?
The market segments include Service, End User.
4. Can you provide details about the market size?
The market size is estimated to be USD 15.41 Million as of 2022.
5. What are some drivers contributing to market growth?
Growing Emphasis on Compliance and Risk Management; Increasing Need to Make Billing Processes Efficient; Efforts to Contain and Decrease In-house Processing Costs.
6. What are the notable trends driving market growth?
Hospital Outsourced Medical Billing is Expected to Grow at a Good Rate Over the Forecast Period.
7. Are there any restraints impacting market growth?
Increasing Legislative and Regulatory Pressure; High Costs of Technology and Privacy Issues.
8. Can you provide examples of recent developments in the market?
In November 2020, Conduent Incorporated announced a commercial agreement with Experian Health, a leading provider of revenue cycle management products that include patient engagement, patient access, and patient collections. The agreement allows Conduent's digital IntelliHealth platform to connect with Experian's consumer data and electronic income verification tool to speed prescription drug assistance approvals and shorten prescription fulfillment and time to therapy.
9. What pricing options are available for accessing the report?
Pricing options include single-user, multi-user, and enterprise licenses priced at USD 4750, USD 5250, and USD 8750 respectively.
10. Is the market size provided in terms of value or volume?
The market size is provided in terms of value, measured in Million and volume, measured in K Unit.
11. Are there any specific market keywords associated with the report?
Yes, the market keyword associated with the report is "Medical Billing Outsourcing Industry," which aids in identifying and referencing the specific market segment covered.
12. How do I determine which pricing option suits my needs best?
The pricing options vary based on user requirements and access needs. Individual users may opt for single-user licenses, while businesses requiring broader access may choose multi-user or enterprise licenses for cost-effective access to the report.
13. Are there any additional resources or data provided in the Medical Billing Outsourcing Industry report?
While the report offers comprehensive insights, it's advisable to review the specific contents or supplementary materials provided to ascertain if additional resources or data are available.
14. How can I stay updated on further developments or reports in the Medical Billing Outsourcing Industry?
To stay informed about further developments, trends, and reports in the Medical Billing Outsourcing Industry, consider subscribing to industry newsletters, following relevant companies and organizations, or regularly checking reputable industry news sources and publications.
Methodology
Step 1 - Identification of Relevant Samples Size from Population Database


Step 2 - Approaches for Defining Global Market Size (Value, Volume* & Price*)

Note*: In applicable scenarios
Step 3 - Data Sources
Primary Research
- Web Analytics
- Survey Reports
- Research Institute
- Latest Research Reports
- Opinion Leaders
Secondary Research
- Annual Reports
- White Paper
- Latest Press Release
- Industry Association
- Paid Database
- Investor Presentations

Step 4 - Data Triangulation
Involves using different sources of information in order to increase the validity of a study
These sources are likely to be stakeholders in a program - participants, other researchers, program staff, other community members, and so on.
Then we put all data in single framework & apply various statistical tools to find out the dynamic on the market.
During the analysis stage, feedback from the stakeholder groups would be compared to determine areas of agreement as well as areas of divergence


