
Key Insights
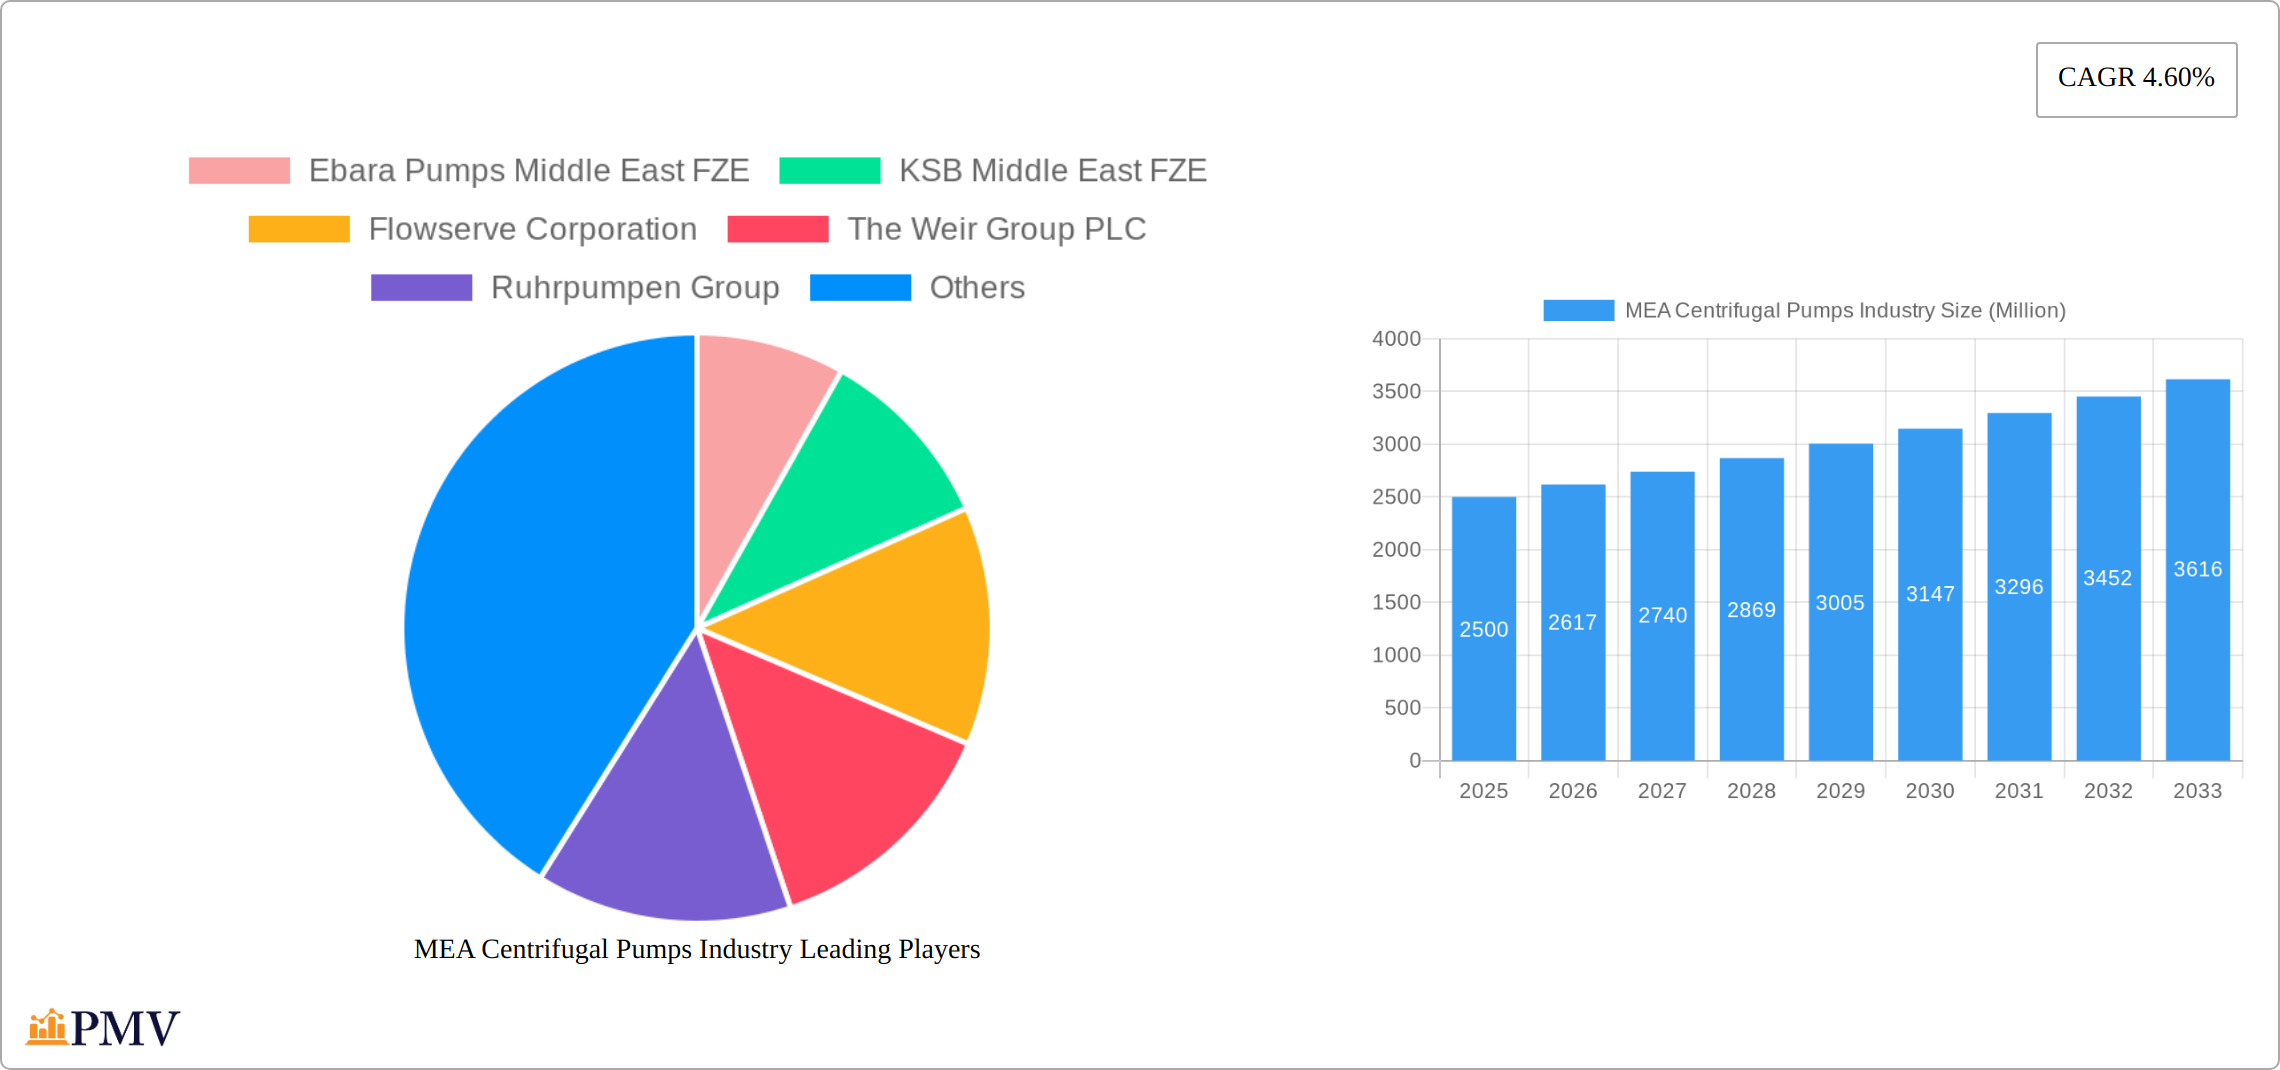
The Middle East and Africa (MEA) centrifugal pumps market is experiencing steady growth, projected at a CAGR of 4.60% from 2025 to 2033. This expansion is driven primarily by increasing investments in infrastructure projects across the region, particularly within the oil & gas, water & wastewater, and construction sectors. The rising demand for efficient and reliable fluid handling solutions in these industries is fueling market expansion. Furthermore, the growing adoption of advanced pump technologies, such as those with enhanced energy efficiency and improved operational reliability, contributes to market growth. The multi-stage segment holds a significant market share due to its suitability for high-pressure applications prevalent in oil & gas and water treatment facilities. Major players like Ebara Pumps Middle East FZE, KSB Middle East FZE, and Flowserve Corporation are strategically focusing on technological advancements and strategic partnerships to maintain their competitive edge. Geographical growth is expected to be particularly strong in Saudi Arabia and the United Arab Emirates due to large-scale infrastructure developments and industrial expansions.
However, the market faces certain challenges. Fluctuations in oil prices can impact investment decisions in oil & gas projects, affecting demand for centrifugal pumps. Additionally, stringent environmental regulations and the rising cost of raw materials pose restraints on market growth. Nevertheless, the long-term outlook remains positive, driven by sustained infrastructure development and the growing need for efficient fluid handling across various industries. The increasing adoption of smart technologies and the focus on sustainable solutions are expected to further shape the market landscape in the coming years. Competitive intensity is high, with major international players and regional manufacturers vying for market share. Differentiation through technological advancements and superior customer service will be key success factors for businesses operating in this dynamic market.
MEA Centrifugal Pumps Industry: A Comprehensive Market Report (2019-2033)
This in-depth report provides a comprehensive analysis of the Middle East and Africa (MEA) centrifugal pumps industry, offering invaluable insights for stakeholders seeking to understand market dynamics, competitive landscapes, and future growth potential. The study period covers 2019-2033, with 2025 as the base and estimated year. The forecast period spans 2025-2033, and the historical period encompasses 2019-2024. The report is segmented by flow type (axial, radial, mixed), number of stages (single stage, multi-stage), end-user industry (oil & gas, food & beverages, water & wastewater, pharma, power, construction, metal & mining, others), and country (Saudi Arabia, United Arab Emirates, South Africa, Rest of MEA). The total market size in 2025 is estimated at xx Million USD.
MEA Centrifugal Pumps Industry Market Structure & Competitive Dynamics
The MEA centrifugal pumps market exhibits a moderately concentrated structure, with several multinational corporations and regional players vying for market share. Key players such as Ebara Pumps Middle East FZE, KSB Middle East FZE, Flowserve Corporation, The Weir Group PLC, and Ruhrpumpen Group hold significant positions, often characterized by intense competition based on pricing, product differentiation, and service offerings. Market share data for 2025 indicates that the top five players collectively account for approximately xx% of the total market revenue. The industry is subject to evolving regulatory frameworks related to environmental compliance and safety standards, influencing product design and operational practices. The presence of substitute technologies, such as positive displacement pumps, necessitates continuous innovation to maintain market competitiveness. Mergers and acquisitions (M&A) activity has been moderate in recent years, with deal values totaling approximately xx Million USD between 2019 and 2024, primarily driven by strategic expansion and technological integration. For example, Wilo Middle East's acquisition of PumpsPro in 2021 signifies the ongoing consolidation within the sector. Furthermore, end-user trends towards automation and digitalization are driving demand for smart pumps with advanced monitoring and control capabilities. This necessitates an agile approach to technology adoption for industry participants.
MEA Centrifugal Pumps Industry Industry Trends & Insights
The Middle East and Africa (MEA) centrifugal pumps market is poised for robust expansion, projected to achieve a significant Compound Annual Growth Rate (CAGR) throughout the forecast period (2025-2033). This growth is primarily fueled by the region's booming infrastructure development, particularly within the oil & gas, water & wastewater, and construction sectors. Rapid urbanization and industrialization across the MEA are key contributing factors. Furthermore, the market is experiencing a technological shift, with a growing adoption of energy-efficient designs and smart pump technologies. These advancements deliver substantial operational cost savings and improved performance, driving increased market penetration. A rising consumer preference for eco-friendly and sustainable solutions is also influencing manufacturers to prioritize energy efficiency and minimize environmental impact in their product development. The competitive landscape remains dynamic, with established international players facing competition from emerging regional manufacturers offering cost-competitive alternatives. Market forecasts indicate a substantial increase in the penetration of energy-efficient pumps by 2033.
Dominant Markets & Segments in MEA Centrifugal Pumps Industry
The MEA centrifugal pumps market exhibits diverse growth patterns across various segments and countries. Key market dynamics are shaped by several factors.
- By Country: The United Arab Emirates (UAE) and Saudi Arabia remain the leading markets, driven by massive infrastructure projects and substantial investments in the oil & gas sector. South Africa also presents a significant market opportunity, fueled by its robust mining and water infrastructure development. Other key markets include Egypt, Nigeria, and Kenya, each experiencing unique growth drivers.
- By Flow Type: Radial pumps currently dominate the market share due to their versatility and suitability for a wide range of applications. However, the demand for axial pumps is expected to rise steadily, driven by applications requiring high flow rates at lower heads.
- By Number of Stages: Single-stage pumps currently hold the largest market share owing to their simplicity and cost-effectiveness. Nevertheless, multi-stage pumps are poised for growth, catering to high-pressure applications requiring enhanced pressure capabilities.
- By End-User Industry: The oil & gas sector continues to be a major driver of demand, followed closely by the water & wastewater and construction industries. Significant growth opportunities also exist within the food & beverage, pharmaceutical, and power generation sectors.
The dominance of these segments is attributed to strong government support for infrastructure development, favorable economic policies, and expanding industrial activity. Large-scale projects in the UAE and Saudi Arabia's Vision 2030 program are prime examples of initiatives driving substantial market expansion.
MEA Centrifugal Pumps Industry Product Innovations
Recent product innovations in the MEA centrifugal pumps market focus on energy efficiency, improved performance, and enhanced durability. Manufacturers are increasingly integrating advanced materials, such as high-strength alloys and composites, to enhance pump lifespan and reduce maintenance requirements. Smart pump technologies, featuring remote monitoring and predictive maintenance capabilities, are gaining traction. These innovations are aligned with industry trends towards automation and digitalization, offering significant operational benefits to end-users. The market is witnessing a shift toward more compact and modular pump designs to improve space efficiency and reduce installation costs.
Report Segmentation & Scope
This report offers a granular segmentation of the MEA centrifugal pumps market:
- By Flow Type: Axial, radial, and mixed flow pumps are analyzed, considering their unique applications and market trends.
- By Number of Stages: Single-stage and multi-stage pumps are assessed, highlighting their respective advantages and growth prospects.
- By End-User Industry: Detailed analysis covers oil & gas, food & beverages, water & wastewater, pharma, power, construction, metal & mining, and others. Growth projections and competitive dynamics are provided for each segment.
- By Country: The report scrutinizes Saudi Arabia, the UAE, South Africa, and the Rest of MEA, considering country-specific factors driving market expansion.
Each segment features detailed growth projections, market size estimations, and competitive analysis, providing actionable insights for strategic decision-making.
Key Drivers of MEA Centrifugal Pumps Industry Growth
The growth trajectory of the MEA centrifugal pumps market is propelled by several interconnected factors:
- Robust Infrastructure Development: Massive investments in infrastructure projects throughout the region, especially in water management and oil & gas, are creating significant demand for centrifugal pumps.
- Rapid Industrialization: The ongoing industrialization across MEA nations is fueling the need for efficient and reliable pumping solutions across diverse sectors.
- Technological Advancements: Continuous innovation in pump design and materials is resulting in improved energy efficiency, enhanced reliability, and superior performance, making pumps more attractive to businesses.
- Government Initiatives: Supportive government policies and initiatives focused on infrastructure development and industrial growth are creating a favorable environment for market expansion.
- Growing Awareness of Sustainability: Increased awareness of environmental concerns is driving demand for energy-efficient and eco-friendly pump solutions.
Challenges in the MEA Centrifugal Pumps Industry Sector
The MEA centrifugal pumps industry faces several challenges:
- Fluctuating Oil Prices: Dependence on oil-related industries makes the market susceptible to price volatility, impacting investment decisions.
- Supply Chain Disruptions: Global supply chain uncertainties can affect the availability of raw materials and components.
- Stringent Regulatory Compliance: Adherence to environmental regulations and safety standards presents operational challenges.
Leading Players in the MEA Centrifugal Pumps Industry Market
- Ebara Pumps Middle East FZE
- KSB Middle East FZE
- Flowserve Corporation
- The Weir Group PLC
- Ruhrpumpen Group
- Dover Corporation
- Baker Hughes Company
- Xylem Inc
- Schlumberger Limited
- Parker Hannifin Corp
Key Developments in MEA Centrifugal Pumps Industry Sector
- June 2021: Amarinth secured a significant order for 14 API 610 VS4 vertical pumps for the ADNOC Ruwais Refinery East in the UAE, highlighting the demand for high-specification pumps in the oil & gas sector.
- February 2021: Wilo Middle East's acquisition of PumpsPro strengthened its market position as a comprehensive solution provider in the UAE and wider MEA region.
Strategic MEA Centrifugal Pumps Industry Market Outlook
The MEA centrifugal pumps market offers considerable growth potential, driven by consistent infrastructure development, accelerating industrialization, and ongoing technological advancements. Strategic opportunities abound in developing energy-efficient, smart pump technologies tailored to the unique needs of the region. A focus on sustainable solutions and establishing robust partnerships with regional distributors will be crucial for success. The market is poised for continued expansion, presenting attractive opportunities for both established industry players and new entrants. Further research into specific regional needs and emerging technologies will be vital for gaining a competitive edge.
MEA Centrifugal Pumps Industry Segmentation
-
1. Flow Type
- 1.1. Axial
- 1.2. Radial
- 1.3. Mixed
-
2. Number of Stages
- 2.1. Single Stage
- 2.2. Multi Stage
-
3. End-User Industry
- 3.1. Oil & Gas
- 3.2. Food & Beverages
- 3.3. Water & Wastewater
- 3.4. Pharma
- 3.5. Power
- 3.6. Construction
- 3.7. Metal & Mining
- 3.8. Others
MEA Centrifugal Pumps Industry Segmentation By Geography
-
1. North America
- 1.1. United States
- 1.2. Canada
- 1.3. Mexico
-
2. South America
- 2.1. Brazil
- 2.2. Argentina
- 2.3. Rest of South America
-
3. Europe
- 3.1. United Kingdom
- 3.2. Germany
- 3.3. France
- 3.4. Italy
- 3.5. Spain
- 3.6. Russia
- 3.7. Benelux
- 3.8. Nordics
- 3.9. Rest of Europe
-
4. Middle East & Africa
- 4.1. Turkey
- 4.2. Israel
- 4.3. GCC
- 4.4. North Africa
- 4.5. South Africa
- 4.6. Rest of Middle East & Africa
-
5. Asia Pacific
- 5.1. China
- 5.2. India
- 5.3. Japan
- 5.4. South Korea
- 5.5. ASEAN
- 5.6. Oceania
- 5.7. Rest of Asia Pacific
MEA Centrifugal Pumps Industry REPORT HIGHLIGHTS
| Aspects | Details |
|---|---|
| Study Period | 2019-2033 |
| Base Year | 2024 |
| Estimated Year | 2025 |
| Forecast Period | 2025-2033 |
| Historical Period | 2019-2024 |
| Growth Rate | CAGR of 4.60% from 2019-2033 |
| Segmentation |
|
Table of Contents
- 1. Introduction
- 1.1. Research Scope
- 1.2. Market Segmentation
- 1.3. Research Methodology
- 1.4. Definitions and Assumptions
- 2. Executive Summary
- 2.1. Introduction
- 3. Market Dynamics
- 3.1. Introduction
- 3.2. Market Drivers
- 3.2.1. Rapid Industrialization & Urbanization; Increasing Investments in Urban Waste-Water Sector
- 3.3. Market Restrains
- 3.3.1. High Acquisition and Maintenace Cost of Industrial CT systems
- 3.4. Market Trends
- 3.4.1. Water and Wastewater Management to Drive the Demand for Centrifugal Pumps
- 4. Market Factor Analysis
- 4.1. Porters Five Forces
- 4.2. Supply/Value Chain
- 4.3. PESTEL analysis
- 4.4. Market Entropy
- 4.5. Patent/Trademark Analysis
- 5. Global MEA Centrifugal Pumps Industry Analysis, Insights and Forecast, 2019-2031
- 5.1. Market Analysis, Insights and Forecast - by Flow Type
- 5.1.1. Axial
- 5.1.2. Radial
- 5.1.3. Mixed
- 5.2. Market Analysis, Insights and Forecast - by Number of Stages
- 5.2.1. Single Stage
- 5.2.2. Multi Stage
- 5.3. Market Analysis, Insights and Forecast - by End-User Industry
- 5.3.1. Oil & Gas
- 5.3.2. Food & Beverages
- 5.3.3. Water & Wastewater
- 5.3.4. Pharma
- 5.3.5. Power
- 5.3.6. Construction
- 5.3.7. Metal & Mining
- 5.3.8. Others
- 5.4. Market Analysis, Insights and Forecast - by Region
- 5.4.1. North America
- 5.4.2. South America
- 5.4.3. Europe
- 5.4.4. Middle East & Africa
- 5.4.5. Asia Pacific
- 5.1. Market Analysis, Insights and Forecast - by Flow Type
- 6. North America MEA Centrifugal Pumps Industry Analysis, Insights and Forecast, 2019-2031
- 6.1. Market Analysis, Insights and Forecast - by Flow Type
- 6.1.1. Axial
- 6.1.2. Radial
- 6.1.3. Mixed
- 6.2. Market Analysis, Insights and Forecast - by Number of Stages
- 6.2.1. Single Stage
- 6.2.2. Multi Stage
- 6.3. Market Analysis, Insights and Forecast - by End-User Industry
- 6.3.1. Oil & Gas
- 6.3.2. Food & Beverages
- 6.3.3. Water & Wastewater
- 6.3.4. Pharma
- 6.3.5. Power
- 6.3.6. Construction
- 6.3.7. Metal & Mining
- 6.3.8. Others
- 6.1. Market Analysis, Insights and Forecast - by Flow Type
- 7. South America MEA Centrifugal Pumps Industry Analysis, Insights and Forecast, 2019-2031
- 7.1. Market Analysis, Insights and Forecast - by Flow Type
- 7.1.1. Axial
- 7.1.2. Radial
- 7.1.3. Mixed
- 7.2. Market Analysis, Insights and Forecast - by Number of Stages
- 7.2.1. Single Stage
- 7.2.2. Multi Stage
- 7.3. Market Analysis, Insights and Forecast - by End-User Industry
- 7.3.1. Oil & Gas
- 7.3.2. Food & Beverages
- 7.3.3. Water & Wastewater
- 7.3.4. Pharma
- 7.3.5. Power
- 7.3.6. Construction
- 7.3.7. Metal & Mining
- 7.3.8. Others
- 7.1. Market Analysis, Insights and Forecast - by Flow Type
- 8. Europe MEA Centrifugal Pumps Industry Analysis, Insights and Forecast, 2019-2031
- 8.1. Market Analysis, Insights and Forecast - by Flow Type
- 8.1.1. Axial
- 8.1.2. Radial
- 8.1.3. Mixed
- 8.2. Market Analysis, Insights and Forecast - by Number of Stages
- 8.2.1. Single Stage
- 8.2.2. Multi Stage
- 8.3. Market Analysis, Insights and Forecast - by End-User Industry
- 8.3.1. Oil & Gas
- 8.3.2. Food & Beverages
- 8.3.3. Water & Wastewater
- 8.3.4. Pharma
- 8.3.5. Power
- 8.3.6. Construction
- 8.3.7. Metal & Mining
- 8.3.8. Others
- 8.1. Market Analysis, Insights and Forecast - by Flow Type
- 9. Middle East & Africa MEA Centrifugal Pumps Industry Analysis, Insights and Forecast, 2019-2031
- 9.1. Market Analysis, Insights and Forecast - by Flow Type
- 9.1.1. Axial
- 9.1.2. Radial
- 9.1.3. Mixed
- 9.2. Market Analysis, Insights and Forecast - by Number of Stages
- 9.2.1. Single Stage
- 9.2.2. Multi Stage
- 9.3. Market Analysis, Insights and Forecast - by End-User Industry
- 9.3.1. Oil & Gas
- 9.3.2. Food & Beverages
- 9.3.3. Water & Wastewater
- 9.3.4. Pharma
- 9.3.5. Power
- 9.3.6. Construction
- 9.3.7. Metal & Mining
- 9.3.8. Others
- 9.1. Market Analysis, Insights and Forecast - by Flow Type
- 10. Asia Pacific MEA Centrifugal Pumps Industry Analysis, Insights and Forecast, 2019-2031
- 10.1. Market Analysis, Insights and Forecast - by Flow Type
- 10.1.1. Axial
- 10.1.2. Radial
- 10.1.3. Mixed
- 10.2. Market Analysis, Insights and Forecast - by Number of Stages
- 10.2.1. Single Stage
- 10.2.2. Multi Stage
- 10.3. Market Analysis, Insights and Forecast - by End-User Industry
- 10.3.1. Oil & Gas
- 10.3.2. Food & Beverages
- 10.3.3. Water & Wastewater
- 10.3.4. Pharma
- 10.3.5. Power
- 10.3.6. Construction
- 10.3.7. Metal & Mining
- 10.3.8. Others
- 10.1. Market Analysis, Insights and Forecast - by Flow Type
- 11. North America MEA Centrifugal Pumps Industry Analysis, Insights and Forecast, 2019-2031
- 11.1. Market Analysis, Insights and Forecast - By Country/Sub-region
- 11.1.1.
- 12. Europe MEA Centrifugal Pumps Industry Analysis, Insights and Forecast, 2019-2031
- 12.1. Market Analysis, Insights and Forecast - By Country/Sub-region
- 12.1.1.
- 13. Asia Pacific MEA Centrifugal Pumps Industry Analysis, Insights and Forecast, 2019-2031
- 13.1. Market Analysis, Insights and Forecast - By Country/Sub-region
- 13.1.1.
- 14. Latin America MEA Centrifugal Pumps Industry Analysis, Insights and Forecast, 2019-2031
- 14.1. Market Analysis, Insights and Forecast - By Country/Sub-region
- 14.1.1.
- 15. Middle East and Africa MEA Centrifugal Pumps Industry Analysis, Insights and Forecast, 2019-2031
- 15.1. Market Analysis, Insights and Forecast - By Country/Sub-region
- 15.1.1.
- 16. Competitive Analysis
- 16.1. Global Market Share Analysis 2024
- 16.2. Company Profiles
- 16.2.1 Ebara Pumps Middle East FZE
- 16.2.1.1. Overview
- 16.2.1.2. Products
- 16.2.1.3. SWOT Analysis
- 16.2.1.4. Recent Developments
- 16.2.1.5. Financials (Based on Availability)
- 16.2.2 KSB Middle East FZE
- 16.2.2.1. Overview
- 16.2.2.2. Products
- 16.2.2.3. SWOT Analysis
- 16.2.2.4. Recent Developments
- 16.2.2.5. Financials (Based on Availability)
- 16.2.3 Flowserve Corporation
- 16.2.3.1. Overview
- 16.2.3.2. Products
- 16.2.3.3. SWOT Analysis
- 16.2.3.4. Recent Developments
- 16.2.3.5. Financials (Based on Availability)
- 16.2.4 The Weir Group PLC
- 16.2.4.1. Overview
- 16.2.4.2. Products
- 16.2.4.3. SWOT Analysis
- 16.2.4.4. Recent Developments
- 16.2.4.5. Financials (Based on Availability)
- 16.2.5 Ruhrpumpen Group
- 16.2.5.1. Overview
- 16.2.5.2. Products
- 16.2.5.3. SWOT Analysis
- 16.2.5.4. Recent Developments
- 16.2.5.5. Financials (Based on Availability)
- 16.2.6 Dover Corporation
- 16.2.6.1. Overview
- 16.2.6.2. Products
- 16.2.6.3. SWOT Analysis
- 16.2.6.4. Recent Developments
- 16.2.6.5. Financials (Based on Availability)
- 16.2.7 Baker Hughes Company
- 16.2.7.1. Overview
- 16.2.7.2. Products
- 16.2.7.3. SWOT Analysis
- 16.2.7.4. Recent Developments
- 16.2.7.5. Financials (Based on Availability)
- 16.2.8 Xylem Inc
- 16.2.8.1. Overview
- 16.2.8.2. Products
- 16.2.8.3. SWOT Analysis
- 16.2.8.4. Recent Developments
- 16.2.8.5. Financials (Based on Availability)
- 16.2.9 Schlumberger Limited
- 16.2.9.1. Overview
- 16.2.9.2. Products
- 16.2.9.3. SWOT Analysis
- 16.2.9.4. Recent Developments
- 16.2.9.5. Financials (Based on Availability)
- 16.2.10 Parker Hannifin Corp
- 16.2.10.1. Overview
- 16.2.10.2. Products
- 16.2.10.3. SWOT Analysis
- 16.2.10.4. Recent Developments
- 16.2.10.5. Financials (Based on Availability)
- 16.2.1 Ebara Pumps Middle East FZE
List of Figures
- Figure 1: Global MEA Centrifugal Pumps Industry Revenue Breakdown (Million, %) by Region 2024 & 2032
- Figure 2: Global MEA Centrifugal Pumps Industry Volume Breakdown (K Unit, %) by Region 2024 & 2032
- Figure 3: North America MEA Centrifugal Pumps Industry Revenue (Million), by Country 2024 & 2032
- Figure 4: North America MEA Centrifugal Pumps Industry Volume (K Unit), by Country 2024 & 2032
- Figure 5: North America MEA Centrifugal Pumps Industry Revenue Share (%), by Country 2024 & 2032
- Figure 6: North America MEA Centrifugal Pumps Industry Volume Share (%), by Country 2024 & 2032
- Figure 7: Europe MEA Centrifugal Pumps Industry Revenue (Million), by Country 2024 & 2032
- Figure 8: Europe MEA Centrifugal Pumps Industry Volume (K Unit), by Country 2024 & 2032
- Figure 9: Europe MEA Centrifugal Pumps Industry Revenue Share (%), by Country 2024 & 2032
- Figure 10: Europe MEA Centrifugal Pumps Industry Volume Share (%), by Country 2024 & 2032
- Figure 11: Asia Pacific MEA Centrifugal Pumps Industry Revenue (Million), by Country 2024 & 2032
- Figure 12: Asia Pacific MEA Centrifugal Pumps Industry Volume (K Unit), by Country 2024 & 2032
- Figure 13: Asia Pacific MEA Centrifugal Pumps Industry Revenue Share (%), by Country 2024 & 2032
- Figure 14: Asia Pacific MEA Centrifugal Pumps Industry Volume Share (%), by Country 2024 & 2032
- Figure 15: Latin America MEA Centrifugal Pumps Industry Revenue (Million), by Country 2024 & 2032
- Figure 16: Latin America MEA Centrifugal Pumps Industry Volume (K Unit), by Country 2024 & 2032
- Figure 17: Latin America MEA Centrifugal Pumps Industry Revenue Share (%), by Country 2024 & 2032
- Figure 18: Latin America MEA Centrifugal Pumps Industry Volume Share (%), by Country 2024 & 2032
- Figure 19: Middle East and Africa MEA Centrifugal Pumps Industry Revenue (Million), by Country 2024 & 2032
- Figure 20: Middle East and Africa MEA Centrifugal Pumps Industry Volume (K Unit), by Country 2024 & 2032
- Figure 21: Middle East and Africa MEA Centrifugal Pumps Industry Revenue Share (%), by Country 2024 & 2032
- Figure 22: Middle East and Africa MEA Centrifugal Pumps Industry Volume Share (%), by Country 2024 & 2032
- Figure 23: North America MEA Centrifugal Pumps Industry Revenue (Million), by Flow Type 2024 & 2032
- Figure 24: North America MEA Centrifugal Pumps Industry Volume (K Unit), by Flow Type 2024 & 2032
- Figure 25: North America MEA Centrifugal Pumps Industry Revenue Share (%), by Flow Type 2024 & 2032
- Figure 26: North America MEA Centrifugal Pumps Industry Volume Share (%), by Flow Type 2024 & 2032
- Figure 27: North America MEA Centrifugal Pumps Industry Revenue (Million), by Number of Stages 2024 & 2032
- Figure 28: North America MEA Centrifugal Pumps Industry Volume (K Unit), by Number of Stages 2024 & 2032
- Figure 29: North America MEA Centrifugal Pumps Industry Revenue Share (%), by Number of Stages 2024 & 2032
- Figure 30: North America MEA Centrifugal Pumps Industry Volume Share (%), by Number of Stages 2024 & 2032
- Figure 31: North America MEA Centrifugal Pumps Industry Revenue (Million), by End-User Industry 2024 & 2032
- Figure 32: North America MEA Centrifugal Pumps Industry Volume (K Unit), by End-User Industry 2024 & 2032
- Figure 33: North America MEA Centrifugal Pumps Industry Revenue Share (%), by End-User Industry 2024 & 2032
- Figure 34: North America MEA Centrifugal Pumps Industry Volume Share (%), by End-User Industry 2024 & 2032
- Figure 35: North America MEA Centrifugal Pumps Industry Revenue (Million), by Country 2024 & 2032
- Figure 36: North America MEA Centrifugal Pumps Industry Volume (K Unit), by Country 2024 & 2032
- Figure 37: North America MEA Centrifugal Pumps Industry Revenue Share (%), by Country 2024 & 2032
- Figure 38: North America MEA Centrifugal Pumps Industry Volume Share (%), by Country 2024 & 2032
- Figure 39: South America MEA Centrifugal Pumps Industry Revenue (Million), by Flow Type 2024 & 2032
- Figure 40: South America MEA Centrifugal Pumps Industry Volume (K Unit), by Flow Type 2024 & 2032
- Figure 41: South America MEA Centrifugal Pumps Industry Revenue Share (%), by Flow Type 2024 & 2032
- Figure 42: South America MEA Centrifugal Pumps Industry Volume Share (%), by Flow Type 2024 & 2032
- Figure 43: South America MEA Centrifugal Pumps Industry Revenue (Million), by Number of Stages 2024 & 2032
- Figure 44: South America MEA Centrifugal Pumps Industry Volume (K Unit), by Number of Stages 2024 & 2032
- Figure 45: South America MEA Centrifugal Pumps Industry Revenue Share (%), by Number of Stages 2024 & 2032
- Figure 46: South America MEA Centrifugal Pumps Industry Volume Share (%), by Number of Stages 2024 & 2032
- Figure 47: South America MEA Centrifugal Pumps Industry Revenue (Million), by End-User Industry 2024 & 2032
- Figure 48: South America MEA Centrifugal Pumps Industry Volume (K Unit), by End-User Industry 2024 & 2032
- Figure 49: South America MEA Centrifugal Pumps Industry Revenue Share (%), by End-User Industry 2024 & 2032
- Figure 50: South America MEA Centrifugal Pumps Industry Volume Share (%), by End-User Industry 2024 & 2032
- Figure 51: South America MEA Centrifugal Pumps Industry Revenue (Million), by Country 2024 & 2032
- Figure 52: South America MEA Centrifugal Pumps Industry Volume (K Unit), by Country 2024 & 2032
- Figure 53: South America MEA Centrifugal Pumps Industry Revenue Share (%), by Country 2024 & 2032
- Figure 54: South America MEA Centrifugal Pumps Industry Volume Share (%), by Country 2024 & 2032
- Figure 55: Europe MEA Centrifugal Pumps Industry Revenue (Million), by Flow Type 2024 & 2032
- Figure 56: Europe MEA Centrifugal Pumps Industry Volume (K Unit), by Flow Type 2024 & 2032
- Figure 57: Europe MEA Centrifugal Pumps Industry Revenue Share (%), by Flow Type 2024 & 2032
- Figure 58: Europe MEA Centrifugal Pumps Industry Volume Share (%), by Flow Type 2024 & 2032
- Figure 59: Europe MEA Centrifugal Pumps Industry Revenue (Million), by Number of Stages 2024 & 2032
- Figure 60: Europe MEA Centrifugal Pumps Industry Volume (K Unit), by Number of Stages 2024 & 2032
- Figure 61: Europe MEA Centrifugal Pumps Industry Revenue Share (%), by Number of Stages 2024 & 2032
- Figure 62: Europe MEA Centrifugal Pumps Industry Volume Share (%), by Number of Stages 2024 & 2032
- Figure 63: Europe MEA Centrifugal Pumps Industry Revenue (Million), by End-User Industry 2024 & 2032
- Figure 64: Europe MEA Centrifugal Pumps Industry Volume (K Unit), by End-User Industry 2024 & 2032
- Figure 65: Europe MEA Centrifugal Pumps Industry Revenue Share (%), by End-User Industry 2024 & 2032
- Figure 66: Europe MEA Centrifugal Pumps Industry Volume Share (%), by End-User Industry 2024 & 2032
- Figure 67: Europe MEA Centrifugal Pumps Industry Revenue (Million), by Country 2024 & 2032
- Figure 68: Europe MEA Centrifugal Pumps Industry Volume (K Unit), by Country 2024 & 2032
- Figure 69: Europe MEA Centrifugal Pumps Industry Revenue Share (%), by Country 2024 & 2032
- Figure 70: Europe MEA Centrifugal Pumps Industry Volume Share (%), by Country 2024 & 2032
- Figure 71: Middle East & Africa MEA Centrifugal Pumps Industry Revenue (Million), by Flow Type 2024 & 2032
- Figure 72: Middle East & Africa MEA Centrifugal Pumps Industry Volume (K Unit), by Flow Type 2024 & 2032
- Figure 73: Middle East & Africa MEA Centrifugal Pumps Industry Revenue Share (%), by Flow Type 2024 & 2032
- Figure 74: Middle East & Africa MEA Centrifugal Pumps Industry Volume Share (%), by Flow Type 2024 & 2032
- Figure 75: Middle East & Africa MEA Centrifugal Pumps Industry Revenue (Million), by Number of Stages 2024 & 2032
- Figure 76: Middle East & Africa MEA Centrifugal Pumps Industry Volume (K Unit), by Number of Stages 2024 & 2032
- Figure 77: Middle East & Africa MEA Centrifugal Pumps Industry Revenue Share (%), by Number of Stages 2024 & 2032
- Figure 78: Middle East & Africa MEA Centrifugal Pumps Industry Volume Share (%), by Number of Stages 2024 & 2032
- Figure 79: Middle East & Africa MEA Centrifugal Pumps Industry Revenue (Million), by End-User Industry 2024 & 2032
- Figure 80: Middle East & Africa MEA Centrifugal Pumps Industry Volume (K Unit), by End-User Industry 2024 & 2032
- Figure 81: Middle East & Africa MEA Centrifugal Pumps Industry Revenue Share (%), by End-User Industry 2024 & 2032
- Figure 82: Middle East & Africa MEA Centrifugal Pumps Industry Volume Share (%), by End-User Industry 2024 & 2032
- Figure 83: Middle East & Africa MEA Centrifugal Pumps Industry Revenue (Million), by Country 2024 & 2032
- Figure 84: Middle East & Africa MEA Centrifugal Pumps Industry Volume (K Unit), by Country 2024 & 2032
- Figure 85: Middle East & Africa MEA Centrifugal Pumps Industry Revenue Share (%), by Country 2024 & 2032
- Figure 86: Middle East & Africa MEA Centrifugal Pumps Industry Volume Share (%), by Country 2024 & 2032
- Figure 87: Asia Pacific MEA Centrifugal Pumps Industry Revenue (Million), by Flow Type 2024 & 2032
- Figure 88: Asia Pacific MEA Centrifugal Pumps Industry Volume (K Unit), by Flow Type 2024 & 2032
- Figure 89: Asia Pacific MEA Centrifugal Pumps Industry Revenue Share (%), by Flow Type 2024 & 2032
- Figure 90: Asia Pacific MEA Centrifugal Pumps Industry Volume Share (%), by Flow Type 2024 & 2032
- Figure 91: Asia Pacific MEA Centrifugal Pumps Industry Revenue (Million), by Number of Stages 2024 & 2032
- Figure 92: Asia Pacific MEA Centrifugal Pumps Industry Volume (K Unit), by Number of Stages 2024 & 2032
- Figure 93: Asia Pacific MEA Centrifugal Pumps Industry Revenue Share (%), by Number of Stages 2024 & 2032
- Figure 94: Asia Pacific MEA Centrifugal Pumps Industry Volume Share (%), by Number of Stages 2024 & 2032
- Figure 95: Asia Pacific MEA Centrifugal Pumps Industry Revenue (Million), by End-User Industry 2024 & 2032
- Figure 96: Asia Pacific MEA Centrifugal Pumps Industry Volume (K Unit), by End-User Industry 2024 & 2032
- Figure 97: Asia Pacific MEA Centrifugal Pumps Industry Revenue Share (%), by End-User Industry 2024 & 2032
- Figure 98: Asia Pacific MEA Centrifugal Pumps Industry Volume Share (%), by End-User Industry 2024 & 2032
- Figure 99: Asia Pacific MEA Centrifugal Pumps Industry Revenue (Million), by Country 2024 & 2032
- Figure 100: Asia Pacific MEA Centrifugal Pumps Industry Volume (K Unit), by Country 2024 & 2032
- Figure 101: Asia Pacific MEA Centrifugal Pumps Industry Revenue Share (%), by Country 2024 & 2032
- Figure 102: Asia Pacific MEA Centrifugal Pumps Industry Volume Share (%), by Country 2024 & 2032
List of Tables
- Table 1: Global MEA Centrifugal Pumps Industry Revenue Million Forecast, by Region 2019 & 2032
- Table 2: Global MEA Centrifugal Pumps Industry Volume K Unit Forecast, by Region 2019 & 2032
- Table 3: Global MEA Centrifugal Pumps Industry Revenue Million Forecast, by Flow Type 2019 & 2032
- Table 4: Global MEA Centrifugal Pumps Industry Volume K Unit Forecast, by Flow Type 2019 & 2032
- Table 5: Global MEA Centrifugal Pumps Industry Revenue Million Forecast, by Number of Stages 2019 & 2032
- Table 6: Global MEA Centrifugal Pumps Industry Volume K Unit Forecast, by Number of Stages 2019 & 2032
- Table 7: Global MEA Centrifugal Pumps Industry Revenue Million Forecast, by End-User Industry 2019 & 2032
- Table 8: Global MEA Centrifugal Pumps Industry Volume K Unit Forecast, by End-User Industry 2019 & 2032
- Table 9: Global MEA Centrifugal Pumps Industry Revenue Million Forecast, by Region 2019 & 2032
- Table 10: Global MEA Centrifugal Pumps Industry Volume K Unit Forecast, by Region 2019 & 2032
- Table 11: Global MEA Centrifugal Pumps Industry Revenue Million Forecast, by Country 2019 & 2032
- Table 12: Global MEA Centrifugal Pumps Industry Volume K Unit Forecast, by Country 2019 & 2032
- Table 13: MEA Centrifugal Pumps Industry Revenue (Million) Forecast, by Application 2019 & 2032
- Table 14: MEA Centrifugal Pumps Industry Volume (K Unit) Forecast, by Application 2019 & 2032
- Table 15: Global MEA Centrifugal Pumps Industry Revenue Million Forecast, by Country 2019 & 2032
- Table 16: Global MEA Centrifugal Pumps Industry Volume K Unit Forecast, by Country 2019 & 2032
- Table 17: MEA Centrifugal Pumps Industry Revenue (Million) Forecast, by Application 2019 & 2032
- Table 18: MEA Centrifugal Pumps Industry Volume (K Unit) Forecast, by Application 2019 & 2032
- Table 19: Global MEA Centrifugal Pumps Industry Revenue Million Forecast, by Country 2019 & 2032
- Table 20: Global MEA Centrifugal Pumps Industry Volume K Unit Forecast, by Country 2019 & 2032
- Table 21: MEA Centrifugal Pumps Industry Revenue (Million) Forecast, by Application 2019 & 2032
- Table 22: MEA Centrifugal Pumps Industry Volume (K Unit) Forecast, by Application 2019 & 2032
- Table 23: Global MEA Centrifugal Pumps Industry Revenue Million Forecast, by Country 2019 & 2032
- Table 24: Global MEA Centrifugal Pumps Industry Volume K Unit Forecast, by Country 2019 & 2032
- Table 25: MEA Centrifugal Pumps Industry Revenue (Million) Forecast, by Application 2019 & 2032
- Table 26: MEA Centrifugal Pumps Industry Volume (K Unit) Forecast, by Application 2019 & 2032
- Table 27: Global MEA Centrifugal Pumps Industry Revenue Million Forecast, by Country 2019 & 2032
- Table 28: Global MEA Centrifugal Pumps Industry Volume K Unit Forecast, by Country 2019 & 2032
- Table 29: MEA Centrifugal Pumps Industry Revenue (Million) Forecast, by Application 2019 & 2032
- Table 30: MEA Centrifugal Pumps Industry Volume (K Unit) Forecast, by Application 2019 & 2032
- Table 31: Global MEA Centrifugal Pumps Industry Revenue Million Forecast, by Flow Type 2019 & 2032
- Table 32: Global MEA Centrifugal Pumps Industry Volume K Unit Forecast, by Flow Type 2019 & 2032
- Table 33: Global MEA Centrifugal Pumps Industry Revenue Million Forecast, by Number of Stages 2019 & 2032
- Table 34: Global MEA Centrifugal Pumps Industry Volume K Unit Forecast, by Number of Stages 2019 & 2032
- Table 35: Global MEA Centrifugal Pumps Industry Revenue Million Forecast, by End-User Industry 2019 & 2032
- Table 36: Global MEA Centrifugal Pumps Industry Volume K Unit Forecast, by End-User Industry 2019 & 2032
- Table 37: Global MEA Centrifugal Pumps Industry Revenue Million Forecast, by Country 2019 & 2032
- Table 38: Global MEA Centrifugal Pumps Industry Volume K Unit Forecast, by Country 2019 & 2032
- Table 39: United States MEA Centrifugal Pumps Industry Revenue (Million) Forecast, by Application 2019 & 2032
- Table 40: United States MEA Centrifugal Pumps Industry Volume (K Unit) Forecast, by Application 2019 & 2032
- Table 41: Canada MEA Centrifugal Pumps Industry Revenue (Million) Forecast, by Application 2019 & 2032
- Table 42: Canada MEA Centrifugal Pumps Industry Volume (K Unit) Forecast, by Application 2019 & 2032
- Table 43: Mexico MEA Centrifugal Pumps Industry Revenue (Million) Forecast, by Application 2019 & 2032
- Table 44: Mexico MEA Centrifugal Pumps Industry Volume (K Unit) Forecast, by Application 2019 & 2032
- Table 45: Global MEA Centrifugal Pumps Industry Revenue Million Forecast, by Flow Type 2019 & 2032
- Table 46: Global MEA Centrifugal Pumps Industry Volume K Unit Forecast, by Flow Type 2019 & 2032
- Table 47: Global MEA Centrifugal Pumps Industry Revenue Million Forecast, by Number of Stages 2019 & 2032
- Table 48: Global MEA Centrifugal Pumps Industry Volume K Unit Forecast, by Number of Stages 2019 & 2032
- Table 49: Global MEA Centrifugal Pumps Industry Revenue Million Forecast, by End-User Industry 2019 & 2032
- Table 50: Global MEA Centrifugal Pumps Industry Volume K Unit Forecast, by End-User Industry 2019 & 2032
- Table 51: Global MEA Centrifugal Pumps Industry Revenue Million Forecast, by Country 2019 & 2032
- Table 52: Global MEA Centrifugal Pumps Industry Volume K Unit Forecast, by Country 2019 & 2032
- Table 53: Brazil MEA Centrifugal Pumps Industry Revenue (Million) Forecast, by Application 2019 & 2032
- Table 54: Brazil MEA Centrifugal Pumps Industry Volume (K Unit) Forecast, by Application 2019 & 2032
- Table 55: Argentina MEA Centrifugal Pumps Industry Revenue (Million) Forecast, by Application 2019 & 2032
- Table 56: Argentina MEA Centrifugal Pumps Industry Volume (K Unit) Forecast, by Application 2019 & 2032
- Table 57: Rest of South America MEA Centrifugal Pumps Industry Revenue (Million) Forecast, by Application 2019 & 2032
- Table 58: Rest of South America MEA Centrifugal Pumps Industry Volume (K Unit) Forecast, by Application 2019 & 2032
- Table 59: Global MEA Centrifugal Pumps Industry Revenue Million Forecast, by Flow Type 2019 & 2032
- Table 60: Global MEA Centrifugal Pumps Industry Volume K Unit Forecast, by Flow Type 2019 & 2032
- Table 61: Global MEA Centrifugal Pumps Industry Revenue Million Forecast, by Number of Stages 2019 & 2032
- Table 62: Global MEA Centrifugal Pumps Industry Volume K Unit Forecast, by Number of Stages 2019 & 2032
- Table 63: Global MEA Centrifugal Pumps Industry Revenue Million Forecast, by End-User Industry 2019 & 2032
- Table 64: Global MEA Centrifugal Pumps Industry Volume K Unit Forecast, by End-User Industry 2019 & 2032
- Table 65: Global MEA Centrifugal Pumps Industry Revenue Million Forecast, by Country 2019 & 2032
- Table 66: Global MEA Centrifugal Pumps Industry Volume K Unit Forecast, by Country 2019 & 2032
- Table 67: United Kingdom MEA Centrifugal Pumps Industry Revenue (Million) Forecast, by Application 2019 & 2032
- Table 68: United Kingdom MEA Centrifugal Pumps Industry Volume (K Unit) Forecast, by Application 2019 & 2032
- Table 69: Germany MEA Centrifugal Pumps Industry Revenue (Million) Forecast, by Application 2019 & 2032
- Table 70: Germany MEA Centrifugal Pumps Industry Volume (K Unit) Forecast, by Application 2019 & 2032
- Table 71: France MEA Centrifugal Pumps Industry Revenue (Million) Forecast, by Application 2019 & 2032
- Table 72: France MEA Centrifugal Pumps Industry Volume (K Unit) Forecast, by Application 2019 & 2032
- Table 73: Italy MEA Centrifugal Pumps Industry Revenue (Million) Forecast, by Application 2019 & 2032
- Table 74: Italy MEA Centrifugal Pumps Industry Volume (K Unit) Forecast, by Application 2019 & 2032
- Table 75: Spain MEA Centrifugal Pumps Industry Revenue (Million) Forecast, by Application 2019 & 2032
- Table 76: Spain MEA Centrifugal Pumps Industry Volume (K Unit) Forecast, by Application 2019 & 2032
- Table 77: Russia MEA Centrifugal Pumps Industry Revenue (Million) Forecast, by Application 2019 & 2032
- Table 78: Russia MEA Centrifugal Pumps Industry Volume (K Unit) Forecast, by Application 2019 & 2032
- Table 79: Benelux MEA Centrifugal Pumps Industry Revenue (Million) Forecast, by Application 2019 & 2032
- Table 80: Benelux MEA Centrifugal Pumps Industry Volume (K Unit) Forecast, by Application 2019 & 2032
- Table 81: Nordics MEA Centrifugal Pumps Industry Revenue (Million) Forecast, by Application 2019 & 2032
- Table 82: Nordics MEA Centrifugal Pumps Industry Volume (K Unit) Forecast, by Application 2019 & 2032
- Table 83: Rest of Europe MEA Centrifugal Pumps Industry Revenue (Million) Forecast, by Application 2019 & 2032
- Table 84: Rest of Europe MEA Centrifugal Pumps Industry Volume (K Unit) Forecast, by Application 2019 & 2032
- Table 85: Global MEA Centrifugal Pumps Industry Revenue Million Forecast, by Flow Type 2019 & 2032
- Table 86: Global MEA Centrifugal Pumps Industry Volume K Unit Forecast, by Flow Type 2019 & 2032
- Table 87: Global MEA Centrifugal Pumps Industry Revenue Million Forecast, by Number of Stages 2019 & 2032
- Table 88: Global MEA Centrifugal Pumps Industry Volume K Unit Forecast, by Number of Stages 2019 & 2032
- Table 89: Global MEA Centrifugal Pumps Industry Revenue Million Forecast, by End-User Industry 2019 & 2032
- Table 90: Global MEA Centrifugal Pumps Industry Volume K Unit Forecast, by End-User Industry 2019 & 2032
- Table 91: Global MEA Centrifugal Pumps Industry Revenue Million Forecast, by Country 2019 & 2032
- Table 92: Global MEA Centrifugal Pumps Industry Volume K Unit Forecast, by Country 2019 & 2032
- Table 93: Turkey MEA Centrifugal Pumps Industry Revenue (Million) Forecast, by Application 2019 & 2032
- Table 94: Turkey MEA Centrifugal Pumps Industry Volume (K Unit) Forecast, by Application 2019 & 2032
- Table 95: Israel MEA Centrifugal Pumps Industry Revenue (Million) Forecast, by Application 2019 & 2032
- Table 96: Israel MEA Centrifugal Pumps Industry Volume (K Unit) Forecast, by Application 2019 & 2032
- Table 97: GCC MEA Centrifugal Pumps Industry Revenue (Million) Forecast, by Application 2019 & 2032
- Table 98: GCC MEA Centrifugal Pumps Industry Volume (K Unit) Forecast, by Application 2019 & 2032
- Table 99: North Africa MEA Centrifugal Pumps Industry Revenue (Million) Forecast, by Application 2019 & 2032
- Table 100: North Africa MEA Centrifugal Pumps Industry Volume (K Unit) Forecast, by Application 2019 & 2032
- Table 101: South Africa MEA Centrifugal Pumps Industry Revenue (Million) Forecast, by Application 2019 & 2032
- Table 102: South Africa MEA Centrifugal Pumps Industry Volume (K Unit) Forecast, by Application 2019 & 2032
- Table 103: Rest of Middle East & Africa MEA Centrifugal Pumps Industry Revenue (Million) Forecast, by Application 2019 & 2032
- Table 104: Rest of Middle East & Africa MEA Centrifugal Pumps Industry Volume (K Unit) Forecast, by Application 2019 & 2032
- Table 105: Global MEA Centrifugal Pumps Industry Revenue Million Forecast, by Flow Type 2019 & 2032
- Table 106: Global MEA Centrifugal Pumps Industry Volume K Unit Forecast, by Flow Type 2019 & 2032
- Table 107: Global MEA Centrifugal Pumps Industry Revenue Million Forecast, by Number of Stages 2019 & 2032
- Table 108: Global MEA Centrifugal Pumps Industry Volume K Unit Forecast, by Number of Stages 2019 & 2032
- Table 109: Global MEA Centrifugal Pumps Industry Revenue Million Forecast, by End-User Industry 2019 & 2032
- Table 110: Global MEA Centrifugal Pumps Industry Volume K Unit Forecast, by End-User Industry 2019 & 2032
- Table 111: Global MEA Centrifugal Pumps Industry Revenue Million Forecast, by Country 2019 & 2032
- Table 112: Global MEA Centrifugal Pumps Industry Volume K Unit Forecast, by Country 2019 & 2032
- Table 113: China MEA Centrifugal Pumps Industry Revenue (Million) Forecast, by Application 2019 & 2032
- Table 114: China MEA Centrifugal Pumps Industry Volume (K Unit) Forecast, by Application 2019 & 2032
- Table 115: India MEA Centrifugal Pumps Industry Revenue (Million) Forecast, by Application 2019 & 2032
- Table 116: India MEA Centrifugal Pumps Industry Volume (K Unit) Forecast, by Application 2019 & 2032
- Table 117: Japan MEA Centrifugal Pumps Industry Revenue (Million) Forecast, by Application 2019 & 2032
- Table 118: Japan MEA Centrifugal Pumps Industry Volume (K Unit) Forecast, by Application 2019 & 2032
- Table 119: South Korea MEA Centrifugal Pumps Industry Revenue (Million) Forecast, by Application 2019 & 2032
- Table 120: South Korea MEA Centrifugal Pumps Industry Volume (K Unit) Forecast, by Application 2019 & 2032
- Table 121: ASEAN MEA Centrifugal Pumps Industry Revenue (Million) Forecast, by Application 2019 & 2032
- Table 122: ASEAN MEA Centrifugal Pumps Industry Volume (K Unit) Forecast, by Application 2019 & 2032
- Table 123: Oceania MEA Centrifugal Pumps Industry Revenue (Million) Forecast, by Application 2019 & 2032
- Table 124: Oceania MEA Centrifugal Pumps Industry Volume (K Unit) Forecast, by Application 2019 & 2032
- Table 125: Rest of Asia Pacific MEA Centrifugal Pumps Industry Revenue (Million) Forecast, by Application 2019 & 2032
- Table 126: Rest of Asia Pacific MEA Centrifugal Pumps Industry Volume (K Unit) Forecast, by Application 2019 & 2032
Frequently Asked Questions
1. What is the projected Compound Annual Growth Rate (CAGR) of the MEA Centrifugal Pumps Industry?
The projected CAGR is approximately 4.60%.
2. Which companies are prominent players in the MEA Centrifugal Pumps Industry?
Key companies in the market include Ebara Pumps Middle East FZE, KSB Middle East FZE, Flowserve Corporation, The Weir Group PLC, Ruhrpumpen Group, Dover Corporation, Baker Hughes Company, Xylem Inc , Schlumberger Limited, Parker Hannifin Corp.
3. What are the main segments of the MEA Centrifugal Pumps Industry?
The market segments include Flow Type, Number of Stages, End-User Industry.
4. Can you provide details about the market size?
The market size is estimated to be USD XX Million as of 2022.
5. What are some drivers contributing to market growth?
Rapid Industrialization & Urbanization; Increasing Investments in Urban Waste-Water Sector.
6. What are the notable trends driving market growth?
Water and Wastewater Management to Drive the Demand for Centrifugal Pumps.
7. Are there any restraints impacting market growth?
High Acquisition and Maintenace Cost of Industrial CT systems.
8. Can you provide examples of recent developments in the market?
June 2021 - Amarinth, a global manufacturer of low lifecycle cost centrifugal pumps and associated equipment for various industries, announced that it had secured an order with its agent NAMA for 14 API 610 VS4 vertical pumps from ISCCO for the ADNOC Ruwais Refinery East, UAE.
9. What pricing options are available for accessing the report?
Pricing options include single-user, multi-user, and enterprise licenses priced at USD 4750, USD 4950, and USD 6800 respectively.
10. Is the market size provided in terms of value or volume?
The market size is provided in terms of value, measured in Million and volume, measured in K Unit.
11. Are there any specific market keywords associated with the report?
Yes, the market keyword associated with the report is "MEA Centrifugal Pumps Industry," which aids in identifying and referencing the specific market segment covered.
12. How do I determine which pricing option suits my needs best?
The pricing options vary based on user requirements and access needs. Individual users may opt for single-user licenses, while businesses requiring broader access may choose multi-user or enterprise licenses for cost-effective access to the report.
13. Are there any additional resources or data provided in the MEA Centrifugal Pumps Industry report?
While the report offers comprehensive insights, it's advisable to review the specific contents or supplementary materials provided to ascertain if additional resources or data are available.
14. How can I stay updated on further developments or reports in the MEA Centrifugal Pumps Industry?
To stay informed about further developments, trends, and reports in the MEA Centrifugal Pumps Industry, consider subscribing to industry newsletters, following relevant companies and organizations, or regularly checking reputable industry news sources and publications.
Methodology
Step 1 - Identification of Relevant Samples Size from Population Database


Step 2 - Approaches for Defining Global Market Size (Value, Volume* & Price*)

Note*: In applicable scenarios
Step 3 - Data Sources
Primary Research
- Web Analytics
- Survey Reports
- Research Institute
- Latest Research Reports
- Opinion Leaders
Secondary Research
- Annual Reports
- White Paper
- Latest Press Release
- Industry Association
- Paid Database
- Investor Presentations

Step 4 - Data Triangulation
Involves using different sources of information in order to increase the validity of a study
These sources are likely to be stakeholders in a program - participants, other researchers, program staff, other community members, and so on.
Then we put all data in single framework & apply various statistical tools to find out the dynamic on the market.
During the analysis stage, feedback from the stakeholder groups would be compared to determine areas of agreement as well as areas of divergence


