
Key Insights
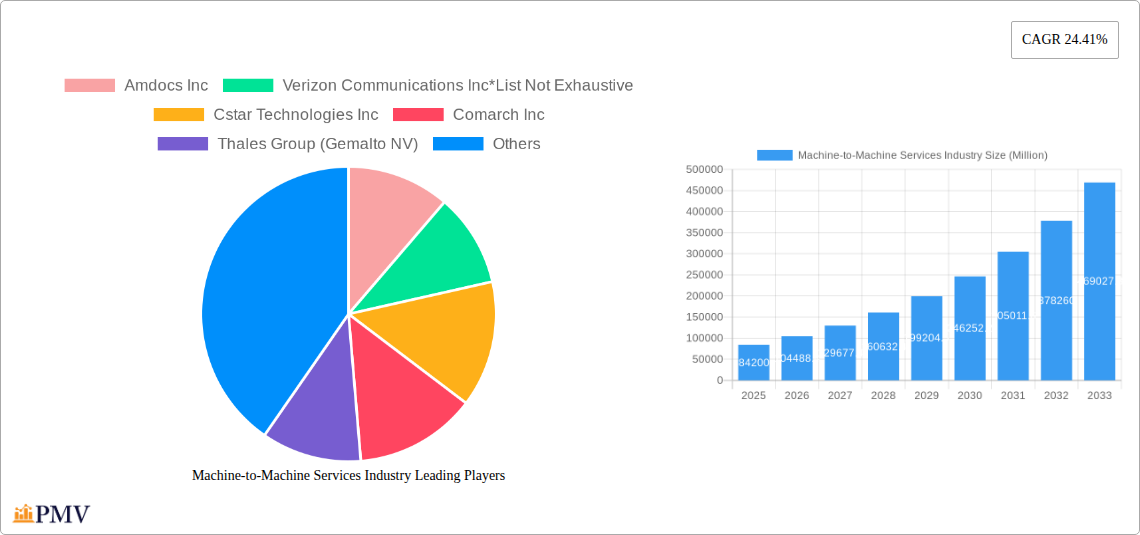
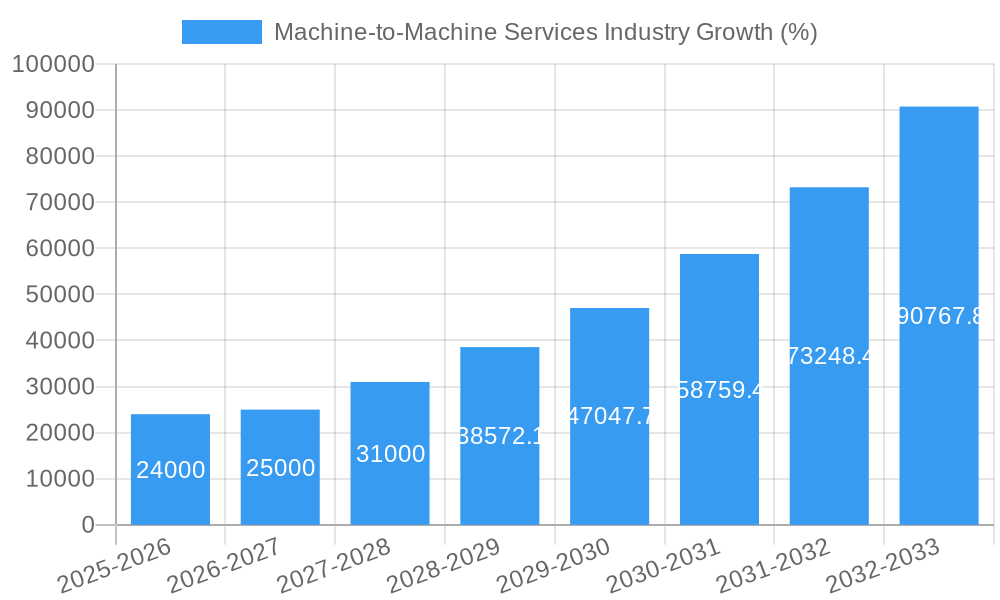
The Machine-to-Machine (M2M) services market is experiencing robust growth, projected to reach a market size of $84.20 billion in 2025 and exhibiting a Compound Annual Growth Rate (CAGR) of 24.41% from 2019 to 2033. This expansion is fueled by several key drivers. The increasing adoption of IoT devices across diverse sectors, including retail, banking, and healthcare, is a primary catalyst. The demand for efficient remote monitoring and management of assets is driving the uptake of managed services, while the need for customized solutions is boosting the professional services segment. Furthermore, advancements in 5G and other communication technologies are enabling faster data transfer speeds and lower latency, significantly improving M2M communication capabilities and opening new application possibilities. The market's growth trajectory is influenced by trends such as increasing data security concerns, leading to heightened investments in robust security solutions, and the rise of cloud-based M2M platforms that offer scalability and cost-effectiveness.
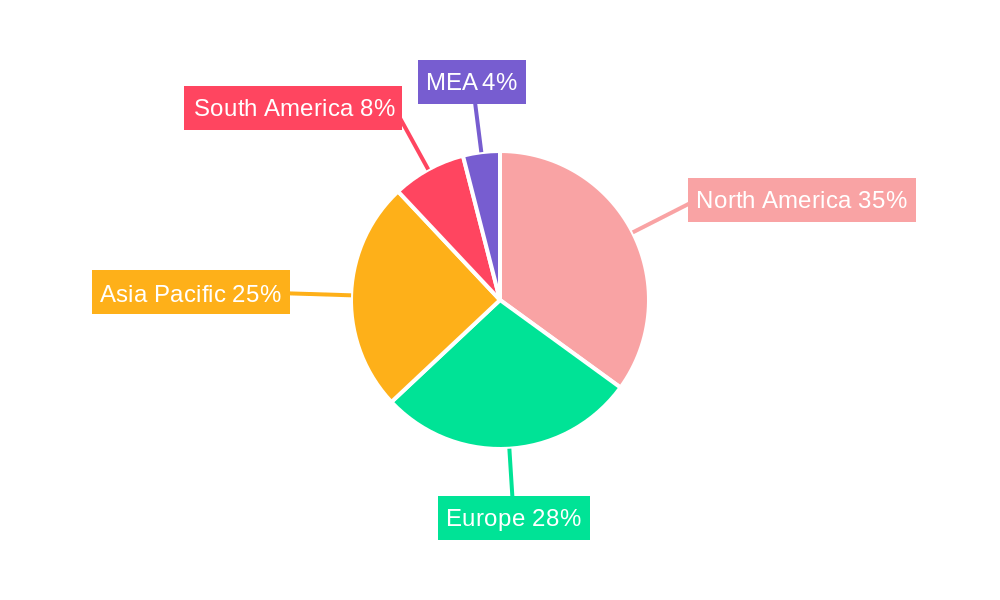
However, the market also faces some restraints. The high initial investment costs associated with implementing M2M solutions can be a barrier to entry for smaller businesses. Furthermore, interoperability challenges between different devices and platforms can hinder seamless integration and data exchange. Nevertheless, the substantial benefits offered by M2M solutions in terms of improved efficiency, reduced operational costs, and enhanced decision-making capabilities are likely to outweigh these challenges, sustaining the market's strong growth momentum throughout the forecast period. The geographical distribution reveals a significant presence in North America and Europe, with the Asia-Pacific region poised for rapid expansion driven by increasing technological adoption and economic growth in developing economies. Key players, such as Amdocs, Verizon, and Cisco, are strategically investing in research and development to innovate and maintain a competitive edge in this rapidly evolving market landscape.
Machine-to-Machine (M2M) Services Industry Report: 2019-2033
This comprehensive report provides a detailed analysis of the global Machine-to-Machine (M2M) Services market, covering the period 2019-2033. With a focus on key industry trends, competitive dynamics, and future growth prospects, this report is an invaluable resource for businesses, investors, and researchers seeking to understand and navigate this rapidly evolving sector. The report projects a market size of xx Million by 2033, with a CAGR of xx% during the forecast period (2025-2033). The base year for this analysis is 2025.
Machine-to-Machine Services Industry Market Structure & Competitive Dynamics
The M2M services market exhibits a moderately consolidated structure, with several large players holding significant market share. However, a vibrant ecosystem of smaller, specialized firms also contributes to innovation and competition. The market is characterized by ongoing mergers and acquisitions (M&A) activity, reflecting the consolidation trend and the pursuit of strategic advantages. Deal values in recent years have averaged xx Million per transaction, although this fluctuates based on the size and scope of the acquired assets.
Key factors influencing market structure include:
- High barriers to entry: Significant capital investment and expertise are required to establish a successful M2M services provider.
- Technological advancements: Continuous innovation in areas like 5G, IoT, and AI shapes the competitive landscape.
- Regulatory frameworks: Government policies and regulations related to data security and privacy influence market dynamics.
- Product differentiation: Companies differentiate through specialized service offerings, vertical market expertise, and proprietary technologies.
- End-user trends: The growing adoption of M2M solutions across various sectors fuels market growth and shapes competitive strategies. For example, the increasing demand for connected vehicles in the automotive industry significantly impacts the M2M landscape.
Examples of significant M&A activities include [Insert specific M&A examples with deal values if available, otherwise use "Several significant M&A transactions have reshaped the market landscape in recent years, driving consolidation among key players."]. Major players such as Amdocs Inc, Verizon Communications Inc, and Cisco System Inc. hold substantial market shares, ranging from xx% to xx%, while other players compete for niche market segments.
Machine-to-Machine Services Industry Industry Trends & Insights
The global M2M services market is experiencing robust growth, driven by several key factors. The increasing adoption of Internet of Things (IoT) devices, the proliferation of smart devices and applications, and the growing demand for automation and remote monitoring across various industries are all contributing to this expansion. The market is also witnessing significant technological disruptions, with advancements in 5G technology, artificial intelligence (AI), and machine learning (ML) enhancing the capabilities and applications of M2M services.
Consumer preferences are shifting towards more seamless, integrated, and secure solutions. Businesses are prioritizing cost-effectiveness, scalability, and reliability in their M2M deployments. This is leading to a greater emphasis on cloud-based M2M platforms and managed services. The projected compound annual growth rate (CAGR) of the global M2M services market during the forecast period is estimated to be xx%, indicating a robust trajectory. Market penetration is increasing steadily, driven by a higher adoption rate in developed economies and emerging markets alike. The Telecom and IT industry currently accounts for a substantial portion of the M2M services market, but growth is also witnessed in the automotive, healthcare, and manufacturing sectors. This growth is further accelerated by the increasing adoption of connected devices, advanced analytics, and cloud services in these sectors. The competitive dynamics are marked by strategic alliances, technological innovation, and aggressive pricing strategies.
Dominant Markets & Segments in Machine-to-Machine Services Industry
The North American region currently holds the dominant position in the global M2M services market, primarily due to its robust technological infrastructure, high adoption of IoT devices, and strong presence of key market players. The Asia-Pacific region is expected to witness substantial growth in the coming years, driven by rising smartphone penetration, increasing investments in digital infrastructure, and expansion of smart city initiatives.
By Type:
- Managed Services: This segment is experiencing rapid growth due to the increasing demand for outsourced M2M management solutions. Key drivers include reduced operational costs, enhanced service reliability, and improved scalability.
- Professional Services: This segment focuses on consulting, integration, and deployment services, experiencing steady growth fueled by the need for expert support in complex M2M implementations.
By End User:
- Telecom and IT Industry: This segment remains a dominant driver, with a significant share of the market, fueled by investments in network infrastructure and technological advancements like 5G.
- Automotive: The rapid expansion of connected vehicles and autonomous driving technologies is driving substantial growth in this sector. Key drivers include advancements in vehicle-to-everything (V2X) communication and improved safety features.
- Banking and Financial Institutions: The need for secure and reliable transaction processing, fraud detection, and risk management is driving the adoption of M2M services in this segment.
- Retail: The increase in contactless payment systems and smart retail solutions fuels M2M adoption.
- Healthcare: Remote patient monitoring, telehealth applications, and connected medical devices are spurring growth.
- Oil and Gas: Remote monitoring of oil rigs, pipelines, and other assets is driving the adoption of M2M solutions for operational efficiency and safety improvements.
- Transportation: Smart traffic management systems and optimized logistics are driving M2M adoption in the transportation sector.
The dominance of these segments stems from factors such as high adoption rates, substantial investment in technology upgrades, and the critical role of M2M services in enhancing efficiency, safety, and profitability. Growth projections for each segment vary, with managed services and the automotive sector anticipated to experience the most substantial growth during the forecast period.
Machine-to-Machine Services Industry Product Innovations
Recent product developments have focused on enhancing security, scalability, and interoperability. The integration of AI and machine learning capabilities is improving predictive maintenance, optimizing network performance, and enabling advanced analytics. New embedded SIM (eSIM) technologies are simplifying device deployment and management. The market is witnessing a shift towards cloud-based platforms, providing greater flexibility and cost efficiency for users. This focus on cloud-based, AI-driven solutions aligns with the increasing demand for more intelligent and automated M2M systems.
Report Segmentation & Scope
This report segments the M2M services market by type (managed services and professional services) and end-user (retail, banking and financial institutions, telecom and IT industry, healthcare, automotive, oil and gas, and transportation). Each segment's growth projections, market size, and competitive dynamics are analyzed in detail. This provides a comprehensive view of the various facets of the market and aids in the identification of strategic opportunities. Growth projections for each segment are detailed within the complete report.
Key Drivers of Machine-to-Machine Services Industry Growth
Several factors fuel the growth of the M2M services industry. Technological advancements, particularly in 5G, IoT, AI, and cloud computing, are significantly expanding the possibilities and applications of M2M. Government initiatives promoting digital transformation and smart city projects also stimulate market growth. Furthermore, the increasing demand for enhanced operational efficiency, cost reduction, and improved safety across various industries is driving adoption. The focus on data analytics and predictive maintenance within M2M solutions further strengthens its appeal.
Challenges in the Machine-to-Machine Services Industry Sector
Despite substantial growth potential, the M2M services industry faces several challenges. Data security and privacy concerns require robust security measures, representing both a cost and technical hurdle. Interoperability issues among different devices and platforms can hinder seamless integration. The complexity of deploying and managing large-scale M2M networks presents a significant operational challenge. Furthermore, the high cost of initial investments and ongoing maintenance can limit adoption for some smaller businesses.
Leading Players in the Machine-to-Machine Services Industry Market
- Amdocs Inc
- Verizon Communications Inc
- Cstar Technologies Inc
- Comarch Inc
- Thales Group (Gemalto NV)
- Huawei Technologies Co Ltd
- Rogers Communications Inc
- Cisco System Inc
- International Business Machine Corporation
- Nokia Corp (Alcatel-Lucent S A )
- EE Ltd
- Intel Corporation
Key Developments in Machine-to-Machine Services Industry Sector
November 2023: Ericsson's launch of an intelligent, cloud-native transport controller leveraging AI and ML to optimize mobile transport network efficiency signifies a significant advancement in network management and efficiency, impacting CSPs' operational costs and performance.
February 2023: The partnership between A5G Networks, Inc. and Intel® Smart Edge simplifies edge computing deployment, making it accessible to non-technical users and broadening the application of MEC technologies across various sectors.
June 2022: STMicroelectronics' launch of the ST4SIM-201 eSIM for M2M communication enhances security and simplifies provisioning for 5G and other network technologies, driving adoption in sectors needing secure and flexible connectivity.
June 2022: The collaboration between M2M Germany and Wattsense extends M2M capabilities to building management, utilizing IoT sensor networks and SaaS models to digitize buildings and improve energy efficiency. This highlights the expanding application of M2M in new vertical markets.
Strategic Machine-to-Machine Services Industry Market Outlook
The future of the M2M services market is promising, with continued growth driven by technological advancements, increasing digitization across various industries, and a rising demand for interconnected devices and solutions. Strategic opportunities exist in expanding into new vertical markets, developing innovative solutions leveraging AI and ML, and focusing on providing secure and reliable M2M services to address the growing concerns regarding data privacy and security. The market is set to witness a continued shift towards cloud-based solutions and enhanced integration across various platforms, creating new avenues for growth and innovation.
Machine-to-Machine Services Industry Segmentation
-
1. Type
- 1.1. Managed Service
- 1.2. Professional Service
-
2. End User
- 2.1. Retail
- 2.2. Banking and Financial Institution
- 2.3. Telecom and IT Industry
- 2.4. Healthcare
- 2.5. Automotive
- 2.6. Oil and Gas
- 2.7. Transportation
Machine-to-Machine Services Industry Segmentation By Geography
- 1. North America
- 2. Europe
- 3. Asia Pacific
- 4. Latin America
- 5. Middle East
Machine-to-Machine Services Industry REPORT HIGHLIGHTS
| Aspects | Details |
|---|---|
| Study Period | 2019-2033 |
| Base Year | 2024 |
| Estimated Year | 2025 |
| Forecast Period | 2025-2033 |
| Historical Period | 2019-2024 |
| Growth Rate | CAGR of 24.41% from 2019-2033 |
| Segmentation |
|
Table of Contents
- 1. Introduction
- 1.1. Research Scope
- 1.2. Market Segmentation
- 1.3. Research Methodology
- 1.4. Definitions and Assumptions
- 2. Executive Summary
- 2.1. Introduction
- 3. Market Dynamics
- 3.1. Introduction
- 3.2. Market Drivers
- 3.2.1. Rapid Technological Advancements; Increasing Number of Connected Devices
- 3.3. Market Restrains
- 3.3.1. Lack of Standardization; Huge Delivery Cost
- 3.4. Market Trends
- 3.4.1. Telecom Industry to Witness Significant Growth Among Other End-user Verticals
- 4. Market Factor Analysis
- 4.1. Porters Five Forces
- 4.2. Supply/Value Chain
- 4.3. PESTEL analysis
- 4.4. Market Entropy
- 4.5. Patent/Trademark Analysis
- 5. Global Machine-to-Machine Services Industry Analysis, Insights and Forecast, 2019-2031
- 5.1. Market Analysis, Insights and Forecast - by Type
- 5.1.1. Managed Service
- 5.1.2. Professional Service
- 5.2. Market Analysis, Insights and Forecast - by End User
- 5.2.1. Retail
- 5.2.2. Banking and Financial Institution
- 5.2.3. Telecom and IT Industry
- 5.2.4. Healthcare
- 5.2.5. Automotive
- 5.2.6. Oil and Gas
- 5.2.7. Transportation
- 5.3. Market Analysis, Insights and Forecast - by Region
- 5.3.1. North America
- 5.3.2. Europe
- 5.3.3. Asia Pacific
- 5.3.4. Latin America
- 5.3.5. Middle East
- 5.1. Market Analysis, Insights and Forecast - by Type
- 6. North America Machine-to-Machine Services Industry Analysis, Insights and Forecast, 2019-2031
- 6.1. Market Analysis, Insights and Forecast - by Type
- 6.1.1. Managed Service
- 6.1.2. Professional Service
- 6.2. Market Analysis, Insights and Forecast - by End User
- 6.2.1. Retail
- 6.2.2. Banking and Financial Institution
- 6.2.3. Telecom and IT Industry
- 6.2.4. Healthcare
- 6.2.5. Automotive
- 6.2.6. Oil and Gas
- 6.2.7. Transportation
- 6.1. Market Analysis, Insights and Forecast - by Type
- 7. Europe Machine-to-Machine Services Industry Analysis, Insights and Forecast, 2019-2031
- 7.1. Market Analysis, Insights and Forecast - by Type
- 7.1.1. Managed Service
- 7.1.2. Professional Service
- 7.2. Market Analysis, Insights and Forecast - by End User
- 7.2.1. Retail
- 7.2.2. Banking and Financial Institution
- 7.2.3. Telecom and IT Industry
- 7.2.4. Healthcare
- 7.2.5. Automotive
- 7.2.6. Oil and Gas
- 7.2.7. Transportation
- 7.1. Market Analysis, Insights and Forecast - by Type
- 8. Asia Pacific Machine-to-Machine Services Industry Analysis, Insights and Forecast, 2019-2031
- 8.1. Market Analysis, Insights and Forecast - by Type
- 8.1.1. Managed Service
- 8.1.2. Professional Service
- 8.2. Market Analysis, Insights and Forecast - by End User
- 8.2.1. Retail
- 8.2.2. Banking and Financial Institution
- 8.2.3. Telecom and IT Industry
- 8.2.4. Healthcare
- 8.2.5. Automotive
- 8.2.6. Oil and Gas
- 8.2.7. Transportation
- 8.1. Market Analysis, Insights and Forecast - by Type
- 9. Latin America Machine-to-Machine Services Industry Analysis, Insights and Forecast, 2019-2031
- 9.1. Market Analysis, Insights and Forecast - by Type
- 9.1.1. Managed Service
- 9.1.2. Professional Service
- 9.2. Market Analysis, Insights and Forecast - by End User
- 9.2.1. Retail
- 9.2.2. Banking and Financial Institution
- 9.2.3. Telecom and IT Industry
- 9.2.4. Healthcare
- 9.2.5. Automotive
- 9.2.6. Oil and Gas
- 9.2.7. Transportation
- 9.1. Market Analysis, Insights and Forecast - by Type
- 10. Middle East Machine-to-Machine Services Industry Analysis, Insights and Forecast, 2019-2031
- 10.1. Market Analysis, Insights and Forecast - by Type
- 10.1.1. Managed Service
- 10.1.2. Professional Service
- 10.2. Market Analysis, Insights and Forecast - by End User
- 10.2.1. Retail
- 10.2.2. Banking and Financial Institution
- 10.2.3. Telecom and IT Industry
- 10.2.4. Healthcare
- 10.2.5. Automotive
- 10.2.6. Oil and Gas
- 10.2.7. Transportation
- 10.1. Market Analysis, Insights and Forecast - by Type
- 11. North America Machine-to-Machine Services Industry Analysis, Insights and Forecast, 2019-2031
- 11.1. Market Analysis, Insights and Forecast - By Country/Sub-region
- 11.1.1 United States
- 11.1.2 Canada
- 11.1.3 Mexico
- 12. Europe Machine-to-Machine Services Industry Analysis, Insights and Forecast, 2019-2031
- 12.1. Market Analysis, Insights and Forecast - By Country/Sub-region
- 12.1.1 Germany
- 12.1.2 United Kingdom
- 12.1.3 France
- 12.1.4 Spain
- 12.1.5 Italy
- 12.1.6 Spain
- 12.1.7 Belgium
- 12.1.8 Netherland
- 12.1.9 Nordics
- 12.1.10 Rest of Europe
- 13. Asia Pacific Machine-to-Machine Services Industry Analysis, Insights and Forecast, 2019-2031
- 13.1. Market Analysis, Insights and Forecast - By Country/Sub-region
- 13.1.1 China
- 13.1.2 Japan
- 13.1.3 India
- 13.1.4 South Korea
- 13.1.5 Southeast Asia
- 13.1.6 Australia
- 13.1.7 Indonesia
- 13.1.8 Phillipes
- 13.1.9 Singapore
- 13.1.10 Thailandc
- 13.1.11 Rest of Asia Pacific
- 14. South America Machine-to-Machine Services Industry Analysis, Insights and Forecast, 2019-2031
- 14.1. Market Analysis, Insights and Forecast - By Country/Sub-region
- 14.1.1 Brazil
- 14.1.2 Argentina
- 14.1.3 Peru
- 14.1.4 Chile
- 14.1.5 Colombia
- 14.1.6 Ecuador
- 14.1.7 Venezuela
- 14.1.8 Rest of South America
- 15. North America Machine-to-Machine Services Industry Analysis, Insights and Forecast, 2019-2031
- 15.1. Market Analysis, Insights and Forecast - By Country/Sub-region
- 15.1.1 United States
- 15.1.2 Canada
- 15.1.3 Mexico
- 16. MEA Machine-to-Machine Services Industry Analysis, Insights and Forecast, 2019-2031
- 16.1. Market Analysis, Insights and Forecast - By Country/Sub-region
- 16.1.1 United Arab Emirates
- 16.1.2 Saudi Arabia
- 16.1.3 South Africa
- 16.1.4 Rest of Middle East and Africa
- 17. Competitive Analysis
- 17.1. Global Market Share Analysis 2024
- 17.2. Company Profiles
- 17.2.1 Amdocs Inc
- 17.2.1.1. Overview
- 17.2.1.2. Products
- 17.2.1.3. SWOT Analysis
- 17.2.1.4. Recent Developments
- 17.2.1.5. Financials (Based on Availability)
- 17.2.2 Verizon Communications Inc*List Not Exhaustive
- 17.2.2.1. Overview
- 17.2.2.2. Products
- 17.2.2.3. SWOT Analysis
- 17.2.2.4. Recent Developments
- 17.2.2.5. Financials (Based on Availability)
- 17.2.3 Cstar Technologies Inc
- 17.2.3.1. Overview
- 17.2.3.2. Products
- 17.2.3.3. SWOT Analysis
- 17.2.3.4. Recent Developments
- 17.2.3.5. Financials (Based on Availability)
- 17.2.4 Comarch Inc
- 17.2.4.1. Overview
- 17.2.4.2. Products
- 17.2.4.3. SWOT Analysis
- 17.2.4.4. Recent Developments
- 17.2.4.5. Financials (Based on Availability)
- 17.2.5 Thales Group (Gemalto NV)
- 17.2.5.1. Overview
- 17.2.5.2. Products
- 17.2.5.3. SWOT Analysis
- 17.2.5.4. Recent Developments
- 17.2.5.5. Financials (Based on Availability)
- 17.2.6 Huawei Technologies Co Ltd
- 17.2.6.1. Overview
- 17.2.6.2. Products
- 17.2.6.3. SWOT Analysis
- 17.2.6.4. Recent Developments
- 17.2.6.5. Financials (Based on Availability)
- 17.2.7 Rogers Communications Inc
- 17.2.7.1. Overview
- 17.2.7.2. Products
- 17.2.7.3. SWOT Analysis
- 17.2.7.4. Recent Developments
- 17.2.7.5. Financials (Based on Availability)
- 17.2.8 Cisco System Inc
- 17.2.8.1. Overview
- 17.2.8.2. Products
- 17.2.8.3. SWOT Analysis
- 17.2.8.4. Recent Developments
- 17.2.8.5. Financials (Based on Availability)
- 17.2.9 International Business Machine Corporation
- 17.2.9.1. Overview
- 17.2.9.2. Products
- 17.2.9.3. SWOT Analysis
- 17.2.9.4. Recent Developments
- 17.2.9.5. Financials (Based on Availability)
- 17.2.10 Nokia Corp (Alcatel-Lucent S A )
- 17.2.10.1. Overview
- 17.2.10.2. Products
- 17.2.10.3. SWOT Analysis
- 17.2.10.4. Recent Developments
- 17.2.10.5. Financials (Based on Availability)
- 17.2.11 EE Ltd
- 17.2.11.1. Overview
- 17.2.11.2. Products
- 17.2.11.3. SWOT Analysis
- 17.2.11.4. Recent Developments
- 17.2.11.5. Financials (Based on Availability)
- 17.2.12 Intel Corporation
- 17.2.12.1. Overview
- 17.2.12.2. Products
- 17.2.12.3. SWOT Analysis
- 17.2.12.4. Recent Developments
- 17.2.12.5. Financials (Based on Availability)
- 17.2.1 Amdocs Inc
List of Figures
- Figure 1: Global Machine-to-Machine Services Industry Revenue Breakdown (Million, %) by Region 2024 & 2032
- Figure 2: North America Machine-to-Machine Services Industry Revenue (Million), by Country 2024 & 2032
- Figure 3: North America Machine-to-Machine Services Industry Revenue Share (%), by Country 2024 & 2032
- Figure 4: Europe Machine-to-Machine Services Industry Revenue (Million), by Country 2024 & 2032
- Figure 5: Europe Machine-to-Machine Services Industry Revenue Share (%), by Country 2024 & 2032
- Figure 6: Asia Pacific Machine-to-Machine Services Industry Revenue (Million), by Country 2024 & 2032
- Figure 7: Asia Pacific Machine-to-Machine Services Industry Revenue Share (%), by Country 2024 & 2032
- Figure 8: South America Machine-to-Machine Services Industry Revenue (Million), by Country 2024 & 2032
- Figure 9: South America Machine-to-Machine Services Industry Revenue Share (%), by Country 2024 & 2032
- Figure 10: North America Machine-to-Machine Services Industry Revenue (Million), by Country 2024 & 2032
- Figure 11: North America Machine-to-Machine Services Industry Revenue Share (%), by Country 2024 & 2032
- Figure 12: MEA Machine-to-Machine Services Industry Revenue (Million), by Country 2024 & 2032
- Figure 13: MEA Machine-to-Machine Services Industry Revenue Share (%), by Country 2024 & 2032
- Figure 14: North America Machine-to-Machine Services Industry Revenue (Million), by Type 2024 & 2032
- Figure 15: North America Machine-to-Machine Services Industry Revenue Share (%), by Type 2024 & 2032
- Figure 16: North America Machine-to-Machine Services Industry Revenue (Million), by End User 2024 & 2032
- Figure 17: North America Machine-to-Machine Services Industry Revenue Share (%), by End User 2024 & 2032
- Figure 18: North America Machine-to-Machine Services Industry Revenue (Million), by Country 2024 & 2032
- Figure 19: North America Machine-to-Machine Services Industry Revenue Share (%), by Country 2024 & 2032
- Figure 20: Europe Machine-to-Machine Services Industry Revenue (Million), by Type 2024 & 2032
- Figure 21: Europe Machine-to-Machine Services Industry Revenue Share (%), by Type 2024 & 2032
- Figure 22: Europe Machine-to-Machine Services Industry Revenue (Million), by End User 2024 & 2032
- Figure 23: Europe Machine-to-Machine Services Industry Revenue Share (%), by End User 2024 & 2032
- Figure 24: Europe Machine-to-Machine Services Industry Revenue (Million), by Country 2024 & 2032
- Figure 25: Europe Machine-to-Machine Services Industry Revenue Share (%), by Country 2024 & 2032
- Figure 26: Asia Pacific Machine-to-Machine Services Industry Revenue (Million), by Type 2024 & 2032
- Figure 27: Asia Pacific Machine-to-Machine Services Industry Revenue Share (%), by Type 2024 & 2032
- Figure 28: Asia Pacific Machine-to-Machine Services Industry Revenue (Million), by End User 2024 & 2032
- Figure 29: Asia Pacific Machine-to-Machine Services Industry Revenue Share (%), by End User 2024 & 2032
- Figure 30: Asia Pacific Machine-to-Machine Services Industry Revenue (Million), by Country 2024 & 2032
- Figure 31: Asia Pacific Machine-to-Machine Services Industry Revenue Share (%), by Country 2024 & 2032
- Figure 32: Latin America Machine-to-Machine Services Industry Revenue (Million), by Type 2024 & 2032
- Figure 33: Latin America Machine-to-Machine Services Industry Revenue Share (%), by Type 2024 & 2032
- Figure 34: Latin America Machine-to-Machine Services Industry Revenue (Million), by End User 2024 & 2032
- Figure 35: Latin America Machine-to-Machine Services Industry Revenue Share (%), by End User 2024 & 2032
- Figure 36: Latin America Machine-to-Machine Services Industry Revenue (Million), by Country 2024 & 2032
- Figure 37: Latin America Machine-to-Machine Services Industry Revenue Share (%), by Country 2024 & 2032
- Figure 38: Middle East Machine-to-Machine Services Industry Revenue (Million), by Type 2024 & 2032
- Figure 39: Middle East Machine-to-Machine Services Industry Revenue Share (%), by Type 2024 & 2032
- Figure 40: Middle East Machine-to-Machine Services Industry Revenue (Million), by End User 2024 & 2032
- Figure 41: Middle East Machine-to-Machine Services Industry Revenue Share (%), by End User 2024 & 2032
- Figure 42: Middle East Machine-to-Machine Services Industry Revenue (Million), by Country 2024 & 2032
- Figure 43: Middle East Machine-to-Machine Services Industry Revenue Share (%), by Country 2024 & 2032
List of Tables
- Table 1: Global Machine-to-Machine Services Industry Revenue Million Forecast, by Region 2019 & 2032
- Table 2: Global Machine-to-Machine Services Industry Revenue Million Forecast, by Type 2019 & 2032
- Table 3: Global Machine-to-Machine Services Industry Revenue Million Forecast, by End User 2019 & 2032
- Table 4: Global Machine-to-Machine Services Industry Revenue Million Forecast, by Region 2019 & 2032
- Table 5: Global Machine-to-Machine Services Industry Revenue Million Forecast, by Country 2019 & 2032
- Table 6: United States Machine-to-Machine Services Industry Revenue (Million) Forecast, by Application 2019 & 2032
- Table 7: Canada Machine-to-Machine Services Industry Revenue (Million) Forecast, by Application 2019 & 2032
- Table 8: Mexico Machine-to-Machine Services Industry Revenue (Million) Forecast, by Application 2019 & 2032
- Table 9: Global Machine-to-Machine Services Industry Revenue Million Forecast, by Country 2019 & 2032
- Table 10: Germany Machine-to-Machine Services Industry Revenue (Million) Forecast, by Application 2019 & 2032
- Table 11: United Kingdom Machine-to-Machine Services Industry Revenue (Million) Forecast, by Application 2019 & 2032
- Table 12: France Machine-to-Machine Services Industry Revenue (Million) Forecast, by Application 2019 & 2032
- Table 13: Spain Machine-to-Machine Services Industry Revenue (Million) Forecast, by Application 2019 & 2032
- Table 14: Italy Machine-to-Machine Services Industry Revenue (Million) Forecast, by Application 2019 & 2032
- Table 15: Spain Machine-to-Machine Services Industry Revenue (Million) Forecast, by Application 2019 & 2032
- Table 16: Belgium Machine-to-Machine Services Industry Revenue (Million) Forecast, by Application 2019 & 2032
- Table 17: Netherland Machine-to-Machine Services Industry Revenue (Million) Forecast, by Application 2019 & 2032
- Table 18: Nordics Machine-to-Machine Services Industry Revenue (Million) Forecast, by Application 2019 & 2032
- Table 19: Rest of Europe Machine-to-Machine Services Industry Revenue (Million) Forecast, by Application 2019 & 2032
- Table 20: Global Machine-to-Machine Services Industry Revenue Million Forecast, by Country 2019 & 2032
- Table 21: China Machine-to-Machine Services Industry Revenue (Million) Forecast, by Application 2019 & 2032
- Table 22: Japan Machine-to-Machine Services Industry Revenue (Million) Forecast, by Application 2019 & 2032
- Table 23: India Machine-to-Machine Services Industry Revenue (Million) Forecast, by Application 2019 & 2032
- Table 24: South Korea Machine-to-Machine Services Industry Revenue (Million) Forecast, by Application 2019 & 2032
- Table 25: Southeast Asia Machine-to-Machine Services Industry Revenue (Million) Forecast, by Application 2019 & 2032
- Table 26: Australia Machine-to-Machine Services Industry Revenue (Million) Forecast, by Application 2019 & 2032
- Table 27: Indonesia Machine-to-Machine Services Industry Revenue (Million) Forecast, by Application 2019 & 2032
- Table 28: Phillipes Machine-to-Machine Services Industry Revenue (Million) Forecast, by Application 2019 & 2032
- Table 29: Singapore Machine-to-Machine Services Industry Revenue (Million) Forecast, by Application 2019 & 2032
- Table 30: Thailandc Machine-to-Machine Services Industry Revenue (Million) Forecast, by Application 2019 & 2032
- Table 31: Rest of Asia Pacific Machine-to-Machine Services Industry Revenue (Million) Forecast, by Application 2019 & 2032
- Table 32: Global Machine-to-Machine Services Industry Revenue Million Forecast, by Country 2019 & 2032
- Table 33: Brazil Machine-to-Machine Services Industry Revenue (Million) Forecast, by Application 2019 & 2032
- Table 34: Argentina Machine-to-Machine Services Industry Revenue (Million) Forecast, by Application 2019 & 2032
- Table 35: Peru Machine-to-Machine Services Industry Revenue (Million) Forecast, by Application 2019 & 2032
- Table 36: Chile Machine-to-Machine Services Industry Revenue (Million) Forecast, by Application 2019 & 2032
- Table 37: Colombia Machine-to-Machine Services Industry Revenue (Million) Forecast, by Application 2019 & 2032
- Table 38: Ecuador Machine-to-Machine Services Industry Revenue (Million) Forecast, by Application 2019 & 2032
- Table 39: Venezuela Machine-to-Machine Services Industry Revenue (Million) Forecast, by Application 2019 & 2032
- Table 40: Rest of South America Machine-to-Machine Services Industry Revenue (Million) Forecast, by Application 2019 & 2032
- Table 41: Global Machine-to-Machine Services Industry Revenue Million Forecast, by Country 2019 & 2032
- Table 42: United States Machine-to-Machine Services Industry Revenue (Million) Forecast, by Application 2019 & 2032
- Table 43: Canada Machine-to-Machine Services Industry Revenue (Million) Forecast, by Application 2019 & 2032
- Table 44: Mexico Machine-to-Machine Services Industry Revenue (Million) Forecast, by Application 2019 & 2032
- Table 45: Global Machine-to-Machine Services Industry Revenue Million Forecast, by Country 2019 & 2032
- Table 46: United Arab Emirates Machine-to-Machine Services Industry Revenue (Million) Forecast, by Application 2019 & 2032
- Table 47: Saudi Arabia Machine-to-Machine Services Industry Revenue (Million) Forecast, by Application 2019 & 2032
- Table 48: South Africa Machine-to-Machine Services Industry Revenue (Million) Forecast, by Application 2019 & 2032
- Table 49: Rest of Middle East and Africa Machine-to-Machine Services Industry Revenue (Million) Forecast, by Application 2019 & 2032
- Table 50: Global Machine-to-Machine Services Industry Revenue Million Forecast, by Type 2019 & 2032
- Table 51: Global Machine-to-Machine Services Industry Revenue Million Forecast, by End User 2019 & 2032
- Table 52: Global Machine-to-Machine Services Industry Revenue Million Forecast, by Country 2019 & 2032
- Table 53: Global Machine-to-Machine Services Industry Revenue Million Forecast, by Type 2019 & 2032
- Table 54: Global Machine-to-Machine Services Industry Revenue Million Forecast, by End User 2019 & 2032
- Table 55: Global Machine-to-Machine Services Industry Revenue Million Forecast, by Country 2019 & 2032
- Table 56: Global Machine-to-Machine Services Industry Revenue Million Forecast, by Type 2019 & 2032
- Table 57: Global Machine-to-Machine Services Industry Revenue Million Forecast, by End User 2019 & 2032
- Table 58: Global Machine-to-Machine Services Industry Revenue Million Forecast, by Country 2019 & 2032
- Table 59: Global Machine-to-Machine Services Industry Revenue Million Forecast, by Type 2019 & 2032
- Table 60: Global Machine-to-Machine Services Industry Revenue Million Forecast, by End User 2019 & 2032
- Table 61: Global Machine-to-Machine Services Industry Revenue Million Forecast, by Country 2019 & 2032
- Table 62: Global Machine-to-Machine Services Industry Revenue Million Forecast, by Type 2019 & 2032
- Table 63: Global Machine-to-Machine Services Industry Revenue Million Forecast, by End User 2019 & 2032
- Table 64: Global Machine-to-Machine Services Industry Revenue Million Forecast, by Country 2019 & 2032
Frequently Asked Questions
1. What is the projected Compound Annual Growth Rate (CAGR) of the Machine-to-Machine Services Industry?
The projected CAGR is approximately 24.41%.
2. Which companies are prominent players in the Machine-to-Machine Services Industry?
Key companies in the market include Amdocs Inc, Verizon Communications Inc*List Not Exhaustive, Cstar Technologies Inc, Comarch Inc, Thales Group (Gemalto NV), Huawei Technologies Co Ltd, Rogers Communications Inc, Cisco System Inc, International Business Machine Corporation, Nokia Corp (Alcatel-Lucent S A ), EE Ltd, Intel Corporation.
3. What are the main segments of the Machine-to-Machine Services Industry?
The market segments include Type, End User.
4. Can you provide details about the market size?
The market size is estimated to be USD 84.20 Million as of 2022.
5. What are some drivers contributing to market growth?
Rapid Technological Advancements; Increasing Number of Connected Devices.
6. What are the notable trends driving market growth?
Telecom Industry to Witness Significant Growth Among Other End-user Verticals.
7. Are there any restraints impacting market growth?
Lack of Standardization; Huge Delivery Cost.
8. Can you provide examples of recent developments in the market?
November 2023 : Ericsson has launched an intelligent, cloud-native transport controller that uses artificial intelligence and machine learning to analyze and automate microwave, IP and optical networks, providing communications service providers (CSPs) with an advanced solution for maximizing mobile transport network efficiency.
9. What pricing options are available for accessing the report?
Pricing options include single-user, multi-user, and enterprise licenses priced at USD 4750, USD 5250, and USD 8750 respectively.
10. Is the market size provided in terms of value or volume?
The market size is provided in terms of value, measured in Million.
11. Are there any specific market keywords associated with the report?
Yes, the market keyword associated with the report is "Machine-to-Machine Services Industry," which aids in identifying and referencing the specific market segment covered.
12. How do I determine which pricing option suits my needs best?
The pricing options vary based on user requirements and access needs. Individual users may opt for single-user licenses, while businesses requiring broader access may choose multi-user or enterprise licenses for cost-effective access to the report.
13. Are there any additional resources or data provided in the Machine-to-Machine Services Industry report?
While the report offers comprehensive insights, it's advisable to review the specific contents or supplementary materials provided to ascertain if additional resources or data are available.
14. How can I stay updated on further developments or reports in the Machine-to-Machine Services Industry?
To stay informed about further developments, trends, and reports in the Machine-to-Machine Services Industry, consider subscribing to industry newsletters, following relevant companies and organizations, or regularly checking reputable industry news sources and publications.
Methodology
Step 1 - Identification of Relevant Samples Size from Population Database


Step 2 - Approaches for Defining Global Market Size (Value, Volume* & Price*)

Note*: In applicable scenarios
Step 3 - Data Sources
Primary Research
- Web Analytics
- Survey Reports
- Research Institute
- Latest Research Reports
- Opinion Leaders
Secondary Research
- Annual Reports
- White Paper
- Latest Press Release
- Industry Association
- Paid Database
- Investor Presentations

Step 4 - Data Triangulation
Involves using different sources of information in order to increase the validity of a study
These sources are likely to be stakeholders in a program - participants, other researchers, program staff, other community members, and so on.
Then we put all data in single framework & apply various statistical tools to find out the dynamic on the market.
During the analysis stage, feedback from the stakeholder groups would be compared to determine areas of agreement as well as areas of divergence


