
Key Insights
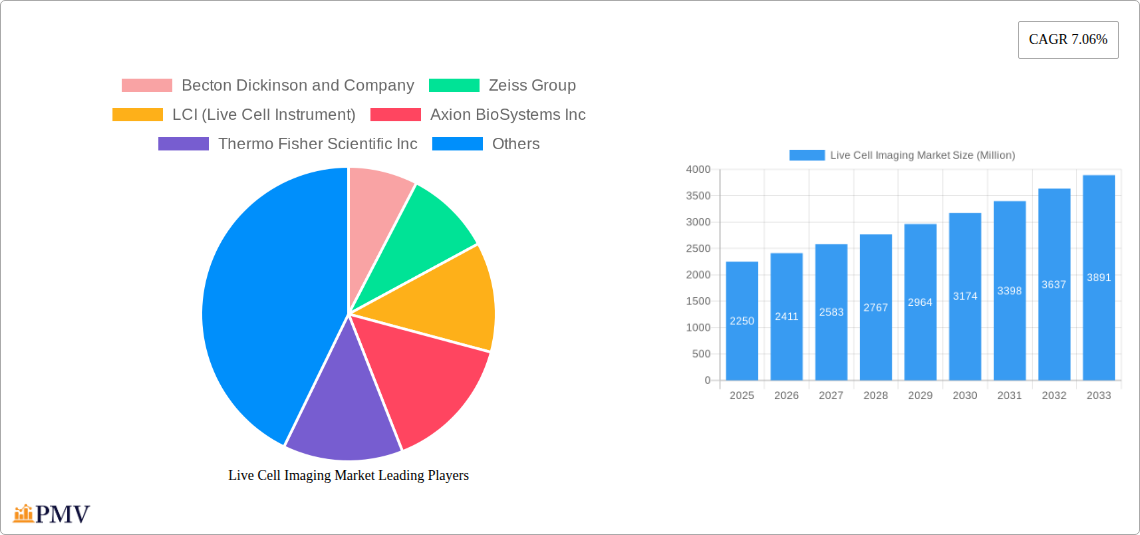
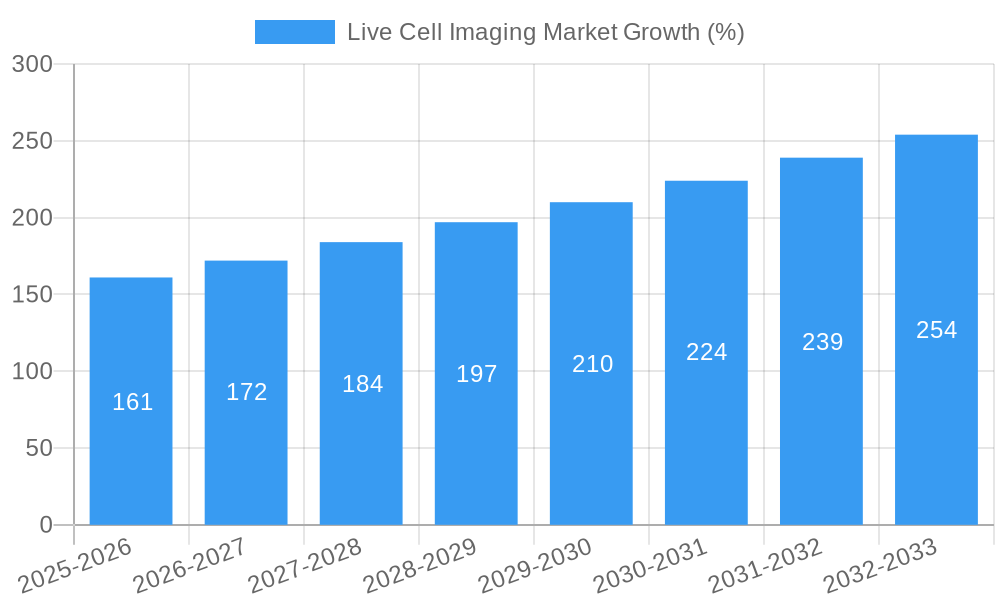
The live cell imaging market, valued at $2.25 billion in 2025, is projected to experience robust growth, driven by a compound annual growth rate (CAGR) of 7.06% from 2025 to 2033. This expansion is fueled by several key factors. Advancements in microscopy techniques, including super-resolution microscopy and automated imaging systems, are enabling researchers to obtain higher-resolution images and analyze larger datasets with greater efficiency. The increasing prevalence of chronic diseases, such as cancer and cardiovascular diseases, is driving demand for innovative drug discovery and development methods, significantly boosting the adoption of live cell imaging in pharmaceutical and biotechnology research. Furthermore, the growing application of live cell imaging in stem cell research and regenerative medicine contributes to market growth. The market's segmentation encompasses various imaging devices, consumables (including specialized reagents and media), software and services for image analysis, and diverse applications across various biological fields. Competition is fierce, with major players like Thermo Fisher Scientific, Zeiss, and Becton Dickinson vying for market share through product innovation and strategic partnerships.
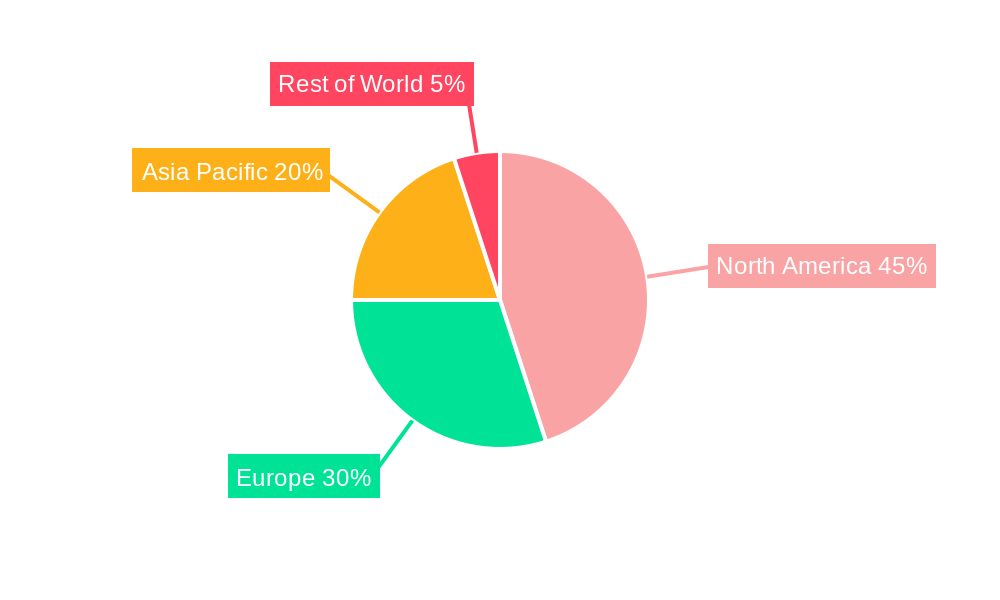
Geographic distribution shows a significant concentration in North America and Europe, due to well-established research infrastructure and high healthcare expenditure. However, the Asia-Pacific region is poised for significant growth, fueled by expanding research capabilities and increasing government investment in life sciences research. The market faces some challenges, including the high cost of advanced live cell imaging equipment and the need for specialized expertise to operate and analyze the resulting data. Nevertheless, ongoing technological advancements and the increasing importance of personalized medicine are anticipated to mitigate these challenges and sustain the market's upward trajectory. The continued integration of artificial intelligence and machine learning in image analysis is expected to further enhance efficiency and data interpretation, driving further market expansion in the coming years.
Live Cell Imaging Market: A Comprehensive Report (2019-2033)
This detailed report provides a comprehensive analysis of the Live Cell Imaging market, encompassing market structure, competitive dynamics, industry trends, dominant segments, product innovations, and future outlook. The study period spans from 2019 to 2033, with 2025 serving as the base and estimated year. The report leverages extensive data analysis to provide actionable insights for stakeholders across the live cell imaging ecosystem. The market is projected to reach xx Million by 2033, exhibiting a CAGR of xx% during the forecast period (2025-2033).
Live Cell Imaging Market Structure & Competitive Dynamics
The live cell imaging market is characterized by a moderately concentrated competitive landscape with several key players vying for market share. The market structure is influenced by factors such as technological innovation, regulatory approvals, and strategic mergers and acquisitions (M&A) activities. Leading players such as Becton Dickinson and Company, Zeiss Group, Thermo Fisher Scientific Inc, and Danaher (Leica Microsystems) hold significant market share, contributing to a high level of competition. However, the market also accommodates smaller players specializing in niche applications or technologies, contributing to a dynamic and innovative ecosystem.
Market concentration is further influenced by regional variations in regulatory frameworks and end-user adoption rates. While precise market share figures for each player are proprietary to this report, analysis reveals a competitive landscape with varying levels of market concentration in different regions and segments. M&A activities have played a significant role in shaping the market structure. Recent transactions, although specific deal values are confidential, have involved significant investments in developing cutting-edge live cell imaging technology. These activities highlight the strategic importance of consolidation and expansion within this competitive market. The continuous evolution of technology and regulatory landscape necessitates agile adaptation and strategic planning by players seeking to thrive in this arena.
Live Cell Imaging Market Industry Trends & Insights
The live cell imaging market is experiencing robust growth, driven by a confluence of factors. The rising prevalence of chronic diseases globally fuels increased demand for sophisticated drug discovery tools and biological research techniques. Advances in microscopic technology, including the development of super-resolution microscopy and AI-powered image analysis, contribute significantly to market expansion. Consumer preferences are shifting towards high-throughput, automated systems that minimize manual intervention and enhance efficiency. This preference creates a lucrative market segment for advanced software and services integrated with imaging equipment. Furthermore, ongoing research and development efforts, coupled with technological advancements like label-free imaging and improved 3D visualization capabilities, contribute to the consistent expansion of the market. The market penetration of these advanced technologies, particularly in areas such as drug discovery and stem cell research, continues to grow at a substantial rate.
The overall market is experiencing a significant upswing, with applications in diverse fields – from cell biology and developmental biology to stem cell biology and drug discovery- pushing the market's expansion. A deeper dive into the CAGR (Compound Annual Growth Rate) for each segment reveals that certain areas, such as stem cell biology and advanced drug discovery techniques, are outpacing the overall market growth, creating high-value opportunities for market participants. Competitive dynamics are further shaped by ongoing innovation, resulting in regular product launches and upgrades from major players that are aiming for sustained market leadership.
Dominant Markets & Segments in Live Cell Imaging Market
Leading Region/Country: North America currently holds the dominant position in the global live cell imaging market, driven by robust research funding, advanced healthcare infrastructure, and a high concentration of pharmaceutical and biotechnology companies.
Dominant Segments:
- By Product: Equipment constitutes the largest segment in the market, driven by increasing investments in advanced imaging technologies and the need for robust and reliable equipment capable of high-resolution imaging.
- By Application: Drug discovery is a dominant application area, owing to the crucial role of live cell imaging in evaluating drug efficacy, toxicity, and mechanism of action.
- By Image Capturing Devices: Consumables represent a significant segment, reflecting the ongoing need for specialized reagents, dyes, and other consumables necessary for live cell imaging experiments.
- By Other Consumables: Software and services are gaining prominence, driven by the demand for advanced image analysis software and specialized support services which provide researchers with the tools to extract meaningful insights from the gathered data.
Key Drivers for Dominance:
- North America: Robust government funding for research and development in life sciences, a strong presence of pharmaceutical and biotechnology companies, and well-established healthcare infrastructure.
- Equipment Segment: Continuous technological advancements, increasing demand for high-throughput screening applications and a high focus on research and development.
- Drug Discovery Application: The pivotal role of live cell imaging in drug development and the ever-growing need to accelerate the drug discovery process.
- Consumables Segment: Essential reagents and dyes continuously required for live cell imaging experiments which are vital for various scientific fields.
- Software and Services Segment: Growing need for data analysis and interpretation to extract value from live cell imaging experiments, paired with increased availability of robust, reliable, and user-friendly software.
Live Cell Imaging Market Product Innovations
Recent advancements in live cell imaging technology are heavily focused on enhancing image resolution, reducing phototoxicity, and automating workflows. This includes the incorporation of AI-powered image analysis tools and the development of label-free imaging techniques. These innovations are driving market growth by improving experimental efficiency, reducing costs, and expanding the applications of live cell imaging. For example, the launch of Nanolive's 3D Cell Explorer 96focus is a game-changer, allowing for high-content analysis without labels, thus improving the cost-effectiveness and reliability of research.
Report Segmentation & Scope
This report segments the live cell imaging market across various parameters:
By Product: Equipment (microscopes, incubators, etc.) and Consumables (reagents, dyes, etc.) The equipment segment is projected to witness substantial growth due to increasing demand for high-resolution imaging and automation.
By Image Capturing Devices: Covers various types of devices employed in capturing images of live cells. This includes various types of microscopy with associated equipment and further associated consumable.
By Other Consumables: Includes software and services to support the entire live cell imaging workflow from image acquisition to analysis. This segment is expected to experience steady growth due to increasing demand for advanced image analysis capabilities.
By Application: Cell biology, developmental biology, stem cell biology, drug discovery, and other applications. The drug discovery application segment is expected to dominate due to the increasing need for high-throughput screening and drug efficacy testing. Each segment features a competitive analysis outlining leading players and their respective market positions. Growth projections and market size estimations are provided for each segment throughout the forecast period.
Key Drivers of Live Cell Imaging Market Growth
The live cell imaging market is propelled by several key factors:
Technological advancements: The continuous development of high-resolution microscopy techniques, label-free imaging methods, and AI-powered image analysis tools significantly improves the efficacy and application of the technology.
Increased research funding: Growing investments in biomedical research, particularly in areas such as drug discovery and stem cell research, directly translate to a higher demand for live cell imaging technology.
Growing prevalence of chronic diseases: The rise in chronic diseases worldwide necessitates better diagnostic and therapeutic options, with live cell imaging playing a significant role in this domain.
Challenges in the Live Cell Imaging Market Sector
The live cell imaging market faces several challenges:
High cost of equipment and consumables: Advanced live cell imaging systems can be expensive, potentially hindering adoption, particularly in resource-constrained settings.
Complex data analysis: The substantial data generated by live cell imaging necessitates sophisticated analytical tools and expertise, which can be a barrier for certain researchers.
Stringent regulatory requirements: Compliance with regulatory standards for medical devices and research applications can pose a hurdle for market players and slow down adoption.
Leading Players in the Live Cell Imaging Market
- Becton Dickinson and Company
- Zeiss Group
- LCI (Live Cell Instrument)
- Axion BioSystems Inc
- Thermo Fisher Scientific Inc
- Danaher (Leica Microsystems)
- Agilent Technologies Inc
- Sartorius AG
- Nikon Corporation Inc
- Olympus Corporation (EVIDENT)
- Merck KGaA (Sigma- Aldrich Corporation)
- PerkinElmer Inc
Key Developments in Live Cell Imaging Market Sector
June 2023: Nanolive launched the 3D Cell Explorer 96focus, a high-content analysis platform for label-free live cell imaging, streamlining the process with AI-powered assays and automated workflows. This significantly improves the efficiency and cost-effectiveness of live cell imaging experiments.
February 2023: Nikon Corporation launched the Nikon Spatial Array Confocal (NSPARC) detector for AX systems, enabling high-resolution live tissue imaging with minimal phototoxicity. This advancement addresses a key limitation in live cell imaging, enhancing the quality and applicability of the technology.
Strategic Live Cell Imaging Market Outlook
The live cell imaging market holds significant promise for future growth. Ongoing technological advancements, coupled with the increasing demand for high-throughput screening and personalized medicine, are poised to drive substantial market expansion. Strategic opportunities lie in the development of innovative imaging techniques, advanced software solutions for image analysis, and targeted marketing efforts focused on specific research areas and clinical applications. The integration of artificial intelligence and machine learning into live cell imaging workflows presents significant potential for enhancing efficiency and extracting valuable insights from complex datasets. The market will see a shift towards more automated, user-friendly systems, tailored to diverse research and clinical settings.
Live Cell Imaging Market Segmentation
-
1. Product
-
1.1. Equipment
- 1.1.1. Standalone Systems
- 1.1.2. Microscopes
- 1.1.3. Cell Analyzers
- 1.1.4. Image Capturing Devices
-
1.2. Consumables
- 1.2.1. Reagents and Kits
- 1.2.2. Other Consumables
- 1.3. Software and Services
-
1.1. Equipment
-
2. Application
- 2.1. Cell Biology
- 2.2. Developmental Biology
- 2.3. Stem Cell Biology
- 2.4. Drug Discovery
- 2.5. Other Applications
Live Cell Imaging Market Segmentation By Geography
-
1. North America
- 1.1. United States
- 1.2. Canada
- 1.3. Mexico
-
2. Europe
- 2.1. Germany
- 2.2. United Kingdom
- 2.3. France
- 2.4. Italy
- 2.5. Spain
- 2.6. Rest of Europe
-
3. Asia Pacific
- 3.1. China
- 3.2. Japan
- 3.3. India
- 3.4. Australia
- 3.5. South Korea
- 3.6. Rest of Asia Pacific
-
4. Middle East and Africa
- 4.1. GCC
- 4.2. South Africa
- 4.3. Rest of Middle East and Africa
-
5. South America
- 5.1. Brazil
- 5.2. Argentina
- 5.3. Rest of South America
Live Cell Imaging Market REPORT HIGHLIGHTS
| Aspects | Details |
|---|---|
| Study Period | 2019-2033 |
| Base Year | 2024 |
| Estimated Year | 2025 |
| Forecast Period | 2025-2033 |
| Historical Period | 2019-2024 |
| Growth Rate | CAGR of 7.06% from 2019-2033 |
| Segmentation |
|
Table of Contents
- 1. Introduction
- 1.1. Research Scope
- 1.2. Market Segmentation
- 1.3. Research Methodology
- 1.4. Definitions and Assumptions
- 2. Executive Summary
- 2.1. Introduction
- 3. Market Dynamics
- 3.1. Introduction
- 3.2. Market Drivers
- 3.2.1. Adoption of High-content Screening Techniques in Drug Discovery; Rising Prevalence of Chronic Disease Demanding Higher and Quicker Diagnostic Facilities; Government Funding for Cell-based Research
- 3.3. Market Restrains
- 3.3.1. High Cost of High-content Screening Systems; Shortage of Skilled Professionals
- 3.4. Market Trends
- 3.4.1. Standalone Systems Segment is Expected to Hold a Significant Market Share Over the Forecast Period
- 4. Market Factor Analysis
- 4.1. Porters Five Forces
- 4.2. Supply/Value Chain
- 4.3. PESTEL analysis
- 4.4. Market Entropy
- 4.5. Patent/Trademark Analysis
- 5. Global Live Cell Imaging Market Analysis, Insights and Forecast, 2019-2031
- 5.1. Market Analysis, Insights and Forecast - by Product
- 5.1.1. Equipment
- 5.1.1.1. Standalone Systems
- 5.1.1.2. Microscopes
- 5.1.1.3. Cell Analyzers
- 5.1.1.4. Image Capturing Devices
- 5.1.2. Consumables
- 5.1.2.1. Reagents and Kits
- 5.1.2.2. Other Consumables
- 5.1.3. Software and Services
- 5.1.1. Equipment
- 5.2. Market Analysis, Insights and Forecast - by Application
- 5.2.1. Cell Biology
- 5.2.2. Developmental Biology
- 5.2.3. Stem Cell Biology
- 5.2.4. Drug Discovery
- 5.2.5. Other Applications
- 5.3. Market Analysis, Insights and Forecast - by Region
- 5.3.1. North America
- 5.3.2. Europe
- 5.3.3. Asia Pacific
- 5.3.4. Middle East and Africa
- 5.3.5. South America
- 5.1. Market Analysis, Insights and Forecast - by Product
- 6. North America Live Cell Imaging Market Analysis, Insights and Forecast, 2019-2031
- 6.1. Market Analysis, Insights and Forecast - by Product
- 6.1.1. Equipment
- 6.1.1.1. Standalone Systems
- 6.1.1.2. Microscopes
- 6.1.1.3. Cell Analyzers
- 6.1.1.4. Image Capturing Devices
- 6.1.2. Consumables
- 6.1.2.1. Reagents and Kits
- 6.1.2.2. Other Consumables
- 6.1.3. Software and Services
- 6.1.1. Equipment
- 6.2. Market Analysis, Insights and Forecast - by Application
- 6.2.1. Cell Biology
- 6.2.2. Developmental Biology
- 6.2.3. Stem Cell Biology
- 6.2.4. Drug Discovery
- 6.2.5. Other Applications
- 6.1. Market Analysis, Insights and Forecast - by Product
- 7. Europe Live Cell Imaging Market Analysis, Insights and Forecast, 2019-2031
- 7.1. Market Analysis, Insights and Forecast - by Product
- 7.1.1. Equipment
- 7.1.1.1. Standalone Systems
- 7.1.1.2. Microscopes
- 7.1.1.3. Cell Analyzers
- 7.1.1.4. Image Capturing Devices
- 7.1.2. Consumables
- 7.1.2.1. Reagents and Kits
- 7.1.2.2. Other Consumables
- 7.1.3. Software and Services
- 7.1.1. Equipment
- 7.2. Market Analysis, Insights and Forecast - by Application
- 7.2.1. Cell Biology
- 7.2.2. Developmental Biology
- 7.2.3. Stem Cell Biology
- 7.2.4. Drug Discovery
- 7.2.5. Other Applications
- 7.1. Market Analysis, Insights and Forecast - by Product
- 8. Asia Pacific Live Cell Imaging Market Analysis, Insights and Forecast, 2019-2031
- 8.1. Market Analysis, Insights and Forecast - by Product
- 8.1.1. Equipment
- 8.1.1.1. Standalone Systems
- 8.1.1.2. Microscopes
- 8.1.1.3. Cell Analyzers
- 8.1.1.4. Image Capturing Devices
- 8.1.2. Consumables
- 8.1.2.1. Reagents and Kits
- 8.1.2.2. Other Consumables
- 8.1.3. Software and Services
- 8.1.1. Equipment
- 8.2. Market Analysis, Insights and Forecast - by Application
- 8.2.1. Cell Biology
- 8.2.2. Developmental Biology
- 8.2.3. Stem Cell Biology
- 8.2.4. Drug Discovery
- 8.2.5. Other Applications
- 8.1. Market Analysis, Insights and Forecast - by Product
- 9. Middle East and Africa Live Cell Imaging Market Analysis, Insights and Forecast, 2019-2031
- 9.1. Market Analysis, Insights and Forecast - by Product
- 9.1.1. Equipment
- 9.1.1.1. Standalone Systems
- 9.1.1.2. Microscopes
- 9.1.1.3. Cell Analyzers
- 9.1.1.4. Image Capturing Devices
- 9.1.2. Consumables
- 9.1.2.1. Reagents and Kits
- 9.1.2.2. Other Consumables
- 9.1.3. Software and Services
- 9.1.1. Equipment
- 9.2. Market Analysis, Insights and Forecast - by Application
- 9.2.1. Cell Biology
- 9.2.2. Developmental Biology
- 9.2.3. Stem Cell Biology
- 9.2.4. Drug Discovery
- 9.2.5. Other Applications
- 9.1. Market Analysis, Insights and Forecast - by Product
- 10. South America Live Cell Imaging Market Analysis, Insights and Forecast, 2019-2031
- 10.1. Market Analysis, Insights and Forecast - by Product
- 10.1.1. Equipment
- 10.1.1.1. Standalone Systems
- 10.1.1.2. Microscopes
- 10.1.1.3. Cell Analyzers
- 10.1.1.4. Image Capturing Devices
- 10.1.2. Consumables
- 10.1.2.1. Reagents and Kits
- 10.1.2.2. Other Consumables
- 10.1.3. Software and Services
- 10.1.1. Equipment
- 10.2. Market Analysis, Insights and Forecast - by Application
- 10.2.1. Cell Biology
- 10.2.2. Developmental Biology
- 10.2.3. Stem Cell Biology
- 10.2.4. Drug Discovery
- 10.2.5. Other Applications
- 10.1. Market Analysis, Insights and Forecast - by Product
- 11. North America Live Cell Imaging Market Analysis, Insights and Forecast, 2019-2031
- 11.1. Market Analysis, Insights and Forecast - By Country/Sub-region
- 11.1.1 United States
- 11.1.2 Canada
- 11.1.3 Mexico
- 12. Europe Live Cell Imaging Market Analysis, Insights and Forecast, 2019-2031
- 12.1. Market Analysis, Insights and Forecast - By Country/Sub-region
- 12.1.1 Germany
- 12.1.2 United Kingdom
- 12.1.3 France
- 12.1.4 Italy
- 12.1.5 Spain
- 12.1.6 Rest of Europe
- 13. Asia Pacific Live Cell Imaging Market Analysis, Insights and Forecast, 2019-2031
- 13.1. Market Analysis, Insights and Forecast - By Country/Sub-region
- 13.1.1 China
- 13.1.2 Japan
- 13.1.3 India
- 13.1.4 Australia
- 13.1.5 South Korea
- 13.1.6 Rest of Asia Pacific
- 14. Middle East and Africa Live Cell Imaging Market Analysis, Insights and Forecast, 2019-2031
- 14.1. Market Analysis, Insights and Forecast - By Country/Sub-region
- 14.1.1 GCC
- 14.1.2 South Africa
- 14.1.3 Rest of Middle East and Africa
- 15. South America Live Cell Imaging Market Analysis, Insights and Forecast, 2019-2031
- 15.1. Market Analysis, Insights and Forecast - By Country/Sub-region
- 15.1.1 Brazil
- 15.1.2 Argentina
- 15.1.3 Rest of South America
- 16. Competitive Analysis
- 16.1. Global Market Share Analysis 2024
- 16.2. Company Profiles
- 16.2.1 Becton Dickinson and Company
- 16.2.1.1. Overview
- 16.2.1.2. Products
- 16.2.1.3. SWOT Analysis
- 16.2.1.4. Recent Developments
- 16.2.1.5. Financials (Based on Availability)
- 16.2.2 Zeiss Group
- 16.2.2.1. Overview
- 16.2.2.2. Products
- 16.2.2.3. SWOT Analysis
- 16.2.2.4. Recent Developments
- 16.2.2.5. Financials (Based on Availability)
- 16.2.3 LCI (Live Cell Instrument)
- 16.2.3.1. Overview
- 16.2.3.2. Products
- 16.2.3.3. SWOT Analysis
- 16.2.3.4. Recent Developments
- 16.2.3.5. Financials (Based on Availability)
- 16.2.4 Axion BioSystems Inc
- 16.2.4.1. Overview
- 16.2.4.2. Products
- 16.2.4.3. SWOT Analysis
- 16.2.4.4. Recent Developments
- 16.2.4.5. Financials (Based on Availability)
- 16.2.5 Thermo Fisher Scientific Inc
- 16.2.5.1. Overview
- 16.2.5.2. Products
- 16.2.5.3. SWOT Analysis
- 16.2.5.4. Recent Developments
- 16.2.5.5. Financials (Based on Availability)
- 16.2.6 Danaher (Leica Microsystems)
- 16.2.6.1. Overview
- 16.2.6.2. Products
- 16.2.6.3. SWOT Analysis
- 16.2.6.4. Recent Developments
- 16.2.6.5. Financials (Based on Availability)
- 16.2.7 Agilent Technologies Inc
- 16.2.7.1. Overview
- 16.2.7.2. Products
- 16.2.7.3. SWOT Analysis
- 16.2.7.4. Recent Developments
- 16.2.7.5. Financials (Based on Availability)
- 16.2.8 Sartorius AG*List Not Exhaustive
- 16.2.8.1. Overview
- 16.2.8.2. Products
- 16.2.8.3. SWOT Analysis
- 16.2.8.4. Recent Developments
- 16.2.8.5. Financials (Based on Availability)
- 16.2.9 Nikon Corporation Inc
- 16.2.9.1. Overview
- 16.2.9.2. Products
- 16.2.9.3. SWOT Analysis
- 16.2.9.4. Recent Developments
- 16.2.9.5. Financials (Based on Availability)
- 16.2.10 Olympus Corporation (EVIDENT)
- 16.2.10.1. Overview
- 16.2.10.2. Products
- 16.2.10.3. SWOT Analysis
- 16.2.10.4. Recent Developments
- 16.2.10.5. Financials (Based on Availability)
- 16.2.11 Merck KGaA (Sigma- Aldrich Corporation)
- 16.2.11.1. Overview
- 16.2.11.2. Products
- 16.2.11.3. SWOT Analysis
- 16.2.11.4. Recent Developments
- 16.2.11.5. Financials (Based on Availability)
- 16.2.12 PerkinElmer Inc
- 16.2.12.1. Overview
- 16.2.12.2. Products
- 16.2.12.3. SWOT Analysis
- 16.2.12.4. Recent Developments
- 16.2.12.5. Financials (Based on Availability)
- 16.2.1 Becton Dickinson and Company
List of Figures
- Figure 1: Global Live Cell Imaging Market Revenue Breakdown (Million, %) by Region 2024 & 2032
- Figure 2: North America Live Cell Imaging Market Revenue (Million), by Country 2024 & 2032
- Figure 3: North America Live Cell Imaging Market Revenue Share (%), by Country 2024 & 2032
- Figure 4: Europe Live Cell Imaging Market Revenue (Million), by Country 2024 & 2032
- Figure 5: Europe Live Cell Imaging Market Revenue Share (%), by Country 2024 & 2032
- Figure 6: Asia Pacific Live Cell Imaging Market Revenue (Million), by Country 2024 & 2032
- Figure 7: Asia Pacific Live Cell Imaging Market Revenue Share (%), by Country 2024 & 2032
- Figure 8: Middle East and Africa Live Cell Imaging Market Revenue (Million), by Country 2024 & 2032
- Figure 9: Middle East and Africa Live Cell Imaging Market Revenue Share (%), by Country 2024 & 2032
- Figure 10: South America Live Cell Imaging Market Revenue (Million), by Country 2024 & 2032
- Figure 11: South America Live Cell Imaging Market Revenue Share (%), by Country 2024 & 2032
- Figure 12: North America Live Cell Imaging Market Revenue (Million), by Product 2024 & 2032
- Figure 13: North America Live Cell Imaging Market Revenue Share (%), by Product 2024 & 2032
- Figure 14: North America Live Cell Imaging Market Revenue (Million), by Application 2024 & 2032
- Figure 15: North America Live Cell Imaging Market Revenue Share (%), by Application 2024 & 2032
- Figure 16: North America Live Cell Imaging Market Revenue (Million), by Country 2024 & 2032
- Figure 17: North America Live Cell Imaging Market Revenue Share (%), by Country 2024 & 2032
- Figure 18: Europe Live Cell Imaging Market Revenue (Million), by Product 2024 & 2032
- Figure 19: Europe Live Cell Imaging Market Revenue Share (%), by Product 2024 & 2032
- Figure 20: Europe Live Cell Imaging Market Revenue (Million), by Application 2024 & 2032
- Figure 21: Europe Live Cell Imaging Market Revenue Share (%), by Application 2024 & 2032
- Figure 22: Europe Live Cell Imaging Market Revenue (Million), by Country 2024 & 2032
- Figure 23: Europe Live Cell Imaging Market Revenue Share (%), by Country 2024 & 2032
- Figure 24: Asia Pacific Live Cell Imaging Market Revenue (Million), by Product 2024 & 2032
- Figure 25: Asia Pacific Live Cell Imaging Market Revenue Share (%), by Product 2024 & 2032
- Figure 26: Asia Pacific Live Cell Imaging Market Revenue (Million), by Application 2024 & 2032
- Figure 27: Asia Pacific Live Cell Imaging Market Revenue Share (%), by Application 2024 & 2032
- Figure 28: Asia Pacific Live Cell Imaging Market Revenue (Million), by Country 2024 & 2032
- Figure 29: Asia Pacific Live Cell Imaging Market Revenue Share (%), by Country 2024 & 2032
- Figure 30: Middle East and Africa Live Cell Imaging Market Revenue (Million), by Product 2024 & 2032
- Figure 31: Middle East and Africa Live Cell Imaging Market Revenue Share (%), by Product 2024 & 2032
- Figure 32: Middle East and Africa Live Cell Imaging Market Revenue (Million), by Application 2024 & 2032
- Figure 33: Middle East and Africa Live Cell Imaging Market Revenue Share (%), by Application 2024 & 2032
- Figure 34: Middle East and Africa Live Cell Imaging Market Revenue (Million), by Country 2024 & 2032
- Figure 35: Middle East and Africa Live Cell Imaging Market Revenue Share (%), by Country 2024 & 2032
- Figure 36: South America Live Cell Imaging Market Revenue (Million), by Product 2024 & 2032
- Figure 37: South America Live Cell Imaging Market Revenue Share (%), by Product 2024 & 2032
- Figure 38: South America Live Cell Imaging Market Revenue (Million), by Application 2024 & 2032
- Figure 39: South America Live Cell Imaging Market Revenue Share (%), by Application 2024 & 2032
- Figure 40: South America Live Cell Imaging Market Revenue (Million), by Country 2024 & 2032
- Figure 41: South America Live Cell Imaging Market Revenue Share (%), by Country 2024 & 2032
List of Tables
- Table 1: Global Live Cell Imaging Market Revenue Million Forecast, by Region 2019 & 2032
- Table 2: Global Live Cell Imaging Market Revenue Million Forecast, by Product 2019 & 2032
- Table 3: Global Live Cell Imaging Market Revenue Million Forecast, by Application 2019 & 2032
- Table 4: Global Live Cell Imaging Market Revenue Million Forecast, by Region 2019 & 2032
- Table 5: Global Live Cell Imaging Market Revenue Million Forecast, by Country 2019 & 2032
- Table 6: United States Live Cell Imaging Market Revenue (Million) Forecast, by Application 2019 & 2032
- Table 7: Canada Live Cell Imaging Market Revenue (Million) Forecast, by Application 2019 & 2032
- Table 8: Mexico Live Cell Imaging Market Revenue (Million) Forecast, by Application 2019 & 2032
- Table 9: Global Live Cell Imaging Market Revenue Million Forecast, by Country 2019 & 2032
- Table 10: Germany Live Cell Imaging Market Revenue (Million) Forecast, by Application 2019 & 2032
- Table 11: United Kingdom Live Cell Imaging Market Revenue (Million) Forecast, by Application 2019 & 2032
- Table 12: France Live Cell Imaging Market Revenue (Million) Forecast, by Application 2019 & 2032
- Table 13: Italy Live Cell Imaging Market Revenue (Million) Forecast, by Application 2019 & 2032
- Table 14: Spain Live Cell Imaging Market Revenue (Million) Forecast, by Application 2019 & 2032
- Table 15: Rest of Europe Live Cell Imaging Market Revenue (Million) Forecast, by Application 2019 & 2032
- Table 16: Global Live Cell Imaging Market Revenue Million Forecast, by Country 2019 & 2032
- Table 17: China Live Cell Imaging Market Revenue (Million) Forecast, by Application 2019 & 2032
- Table 18: Japan Live Cell Imaging Market Revenue (Million) Forecast, by Application 2019 & 2032
- Table 19: India Live Cell Imaging Market Revenue (Million) Forecast, by Application 2019 & 2032
- Table 20: Australia Live Cell Imaging Market Revenue (Million) Forecast, by Application 2019 & 2032
- Table 21: South Korea Live Cell Imaging Market Revenue (Million) Forecast, by Application 2019 & 2032
- Table 22: Rest of Asia Pacific Live Cell Imaging Market Revenue (Million) Forecast, by Application 2019 & 2032
- Table 23: Global Live Cell Imaging Market Revenue Million Forecast, by Country 2019 & 2032
- Table 24: GCC Live Cell Imaging Market Revenue (Million) Forecast, by Application 2019 & 2032
- Table 25: South Africa Live Cell Imaging Market Revenue (Million) Forecast, by Application 2019 & 2032
- Table 26: Rest of Middle East and Africa Live Cell Imaging Market Revenue (Million) Forecast, by Application 2019 & 2032
- Table 27: Global Live Cell Imaging Market Revenue Million Forecast, by Country 2019 & 2032
- Table 28: Brazil Live Cell Imaging Market Revenue (Million) Forecast, by Application 2019 & 2032
- Table 29: Argentina Live Cell Imaging Market Revenue (Million) Forecast, by Application 2019 & 2032
- Table 30: Rest of South America Live Cell Imaging Market Revenue (Million) Forecast, by Application 2019 & 2032
- Table 31: Global Live Cell Imaging Market Revenue Million Forecast, by Product 2019 & 2032
- Table 32: Global Live Cell Imaging Market Revenue Million Forecast, by Application 2019 & 2032
- Table 33: Global Live Cell Imaging Market Revenue Million Forecast, by Country 2019 & 2032
- Table 34: United States Live Cell Imaging Market Revenue (Million) Forecast, by Application 2019 & 2032
- Table 35: Canada Live Cell Imaging Market Revenue (Million) Forecast, by Application 2019 & 2032
- Table 36: Mexico Live Cell Imaging Market Revenue (Million) Forecast, by Application 2019 & 2032
- Table 37: Global Live Cell Imaging Market Revenue Million Forecast, by Product 2019 & 2032
- Table 38: Global Live Cell Imaging Market Revenue Million Forecast, by Application 2019 & 2032
- Table 39: Global Live Cell Imaging Market Revenue Million Forecast, by Country 2019 & 2032
- Table 40: Germany Live Cell Imaging Market Revenue (Million) Forecast, by Application 2019 & 2032
- Table 41: United Kingdom Live Cell Imaging Market Revenue (Million) Forecast, by Application 2019 & 2032
- Table 42: France Live Cell Imaging Market Revenue (Million) Forecast, by Application 2019 & 2032
- Table 43: Italy Live Cell Imaging Market Revenue (Million) Forecast, by Application 2019 & 2032
- Table 44: Spain Live Cell Imaging Market Revenue (Million) Forecast, by Application 2019 & 2032
- Table 45: Rest of Europe Live Cell Imaging Market Revenue (Million) Forecast, by Application 2019 & 2032
- Table 46: Global Live Cell Imaging Market Revenue Million Forecast, by Product 2019 & 2032
- Table 47: Global Live Cell Imaging Market Revenue Million Forecast, by Application 2019 & 2032
- Table 48: Global Live Cell Imaging Market Revenue Million Forecast, by Country 2019 & 2032
- Table 49: China Live Cell Imaging Market Revenue (Million) Forecast, by Application 2019 & 2032
- Table 50: Japan Live Cell Imaging Market Revenue (Million) Forecast, by Application 2019 & 2032
- Table 51: India Live Cell Imaging Market Revenue (Million) Forecast, by Application 2019 & 2032
- Table 52: Australia Live Cell Imaging Market Revenue (Million) Forecast, by Application 2019 & 2032
- Table 53: South Korea Live Cell Imaging Market Revenue (Million) Forecast, by Application 2019 & 2032
- Table 54: Rest of Asia Pacific Live Cell Imaging Market Revenue (Million) Forecast, by Application 2019 & 2032
- Table 55: Global Live Cell Imaging Market Revenue Million Forecast, by Product 2019 & 2032
- Table 56: Global Live Cell Imaging Market Revenue Million Forecast, by Application 2019 & 2032
- Table 57: Global Live Cell Imaging Market Revenue Million Forecast, by Country 2019 & 2032
- Table 58: GCC Live Cell Imaging Market Revenue (Million) Forecast, by Application 2019 & 2032
- Table 59: South Africa Live Cell Imaging Market Revenue (Million) Forecast, by Application 2019 & 2032
- Table 60: Rest of Middle East and Africa Live Cell Imaging Market Revenue (Million) Forecast, by Application 2019 & 2032
- Table 61: Global Live Cell Imaging Market Revenue Million Forecast, by Product 2019 & 2032
- Table 62: Global Live Cell Imaging Market Revenue Million Forecast, by Application 2019 & 2032
- Table 63: Global Live Cell Imaging Market Revenue Million Forecast, by Country 2019 & 2032
- Table 64: Brazil Live Cell Imaging Market Revenue (Million) Forecast, by Application 2019 & 2032
- Table 65: Argentina Live Cell Imaging Market Revenue (Million) Forecast, by Application 2019 & 2032
- Table 66: Rest of South America Live Cell Imaging Market Revenue (Million) Forecast, by Application 2019 & 2032
Frequently Asked Questions
1. What is the projected Compound Annual Growth Rate (CAGR) of the Live Cell Imaging Market?
The projected CAGR is approximately 7.06%.
2. Which companies are prominent players in the Live Cell Imaging Market?
Key companies in the market include Becton Dickinson and Company, Zeiss Group, LCI (Live Cell Instrument), Axion BioSystems Inc, Thermo Fisher Scientific Inc, Danaher (Leica Microsystems), Agilent Technologies Inc, Sartorius AG*List Not Exhaustive, Nikon Corporation Inc, Olympus Corporation (EVIDENT), Merck KGaA (Sigma- Aldrich Corporation), PerkinElmer Inc.
3. What are the main segments of the Live Cell Imaging Market?
The market segments include Product, Application.
4. Can you provide details about the market size?
The market size is estimated to be USD 2.25 Million as of 2022.
5. What are some drivers contributing to market growth?
Adoption of High-content Screening Techniques in Drug Discovery; Rising Prevalence of Chronic Disease Demanding Higher and Quicker Diagnostic Facilities; Government Funding for Cell-based Research.
6. What are the notable trends driving market growth?
Standalone Systems Segment is Expected to Hold a Significant Market Share Over the Forecast Period.
7. Are there any restraints impacting market growth?
High Cost of High-content Screening Systems; Shortage of Skilled Professionals.
8. Can you provide examples of recent developments in the market?
June 2023: Nanolive launched the 3D Cell Explorer 96focus, an innovative platform that brings unlimited high content analysis to label-free live cell imaging without the need for labeling. With the aid of AI-powered digital assays and an automated workflow, the 3D Cell Explorer 96focus streamlines the imaging process, offering researchers a cost-effective and reliable means of conducting cell imaging experiments.
9. What pricing options are available for accessing the report?
Pricing options include single-user, multi-user, and enterprise licenses priced at USD 4750, USD 5250, and USD 8750 respectively.
10. Is the market size provided in terms of value or volume?
The market size is provided in terms of value, measured in Million.
11. Are there any specific market keywords associated with the report?
Yes, the market keyword associated with the report is "Live Cell Imaging Market," which aids in identifying and referencing the specific market segment covered.
12. How do I determine which pricing option suits my needs best?
The pricing options vary based on user requirements and access needs. Individual users may opt for single-user licenses, while businesses requiring broader access may choose multi-user or enterprise licenses for cost-effective access to the report.
13. Are there any additional resources or data provided in the Live Cell Imaging Market report?
While the report offers comprehensive insights, it's advisable to review the specific contents or supplementary materials provided to ascertain if additional resources or data are available.
14. How can I stay updated on further developments or reports in the Live Cell Imaging Market?
To stay informed about further developments, trends, and reports in the Live Cell Imaging Market, consider subscribing to industry newsletters, following relevant companies and organizations, or regularly checking reputable industry news sources and publications.
Methodology
Step 1 - Identification of Relevant Samples Size from Population Database


Step 2 - Approaches for Defining Global Market Size (Value, Volume* & Price*)

Note*: In applicable scenarios
Step 3 - Data Sources
Primary Research
- Web Analytics
- Survey Reports
- Research Institute
- Latest Research Reports
- Opinion Leaders
Secondary Research
- Annual Reports
- White Paper
- Latest Press Release
- Industry Association
- Paid Database
- Investor Presentations

Step 4 - Data Triangulation
Involves using different sources of information in order to increase the validity of a study
These sources are likely to be stakeholders in a program - participants, other researchers, program staff, other community members, and so on.
Then we put all data in single framework & apply various statistical tools to find out the dynamic on the market.
During the analysis stage, feedback from the stakeholder groups would be compared to determine areas of agreement as well as areas of divergence


