
Key Insights
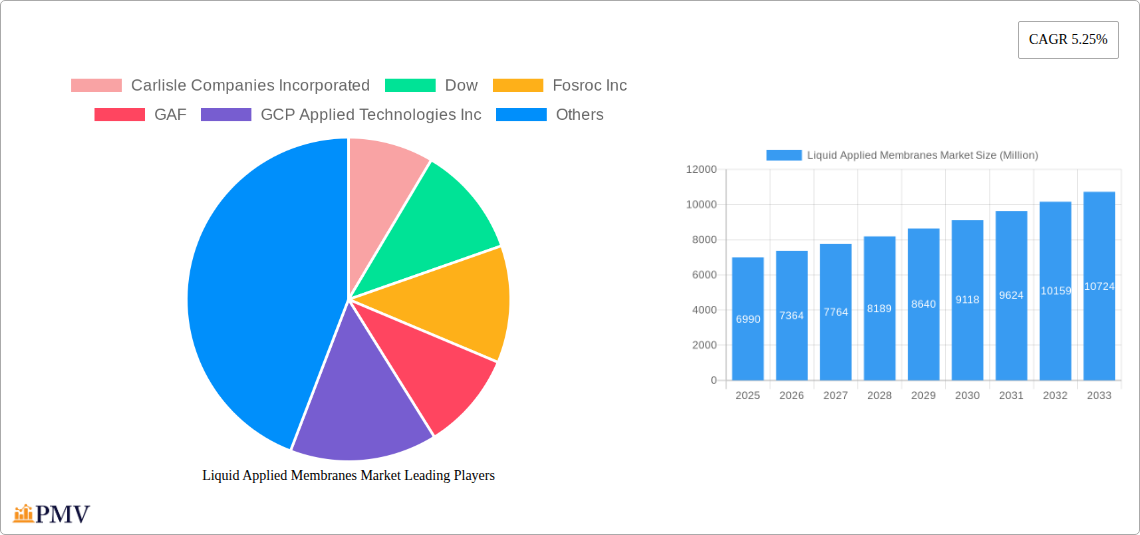
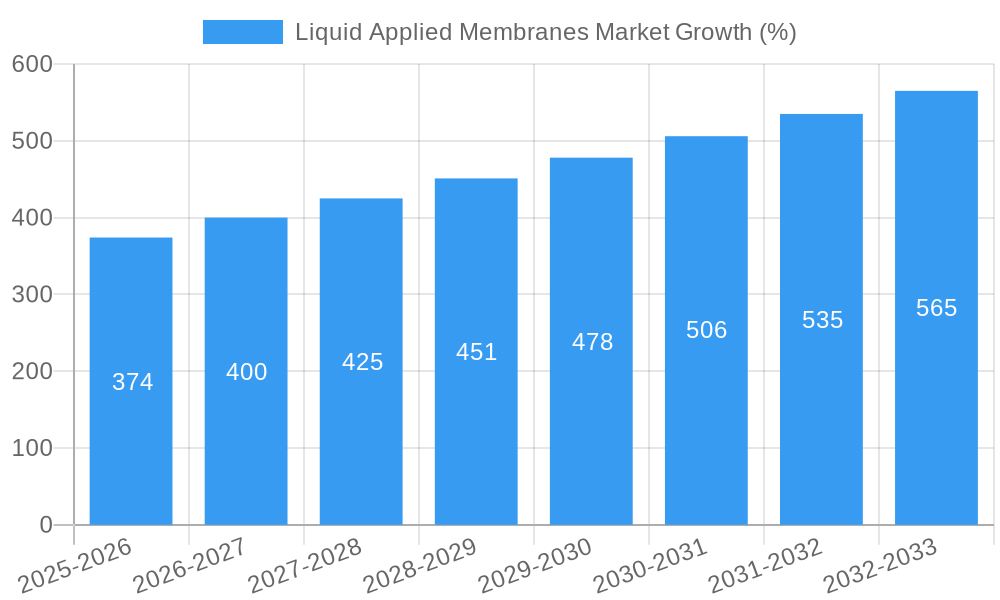
The global liquid applied membranes market is experiencing robust growth, projected to reach $6.99 billion in 2025 and maintain a Compound Annual Growth Rate (CAGR) of 5.25% from 2025 to 2033. This expansion is driven by several key factors. Increasing infrastructure development, particularly in emerging economies, fuels demand for durable and efficient waterproofing solutions. The rising adoption of sustainable building practices, emphasizing energy efficiency and reduced environmental impact, further bolsters market growth. Liquid applied membranes offer significant advantages in this context, providing seamless waterproofing, excellent adhesion to various substrates, and contributing to improved building energy performance. Furthermore, technological advancements leading to improved membrane formulations with enhanced durability, flexibility, and UV resistance are attracting increased adoption across diverse applications, including roofing, industrial flooring, and infrastructure projects. Key players like Carlisle Companies Incorporated, Dow, and Sika AG are driving innovation and expanding their product portfolios to cater to this growing demand, further fueling market competitiveness and growth.
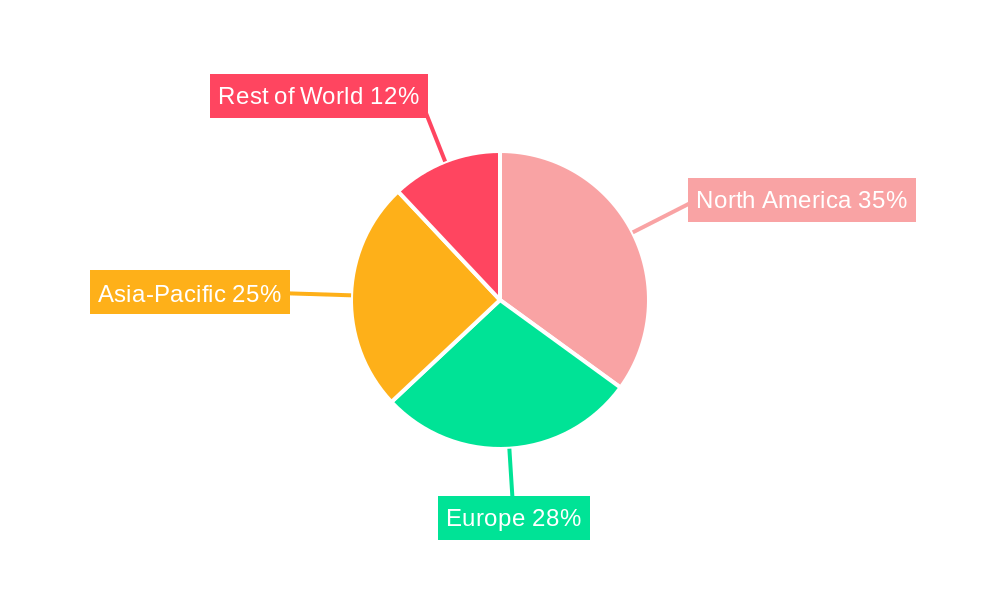
The market's segmentation reveals a diverse landscape with various applications influencing the overall market trajectory. While specific segment data is unavailable, we can infer that roofing and infrastructure segments likely represent significant shares based on industry trends. Regional variations in construction activity and regulatory landscapes also contribute to market dynamics. For example, North America and Europe are expected to hold considerable market share due to robust construction industries and stringent building codes, however, the Asia-Pacific region's rapid urbanization and industrialization are expected to drive substantial growth in the forecast period. Although challenges such as fluctuating raw material prices and potential supply chain disruptions may pose temporary restraints, the overall outlook for the liquid applied membranes market remains positive due to the long-term growth drivers mentioned above.
Liquid Applied Membranes Market: A Comprehensive Report (2019-2033)
This comprehensive report provides a detailed analysis of the global Liquid Applied Membranes Market, offering invaluable insights for industry stakeholders, investors, and researchers. The study period spans from 2019 to 2033, with 2025 serving as the base and estimated year. The report leverages extensive market research and data analysis to deliver actionable insights into market dynamics, competitive landscapes, and future growth potential. The market is projected to reach xx Million by 2033, exhibiting a CAGR of xx% during the forecast period (2025-2033).
Liquid Applied Membranes Market Market Structure & Competitive Dynamics
The Liquid Applied Membranes market exhibits a moderately concentrated structure, with several key players holding significant market share. The market is characterized by both intense competition and collaborative innovation. Key players actively engage in mergers and acquisitions (M&A) to expand their product portfolios and geographical reach. Recent M&A activity, such as Sika AG's acquisition of MBCC Group in May 2023, significantly reshaped the competitive landscape. This deal, valued at xx Million, exemplifies the strategic importance of inorganic growth in the sector. Regulatory frameworks, particularly those concerning environmental regulations and building codes, play a crucial role in shaping market dynamics. Product substitution, primarily from alternative waterproofing and roofing solutions, presents a moderate challenge to market growth. End-user trends, particularly the increasing demand for sustainable and high-performance building materials, are driving innovation and market expansion.
- Market Concentration: Moderately concentrated, with top 5 players holding approximately xx% of market share in 2024.
- Innovation Ecosystems: Strong emphasis on R&D resulting in continuous product improvement and the introduction of new, specialized membranes.
- Regulatory Frameworks: Stringent environmental regulations drive the development of eco-friendly liquid applied membranes.
- Product Substitutes: Competition from traditional roofing and waterproofing materials (e.g., asphalt, EPDM) exist but are gradually being replaced due to the superior performance of liquid applied membranes.
- End-User Trends: Growing demand for sustainable construction materials and high-performance buildings fuels the market's expansion.
- M&A Activity: Significant activity observed, with major players consolidating market share through acquisitions. The total value of M&A deals in the past five years exceeded xx Million.
Liquid Applied Membranes Market Industry Trends & Insights
The global Liquid Applied Membranes market is experiencing robust growth, driven by several key factors. The increasing demand for sustainable and energy-efficient buildings is a significant catalyst, as liquid applied membranes offer superior waterproofing and thermal insulation properties. The construction industry's ongoing expansion in both developed and developing economies is further fueling market demand. Technological advancements, particularly in the development of high-performance polymers and innovative application techniques, are enhancing the product's durability, versatility, and ease of application. Consumer preferences are shifting towards durable, long-lasting, and environmentally friendly building solutions, which aligns perfectly with the benefits offered by liquid applied membranes. Competitive dynamics are shaping the market with key players focusing on innovation, product differentiation, and strategic partnerships to gain a competitive edge. Market penetration in various regions is uneven, with developed markets exhibiting higher adoption rates compared to emerging economies.
Dominant Markets & Segments in Liquid Applied Membranes Market
The North American region currently dominates the Liquid Applied Membranes market, driven by robust construction activity, stringent building codes, and high demand for energy-efficient buildings. Significant infrastructure projects, particularly in the United States, are contributing to substantial market growth. The strong economic outlook and favorable regulatory environment in this region support the continued dominance of the North American market. Other regions, such as Europe and Asia-Pacific, are also witnessing notable growth, driven by increasing urbanization, infrastructure development, and government initiatives promoting sustainable construction practices.
- Key Drivers in North America:
- Strong construction activity and infrastructure investments.
- Stringent building codes and regulations promoting the use of high-performance membranes.
- High adoption rate of energy-efficient building technologies.
- Favorable economic conditions and consumer spending.
- Key Drivers in Europe:
- Increased focus on sustainable construction practices and environmental regulations.
- Growing adoption of green building technologies in the region.
- Expansion of infrastructure projects in several European countries.
- Key Drivers in Asia-Pacific:
- Rapid urbanization and increasing infrastructure development across several countries.
- Growing demand for affordable housing and resilient infrastructure in the region.
Liquid Applied Membranes Market Product Innovations
Recent product innovations focus on enhancing the durability, flexibility, and sustainability of liquid applied membranes. The development of advanced polymer formulations has resulted in membranes with improved resistance to UV degradation, chemical exposure, and extreme temperature variations. The introduction of self-healing technologies further enhances the lifespan and reduces maintenance requirements. New application methods, such as spray-applied systems, improve efficiency and reduce labor costs. These innovations cater to the increasing demand for high-performance, long-lasting, and environmentally friendly building solutions.
Report Segmentation & Scope
This report segments the Liquid Applied Membranes market based on several key factors, including:
- By Product Type: This includes various types of liquid applied membranes based on their chemical composition (e.g., acrylics, polyurethanes, bitumen-based) and performance characteristics. Growth projections for each segment vary, with high-performance, specialized membranes experiencing faster growth.
- By Application: This covers diverse applications across roofing, waterproofing, and other construction sectors (e.g., industrial, commercial, residential). Market size and competitive dynamics differ significantly across applications.
- By Region: Market segmentation by region (North America, Europe, Asia-Pacific, etc.) allows for a comprehensive analysis of regional variations in market size, growth, and competitive landscape.
Key Drivers of Liquid Applied Membranes Market Growth
The Liquid Applied Membranes market is experiencing strong growth due to several key drivers. Firstly, the rise of sustainable construction practices and the increasing demand for energy-efficient buildings are driving adoption. Stringent building codes and environmental regulations in many countries are also boosting market growth by mandating the use of high-performance, eco-friendly waterproofing solutions. Technological advancements have led to improved product features such as enhanced durability, UV resistance, and flexibility, all of which drive market demand. Furthermore, rapid urbanization and expanding infrastructure development in emerging economies are contributing significantly to market expansion.
Challenges in the Liquid Applied Membranes Market Sector
The Liquid Applied Membranes market faces several challenges. Fluctuations in raw material prices, particularly for polymers, can impact profitability. Supply chain disruptions and logistical issues can affect the timely delivery of products, especially during periods of high demand. Competition from alternative waterproofing solutions, such as traditional roofing materials and other advanced membranes, poses a challenge for market growth. Furthermore, stringent environmental regulations in some regions can necessitate costly compliance measures and limit market expansion opportunities. These challenges need to be addressed to ensure sustainable growth of the Liquid Applied Membranes market.
Leading Players in the Liquid Applied Membranes Market Market
- Carlisle Companies Incorporated
- Dow
- Fosroc Inc
- GAF
- GCP Applied Technologies Inc
- Henry Company
- Johns Manville (A Berkshire Hathaway Company)
- KEMPER SYSTEM Ltd
- MAPEI SpA
- SOPREMA INC
- Saint-Gobain Weber
- Sika AG
- *List Not Exhaustive
Key Developments in Liquid Applied Membranes Market Sector
- May 2023: Sika AG completed the acquisition of MBCC Group, a global supplier of construction chemicals. This acquisition significantly strengthened Sika's position in the liquid applied membranes market and expanded its product portfolio and global reach.
Strategic Liquid Applied Membranes Market Market Outlook
The Liquid Applied Membranes market is poised for continued growth, driven by the increasing demand for sustainable and high-performance building materials. The focus on energy efficiency, stricter building codes, and ongoing infrastructure development will further accelerate market expansion. Strategic opportunities exist for companies that can innovate in product development, optimize their supply chains, and adapt to changing market dynamics. Focus on eco-friendly formulations and sustainable manufacturing practices will enhance brand reputation and attract environmentally conscious customers. Investing in research and development to develop high-performance, specialized membranes will be crucial for gaining a competitive edge.
Liquid Applied Membranes Market Segmentation
-
1. Type
- 1.1. Polyurethane
- 1.2. Cementitious
- 1.3. Bituminous
- 1.4. Other Types
-
2. Application
- 2.1. Roofing
- 2.2. Walls
- 2.3. Underground and Tunnels
- 2.4. Other Applications
Liquid Applied Membranes Market Segmentation By Geography
-
1. Asia Pacific
- 1.1. China
- 1.2. India
- 1.3. Japan
- 1.4. South Korea
- 1.5. ASEAN Countries
- 1.6. Rest of Asia Pacific
-
2. North America
- 2.1. United States
- 2.2. Canada
- 2.3. Mexico
-
3. Europe
- 3.1. Germany
- 3.2. United Kingdom
- 3.3. Italy
- 3.4. France
- 3.5. Russia
- 3.6. Rest of Europe
-
4. South America
- 4.1. Brazil
- 4.2. Argentina
- 4.3. Rest of South America
-
5. Middle East and Africa
- 5.1. Saudi Arabia
- 5.2. South Africa
- 5.3. Rest of Middle East and Africa
Liquid Applied Membranes Market REPORT HIGHLIGHTS
| Aspects | Details |
|---|---|
| Study Period | 2019-2033 |
| Base Year | 2024 |
| Estimated Year | 2025 |
| Forecast Period | 2025-2033 |
| Historical Period | 2019-2024 |
| Growth Rate | CAGR of 5.25% from 2019-2033 |
| Segmentation |
|
Table of Contents
- 1. Introduction
- 1.1. Research Scope
- 1.2. Market Segmentation
- 1.3. Research Methodology
- 1.4. Definitions and Assumptions
- 2. Executive Summary
- 2.1. Introduction
- 3. Market Dynamics
- 3.1. Introduction
- 3.2. Market Drivers
- 3.2.1. Growing Usage of Waterproofing Membranes to Maintain Longevity of Buildings; Increasing Benefits of Liquid Applied Membranes Resulting in Cost-effective Construction; Growing Infrastructural and Commercial Projects in Emerging Economies
- 3.3. Market Restrains
- 3.3.1. Growing Usage of Waterproofing Membranes to Maintain Longevity of Buildings; Increasing Benefits of Liquid Applied Membranes Resulting in Cost-effective Construction; Growing Infrastructural and Commercial Projects in Emerging Economies
- 3.4. Market Trends
- 3.4.1. Roofing Application is Expected to Dominate the Market
- 4. Market Factor Analysis
- 4.1. Porters Five Forces
- 4.2. Supply/Value Chain
- 4.3. PESTEL analysis
- 4.4. Market Entropy
- 4.5. Patent/Trademark Analysis
- 5. Global Liquid Applied Membranes Market Analysis, Insights and Forecast, 2019-2031
- 5.1. Market Analysis, Insights and Forecast - by Type
- 5.1.1. Polyurethane
- 5.1.2. Cementitious
- 5.1.3. Bituminous
- 5.1.4. Other Types
- 5.2. Market Analysis, Insights and Forecast - by Application
- 5.2.1. Roofing
- 5.2.2. Walls
- 5.2.3. Underground and Tunnels
- 5.2.4. Other Applications
- 5.3. Market Analysis, Insights and Forecast - by Region
- 5.3.1. Asia Pacific
- 5.3.2. North America
- 5.3.3. Europe
- 5.3.4. South America
- 5.3.5. Middle East and Africa
- 5.1. Market Analysis, Insights and Forecast - by Type
- 6. Asia Pacific Liquid Applied Membranes Market Analysis, Insights and Forecast, 2019-2031
- 6.1. Market Analysis, Insights and Forecast - by Type
- 6.1.1. Polyurethane
- 6.1.2. Cementitious
- 6.1.3. Bituminous
- 6.1.4. Other Types
- 6.2. Market Analysis, Insights and Forecast - by Application
- 6.2.1. Roofing
- 6.2.2. Walls
- 6.2.3. Underground and Tunnels
- 6.2.4. Other Applications
- 6.1. Market Analysis, Insights and Forecast - by Type
- 7. North America Liquid Applied Membranes Market Analysis, Insights and Forecast, 2019-2031
- 7.1. Market Analysis, Insights and Forecast - by Type
- 7.1.1. Polyurethane
- 7.1.2. Cementitious
- 7.1.3. Bituminous
- 7.1.4. Other Types
- 7.2. Market Analysis, Insights and Forecast - by Application
- 7.2.1. Roofing
- 7.2.2. Walls
- 7.2.3. Underground and Tunnels
- 7.2.4. Other Applications
- 7.1. Market Analysis, Insights and Forecast - by Type
- 8. Europe Liquid Applied Membranes Market Analysis, Insights and Forecast, 2019-2031
- 8.1. Market Analysis, Insights and Forecast - by Type
- 8.1.1. Polyurethane
- 8.1.2. Cementitious
- 8.1.3. Bituminous
- 8.1.4. Other Types
- 8.2. Market Analysis, Insights and Forecast - by Application
- 8.2.1. Roofing
- 8.2.2. Walls
- 8.2.3. Underground and Tunnels
- 8.2.4. Other Applications
- 8.1. Market Analysis, Insights and Forecast - by Type
- 9. South America Liquid Applied Membranes Market Analysis, Insights and Forecast, 2019-2031
- 9.1. Market Analysis, Insights and Forecast - by Type
- 9.1.1. Polyurethane
- 9.1.2. Cementitious
- 9.1.3. Bituminous
- 9.1.4. Other Types
- 9.2. Market Analysis, Insights and Forecast - by Application
- 9.2.1. Roofing
- 9.2.2. Walls
- 9.2.3. Underground and Tunnels
- 9.2.4. Other Applications
- 9.1. Market Analysis, Insights and Forecast - by Type
- 10. Middle East and Africa Liquid Applied Membranes Market Analysis, Insights and Forecast, 2019-2031
- 10.1. Market Analysis, Insights and Forecast - by Type
- 10.1.1. Polyurethane
- 10.1.2. Cementitious
- 10.1.3. Bituminous
- 10.1.4. Other Types
- 10.2. Market Analysis, Insights and Forecast - by Application
- 10.2.1. Roofing
- 10.2.2. Walls
- 10.2.3. Underground and Tunnels
- 10.2.4. Other Applications
- 10.1. Market Analysis, Insights and Forecast - by Type
- 11. Competitive Analysis
- 11.1. Global Market Share Analysis 2024
- 11.2. Company Profiles
- 11.2.1 Carlisle Companies Incorporated
- 11.2.1.1. Overview
- 11.2.1.2. Products
- 11.2.1.3. SWOT Analysis
- 11.2.1.4. Recent Developments
- 11.2.1.5. Financials (Based on Availability)
- 11.2.2 Dow
- 11.2.2.1. Overview
- 11.2.2.2. Products
- 11.2.2.3. SWOT Analysis
- 11.2.2.4. Recent Developments
- 11.2.2.5. Financials (Based on Availability)
- 11.2.3 Fosroc Inc
- 11.2.3.1. Overview
- 11.2.3.2. Products
- 11.2.3.3. SWOT Analysis
- 11.2.3.4. Recent Developments
- 11.2.3.5. Financials (Based on Availability)
- 11.2.4 GAF
- 11.2.4.1. Overview
- 11.2.4.2. Products
- 11.2.4.3. SWOT Analysis
- 11.2.4.4. Recent Developments
- 11.2.4.5. Financials (Based on Availability)
- 11.2.5 GCP Applied Technologies Inc
- 11.2.5.1. Overview
- 11.2.5.2. Products
- 11.2.5.3. SWOT Analysis
- 11.2.5.4. Recent Developments
- 11.2.5.5. Financials (Based on Availability)
- 11.2.6 Henry Company
- 11.2.6.1. Overview
- 11.2.6.2. Products
- 11.2.6.3. SWOT Analysis
- 11.2.6.4. Recent Developments
- 11.2.6.5. Financials (Based on Availability)
- 11.2.7 Johns Manville (A Berkshire Hathaway Company)
- 11.2.7.1. Overview
- 11.2.7.2. Products
- 11.2.7.3. SWOT Analysis
- 11.2.7.4. Recent Developments
- 11.2.7.5. Financials (Based on Availability)
- 11.2.8 KEMPER SYSTEM Ltd
- 11.2.8.1. Overview
- 11.2.8.2. Products
- 11.2.8.3. SWOT Analysis
- 11.2.8.4. Recent Developments
- 11.2.8.5. Financials (Based on Availability)
- 11.2.9 MAPEI SpA
- 11.2.9.1. Overview
- 11.2.9.2. Products
- 11.2.9.3. SWOT Analysis
- 11.2.9.4. Recent Developments
- 11.2.9.5. Financials (Based on Availability)
- 11.2.10 SOPREMA INC
- 11.2.10.1. Overview
- 11.2.10.2. Products
- 11.2.10.3. SWOT Analysis
- 11.2.10.4. Recent Developments
- 11.2.10.5. Financials (Based on Availability)
- 11.2.11 Saint-Gobain Weber
- 11.2.11.1. Overview
- 11.2.11.2. Products
- 11.2.11.3. SWOT Analysis
- 11.2.11.4. Recent Developments
- 11.2.11.5. Financials (Based on Availability)
- 11.2.12 Sika AG*List Not Exhaustive
- 11.2.12.1. Overview
- 11.2.12.2. Products
- 11.2.12.3. SWOT Analysis
- 11.2.12.4. Recent Developments
- 11.2.12.5. Financials (Based on Availability)
- 11.2.1 Carlisle Companies Incorporated
List of Figures
- Figure 1: Global Liquid Applied Membranes Market Revenue Breakdown (Million, %) by Region 2024 & 2032
- Figure 2: Global Liquid Applied Membranes Market Volume Breakdown (Billion, %) by Region 2024 & 2032
- Figure 3: Asia Pacific Liquid Applied Membranes Market Revenue (Million), by Type 2024 & 2032
- Figure 4: Asia Pacific Liquid Applied Membranes Market Volume (Billion), by Type 2024 & 2032
- Figure 5: Asia Pacific Liquid Applied Membranes Market Revenue Share (%), by Type 2024 & 2032
- Figure 6: Asia Pacific Liquid Applied Membranes Market Volume Share (%), by Type 2024 & 2032
- Figure 7: Asia Pacific Liquid Applied Membranes Market Revenue (Million), by Application 2024 & 2032
- Figure 8: Asia Pacific Liquid Applied Membranes Market Volume (Billion), by Application 2024 & 2032
- Figure 9: Asia Pacific Liquid Applied Membranes Market Revenue Share (%), by Application 2024 & 2032
- Figure 10: Asia Pacific Liquid Applied Membranes Market Volume Share (%), by Application 2024 & 2032
- Figure 11: Asia Pacific Liquid Applied Membranes Market Revenue (Million), by Country 2024 & 2032
- Figure 12: Asia Pacific Liquid Applied Membranes Market Volume (Billion), by Country 2024 & 2032
- Figure 13: Asia Pacific Liquid Applied Membranes Market Revenue Share (%), by Country 2024 & 2032
- Figure 14: Asia Pacific Liquid Applied Membranes Market Volume Share (%), by Country 2024 & 2032
- Figure 15: North America Liquid Applied Membranes Market Revenue (Million), by Type 2024 & 2032
- Figure 16: North America Liquid Applied Membranes Market Volume (Billion), by Type 2024 & 2032
- Figure 17: North America Liquid Applied Membranes Market Revenue Share (%), by Type 2024 & 2032
- Figure 18: North America Liquid Applied Membranes Market Volume Share (%), by Type 2024 & 2032
- Figure 19: North America Liquid Applied Membranes Market Revenue (Million), by Application 2024 & 2032
- Figure 20: North America Liquid Applied Membranes Market Volume (Billion), by Application 2024 & 2032
- Figure 21: North America Liquid Applied Membranes Market Revenue Share (%), by Application 2024 & 2032
- Figure 22: North America Liquid Applied Membranes Market Volume Share (%), by Application 2024 & 2032
- Figure 23: North America Liquid Applied Membranes Market Revenue (Million), by Country 2024 & 2032
- Figure 24: North America Liquid Applied Membranes Market Volume (Billion), by Country 2024 & 2032
- Figure 25: North America Liquid Applied Membranes Market Revenue Share (%), by Country 2024 & 2032
- Figure 26: North America Liquid Applied Membranes Market Volume Share (%), by Country 2024 & 2032
- Figure 27: Europe Liquid Applied Membranes Market Revenue (Million), by Type 2024 & 2032
- Figure 28: Europe Liquid Applied Membranes Market Volume (Billion), by Type 2024 & 2032
- Figure 29: Europe Liquid Applied Membranes Market Revenue Share (%), by Type 2024 & 2032
- Figure 30: Europe Liquid Applied Membranes Market Volume Share (%), by Type 2024 & 2032
- Figure 31: Europe Liquid Applied Membranes Market Revenue (Million), by Application 2024 & 2032
- Figure 32: Europe Liquid Applied Membranes Market Volume (Billion), by Application 2024 & 2032
- Figure 33: Europe Liquid Applied Membranes Market Revenue Share (%), by Application 2024 & 2032
- Figure 34: Europe Liquid Applied Membranes Market Volume Share (%), by Application 2024 & 2032
- Figure 35: Europe Liquid Applied Membranes Market Revenue (Million), by Country 2024 & 2032
- Figure 36: Europe Liquid Applied Membranes Market Volume (Billion), by Country 2024 & 2032
- Figure 37: Europe Liquid Applied Membranes Market Revenue Share (%), by Country 2024 & 2032
- Figure 38: Europe Liquid Applied Membranes Market Volume Share (%), by Country 2024 & 2032
- Figure 39: South America Liquid Applied Membranes Market Revenue (Million), by Type 2024 & 2032
- Figure 40: South America Liquid Applied Membranes Market Volume (Billion), by Type 2024 & 2032
- Figure 41: South America Liquid Applied Membranes Market Revenue Share (%), by Type 2024 & 2032
- Figure 42: South America Liquid Applied Membranes Market Volume Share (%), by Type 2024 & 2032
- Figure 43: South America Liquid Applied Membranes Market Revenue (Million), by Application 2024 & 2032
- Figure 44: South America Liquid Applied Membranes Market Volume (Billion), by Application 2024 & 2032
- Figure 45: South America Liquid Applied Membranes Market Revenue Share (%), by Application 2024 & 2032
- Figure 46: South America Liquid Applied Membranes Market Volume Share (%), by Application 2024 & 2032
- Figure 47: South America Liquid Applied Membranes Market Revenue (Million), by Country 2024 & 2032
- Figure 48: South America Liquid Applied Membranes Market Volume (Billion), by Country 2024 & 2032
- Figure 49: South America Liquid Applied Membranes Market Revenue Share (%), by Country 2024 & 2032
- Figure 50: South America Liquid Applied Membranes Market Volume Share (%), by Country 2024 & 2032
- Figure 51: Middle East and Africa Liquid Applied Membranes Market Revenue (Million), by Type 2024 & 2032
- Figure 52: Middle East and Africa Liquid Applied Membranes Market Volume (Billion), by Type 2024 & 2032
- Figure 53: Middle East and Africa Liquid Applied Membranes Market Revenue Share (%), by Type 2024 & 2032
- Figure 54: Middle East and Africa Liquid Applied Membranes Market Volume Share (%), by Type 2024 & 2032
- Figure 55: Middle East and Africa Liquid Applied Membranes Market Revenue (Million), by Application 2024 & 2032
- Figure 56: Middle East and Africa Liquid Applied Membranes Market Volume (Billion), by Application 2024 & 2032
- Figure 57: Middle East and Africa Liquid Applied Membranes Market Revenue Share (%), by Application 2024 & 2032
- Figure 58: Middle East and Africa Liquid Applied Membranes Market Volume Share (%), by Application 2024 & 2032
- Figure 59: Middle East and Africa Liquid Applied Membranes Market Revenue (Million), by Country 2024 & 2032
- Figure 60: Middle East and Africa Liquid Applied Membranes Market Volume (Billion), by Country 2024 & 2032
- Figure 61: Middle East and Africa Liquid Applied Membranes Market Revenue Share (%), by Country 2024 & 2032
- Figure 62: Middle East and Africa Liquid Applied Membranes Market Volume Share (%), by Country 2024 & 2032
List of Tables
- Table 1: Global Liquid Applied Membranes Market Revenue Million Forecast, by Region 2019 & 2032
- Table 2: Global Liquid Applied Membranes Market Volume Billion Forecast, by Region 2019 & 2032
- Table 3: Global Liquid Applied Membranes Market Revenue Million Forecast, by Type 2019 & 2032
- Table 4: Global Liquid Applied Membranes Market Volume Billion Forecast, by Type 2019 & 2032
- Table 5: Global Liquid Applied Membranes Market Revenue Million Forecast, by Application 2019 & 2032
- Table 6: Global Liquid Applied Membranes Market Volume Billion Forecast, by Application 2019 & 2032
- Table 7: Global Liquid Applied Membranes Market Revenue Million Forecast, by Region 2019 & 2032
- Table 8: Global Liquid Applied Membranes Market Volume Billion Forecast, by Region 2019 & 2032
- Table 9: Global Liquid Applied Membranes Market Revenue Million Forecast, by Type 2019 & 2032
- Table 10: Global Liquid Applied Membranes Market Volume Billion Forecast, by Type 2019 & 2032
- Table 11: Global Liquid Applied Membranes Market Revenue Million Forecast, by Application 2019 & 2032
- Table 12: Global Liquid Applied Membranes Market Volume Billion Forecast, by Application 2019 & 2032
- Table 13: Global Liquid Applied Membranes Market Revenue Million Forecast, by Country 2019 & 2032
- Table 14: Global Liquid Applied Membranes Market Volume Billion Forecast, by Country 2019 & 2032
- Table 15: China Liquid Applied Membranes Market Revenue (Million) Forecast, by Application 2019 & 2032
- Table 16: China Liquid Applied Membranes Market Volume (Billion) Forecast, by Application 2019 & 2032
- Table 17: India Liquid Applied Membranes Market Revenue (Million) Forecast, by Application 2019 & 2032
- Table 18: India Liquid Applied Membranes Market Volume (Billion) Forecast, by Application 2019 & 2032
- Table 19: Japan Liquid Applied Membranes Market Revenue (Million) Forecast, by Application 2019 & 2032
- Table 20: Japan Liquid Applied Membranes Market Volume (Billion) Forecast, by Application 2019 & 2032
- Table 21: South Korea Liquid Applied Membranes Market Revenue (Million) Forecast, by Application 2019 & 2032
- Table 22: South Korea Liquid Applied Membranes Market Volume (Billion) Forecast, by Application 2019 & 2032
- Table 23: ASEAN Countries Liquid Applied Membranes Market Revenue (Million) Forecast, by Application 2019 & 2032
- Table 24: ASEAN Countries Liquid Applied Membranes Market Volume (Billion) Forecast, by Application 2019 & 2032
- Table 25: Rest of Asia Pacific Liquid Applied Membranes Market Revenue (Million) Forecast, by Application 2019 & 2032
- Table 26: Rest of Asia Pacific Liquid Applied Membranes Market Volume (Billion) Forecast, by Application 2019 & 2032
- Table 27: Global Liquid Applied Membranes Market Revenue Million Forecast, by Type 2019 & 2032
- Table 28: Global Liquid Applied Membranes Market Volume Billion Forecast, by Type 2019 & 2032
- Table 29: Global Liquid Applied Membranes Market Revenue Million Forecast, by Application 2019 & 2032
- Table 30: Global Liquid Applied Membranes Market Volume Billion Forecast, by Application 2019 & 2032
- Table 31: Global Liquid Applied Membranes Market Revenue Million Forecast, by Country 2019 & 2032
- Table 32: Global Liquid Applied Membranes Market Volume Billion Forecast, by Country 2019 & 2032
- Table 33: United States Liquid Applied Membranes Market Revenue (Million) Forecast, by Application 2019 & 2032
- Table 34: United States Liquid Applied Membranes Market Volume (Billion) Forecast, by Application 2019 & 2032
- Table 35: Canada Liquid Applied Membranes Market Revenue (Million) Forecast, by Application 2019 & 2032
- Table 36: Canada Liquid Applied Membranes Market Volume (Billion) Forecast, by Application 2019 & 2032
- Table 37: Mexico Liquid Applied Membranes Market Revenue (Million) Forecast, by Application 2019 & 2032
- Table 38: Mexico Liquid Applied Membranes Market Volume (Billion) Forecast, by Application 2019 & 2032
- Table 39: Global Liquid Applied Membranes Market Revenue Million Forecast, by Type 2019 & 2032
- Table 40: Global Liquid Applied Membranes Market Volume Billion Forecast, by Type 2019 & 2032
- Table 41: Global Liquid Applied Membranes Market Revenue Million Forecast, by Application 2019 & 2032
- Table 42: Global Liquid Applied Membranes Market Volume Billion Forecast, by Application 2019 & 2032
- Table 43: Global Liquid Applied Membranes Market Revenue Million Forecast, by Country 2019 & 2032
- Table 44: Global Liquid Applied Membranes Market Volume Billion Forecast, by Country 2019 & 2032
- Table 45: Germany Liquid Applied Membranes Market Revenue (Million) Forecast, by Application 2019 & 2032
- Table 46: Germany Liquid Applied Membranes Market Volume (Billion) Forecast, by Application 2019 & 2032
- Table 47: United Kingdom Liquid Applied Membranes Market Revenue (Million) Forecast, by Application 2019 & 2032
- Table 48: United Kingdom Liquid Applied Membranes Market Volume (Billion) Forecast, by Application 2019 & 2032
- Table 49: Italy Liquid Applied Membranes Market Revenue (Million) Forecast, by Application 2019 & 2032
- Table 50: Italy Liquid Applied Membranes Market Volume (Billion) Forecast, by Application 2019 & 2032
- Table 51: France Liquid Applied Membranes Market Revenue (Million) Forecast, by Application 2019 & 2032
- Table 52: France Liquid Applied Membranes Market Volume (Billion) Forecast, by Application 2019 & 2032
- Table 53: Russia Liquid Applied Membranes Market Revenue (Million) Forecast, by Application 2019 & 2032
- Table 54: Russia Liquid Applied Membranes Market Volume (Billion) Forecast, by Application 2019 & 2032
- Table 55: Rest of Europe Liquid Applied Membranes Market Revenue (Million) Forecast, by Application 2019 & 2032
- Table 56: Rest of Europe Liquid Applied Membranes Market Volume (Billion) Forecast, by Application 2019 & 2032
- Table 57: Global Liquid Applied Membranes Market Revenue Million Forecast, by Type 2019 & 2032
- Table 58: Global Liquid Applied Membranes Market Volume Billion Forecast, by Type 2019 & 2032
- Table 59: Global Liquid Applied Membranes Market Revenue Million Forecast, by Application 2019 & 2032
- Table 60: Global Liquid Applied Membranes Market Volume Billion Forecast, by Application 2019 & 2032
- Table 61: Global Liquid Applied Membranes Market Revenue Million Forecast, by Country 2019 & 2032
- Table 62: Global Liquid Applied Membranes Market Volume Billion Forecast, by Country 2019 & 2032
- Table 63: Brazil Liquid Applied Membranes Market Revenue (Million) Forecast, by Application 2019 & 2032
- Table 64: Brazil Liquid Applied Membranes Market Volume (Billion) Forecast, by Application 2019 & 2032
- Table 65: Argentina Liquid Applied Membranes Market Revenue (Million) Forecast, by Application 2019 & 2032
- Table 66: Argentina Liquid Applied Membranes Market Volume (Billion) Forecast, by Application 2019 & 2032
- Table 67: Rest of South America Liquid Applied Membranes Market Revenue (Million) Forecast, by Application 2019 & 2032
- Table 68: Rest of South America Liquid Applied Membranes Market Volume (Billion) Forecast, by Application 2019 & 2032
- Table 69: Global Liquid Applied Membranes Market Revenue Million Forecast, by Type 2019 & 2032
- Table 70: Global Liquid Applied Membranes Market Volume Billion Forecast, by Type 2019 & 2032
- Table 71: Global Liquid Applied Membranes Market Revenue Million Forecast, by Application 2019 & 2032
- Table 72: Global Liquid Applied Membranes Market Volume Billion Forecast, by Application 2019 & 2032
- Table 73: Global Liquid Applied Membranes Market Revenue Million Forecast, by Country 2019 & 2032
- Table 74: Global Liquid Applied Membranes Market Volume Billion Forecast, by Country 2019 & 2032
- Table 75: Saudi Arabia Liquid Applied Membranes Market Revenue (Million) Forecast, by Application 2019 & 2032
- Table 76: Saudi Arabia Liquid Applied Membranes Market Volume (Billion) Forecast, by Application 2019 & 2032
- Table 77: South Africa Liquid Applied Membranes Market Revenue (Million) Forecast, by Application 2019 & 2032
- Table 78: South Africa Liquid Applied Membranes Market Volume (Billion) Forecast, by Application 2019 & 2032
- Table 79: Rest of Middle East and Africa Liquid Applied Membranes Market Revenue (Million) Forecast, by Application 2019 & 2032
- Table 80: Rest of Middle East and Africa Liquid Applied Membranes Market Volume (Billion) Forecast, by Application 2019 & 2032
Frequently Asked Questions
1. What is the projected Compound Annual Growth Rate (CAGR) of the Liquid Applied Membranes Market?
The projected CAGR is approximately 5.25%.
2. Which companies are prominent players in the Liquid Applied Membranes Market?
Key companies in the market include Carlisle Companies Incorporated, Dow, Fosroc Inc, GAF, GCP Applied Technologies Inc, Henry Company, Johns Manville (A Berkshire Hathaway Company), KEMPER SYSTEM Ltd, MAPEI SpA, SOPREMA INC, Saint-Gobain Weber, Sika AG*List Not Exhaustive.
3. What are the main segments of the Liquid Applied Membranes Market?
The market segments include Type, Application.
4. Can you provide details about the market size?
The market size is estimated to be USD 6.99 Million as of 2022.
5. What are some drivers contributing to market growth?
Growing Usage of Waterproofing Membranes to Maintain Longevity of Buildings; Increasing Benefits of Liquid Applied Membranes Resulting in Cost-effective Construction; Growing Infrastructural and Commercial Projects in Emerging Economies.
6. What are the notable trends driving market growth?
Roofing Application is Expected to Dominate the Market.
7. Are there any restraints impacting market growth?
Growing Usage of Waterproofing Membranes to Maintain Longevity of Buildings; Increasing Benefits of Liquid Applied Membranes Resulting in Cost-effective Construction; Growing Infrastructural and Commercial Projects in Emerging Economies.
8. Can you provide examples of recent developments in the market?
May 2023: Sika AG completed the acquisition of MBCC Group. MBCC Group is a global supplier of construction chemicals.
9. What pricing options are available for accessing the report?
Pricing options include single-user, multi-user, and enterprise licenses priced at USD 4750, USD 5250, and USD 8750 respectively.
10. Is the market size provided in terms of value or volume?
The market size is provided in terms of value, measured in Million and volume, measured in Billion.
11. Are there any specific market keywords associated with the report?
Yes, the market keyword associated with the report is "Liquid Applied Membranes Market," which aids in identifying and referencing the specific market segment covered.
12. How do I determine which pricing option suits my needs best?
The pricing options vary based on user requirements and access needs. Individual users may opt for single-user licenses, while businesses requiring broader access may choose multi-user or enterprise licenses for cost-effective access to the report.
13. Are there any additional resources or data provided in the Liquid Applied Membranes Market report?
While the report offers comprehensive insights, it's advisable to review the specific contents or supplementary materials provided to ascertain if additional resources or data are available.
14. How can I stay updated on further developments or reports in the Liquid Applied Membranes Market?
To stay informed about further developments, trends, and reports in the Liquid Applied Membranes Market, consider subscribing to industry newsletters, following relevant companies and organizations, or regularly checking reputable industry news sources and publications.
Methodology
Step 1 - Identification of Relevant Samples Size from Population Database


Step 2 - Approaches for Defining Global Market Size (Value, Volume* & Price*)

Note*: In applicable scenarios
Step 3 - Data Sources
Primary Research
- Web Analytics
- Survey Reports
- Research Institute
- Latest Research Reports
- Opinion Leaders
Secondary Research
- Annual Reports
- White Paper
- Latest Press Release
- Industry Association
- Paid Database
- Investor Presentations

Step 4 - Data Triangulation
Involves using different sources of information in order to increase the validity of a study
These sources are likely to be stakeholders in a program - participants, other researchers, program staff, other community members, and so on.
Then we put all data in single framework & apply various statistical tools to find out the dynamic on the market.
During the analysis stage, feedback from the stakeholder groups would be compared to determine areas of agreement as well as areas of divergence


