

Key Insights
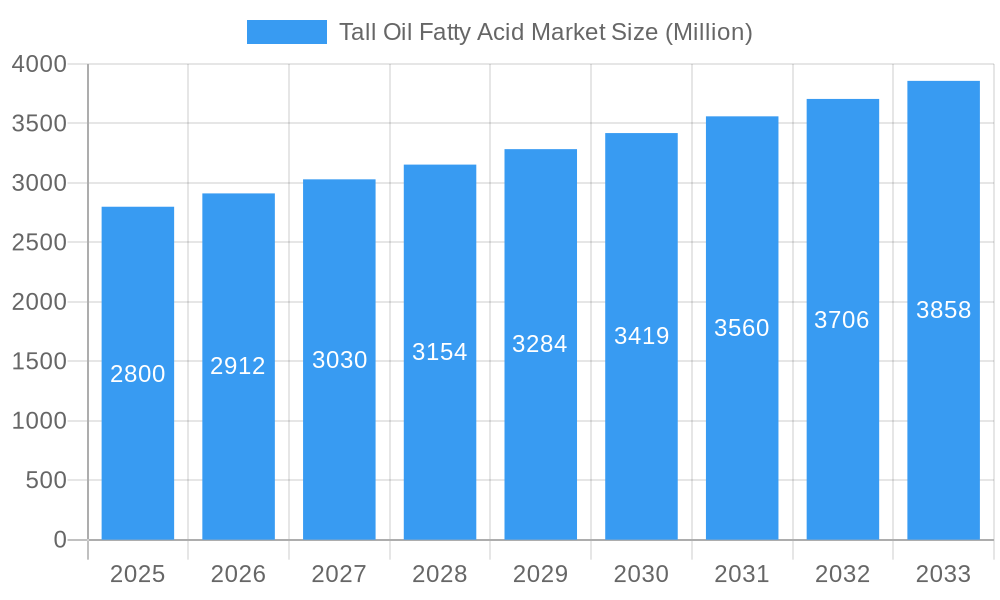
The global Tall Oil Fatty Acid (TOFA) market is set for substantial growth, projected to reach a market size of 4.82 million by 2025, with a Compound Annual Growth Rate (CAGR) of 4.66% from the base year 2025 through 2033. This expansion is driven by increasing demand for sustainable, bio-based chemicals. Key applications fueling this growth include alkyd resins for paints and coatings, dimeric acids for adhesives and lubricants, fatty acid esters, and soaps and detergents. The automotive and metalworking fluids sectors are also showing increased adoption due to TOFA's performance and environmental benefits.
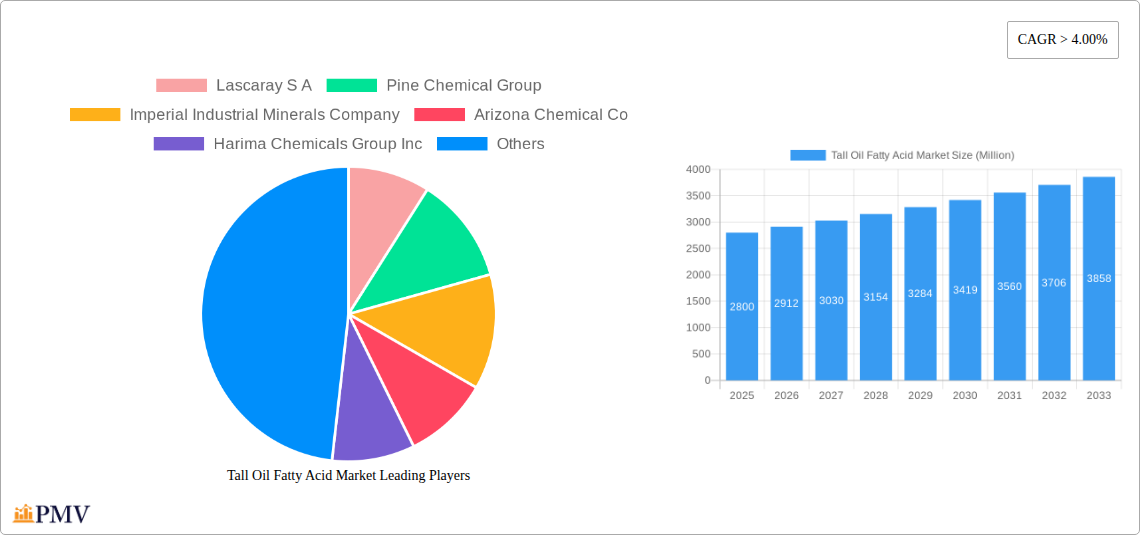
Tall Oil Fatty Acid Market Market Size (In Million)
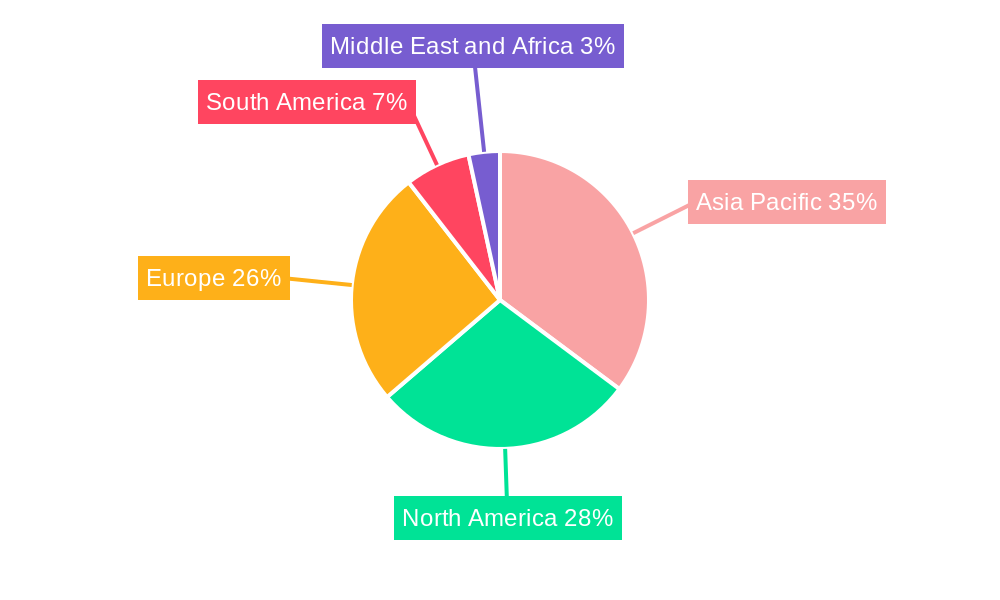
Emerging trends, such as novel TOFA applications and technological advancements in extraction and refining, are further shaping market trajectory. The preference for renewable feedstocks over petrochemical alternatives creates a favorable landscape. Potential restraints include fluctuations in crude tall oil supply and competition from alternative bio-based fatty acids. Strategic partnerships and R&D investments by key players like Eastman Chemical Company, Ingevity, and Harima Chemicals Group Inc. are expected to foster innovation. The Asia Pacific region is anticipated to become a leading market for TOFA.
Tall Oil Fatty Acid Market Company Market Share
Tall Oil Fatty Acid Market: Comprehensive Analysis & Future Outlook (2019-2033)
This in-depth report provides a detailed analysis of the global Tall Oil Fatty Acid (TOFA) market, offering critical insights into market dynamics, growth drivers, challenges, and future opportunities. Covering the study period of 2019–2033, with a base year and estimated year of 2025, and a forecast period of 2025–2033, this report leverages historical data from 2019–2024 to deliver an unparalleled understanding of this vital bio-based chemical sector. We explore oleic acid, linoleic acid, linolenic acid, palmitic acid, and other product types, alongside applications in alkyd resins, dimer acids, fatty acid esters, and other applications. The report also examines key end-user industries including soaps and detergents, paints and coatings, automotive, metal working fluids, and oil and gas.
Tall Oil Fatty Acid Market Market Structure & Competitive Dynamics
The Tall Oil Fatty Acid (TOFA) market exhibits a moderate to high level of concentration, with key players like KRATON CORPORATION, Eastman Chemical Company, and Ingevity holding significant market shares. The innovation ecosystem is driven by ongoing research into novel applications and more sustainable production methods, aiming to enhance product performance and reduce environmental impact. Regulatory frameworks, particularly concerning sustainability and chemical usage, are evolving and influence market access and product development. Product substitutes, such as petroleum-derived fatty acids and other bio-based alternatives, pose a competitive threat, necessitating continuous improvement in TOFA's cost-effectiveness and performance. End-user trends are leaning towards green chemistry and bio-based materials, creating substantial growth opportunities for TOFA. Mergers and acquisitions (M&A) activities, including past deals with values in the range of tens to hundreds of millions of dollars, are shaping the competitive landscape by consolidating market presence and expanding technological capabilities. For instance, the acquisition of Arizona Chemical by Kraton Corporation in 2016 for approximately $1.7 billion significantly altered market dynamics. Future M&A is anticipated to focus on companies with advanced TOFA processing technologies and diversified application portfolios, further consolidating the market and potentially leading to greater market share consolidation among the top 5-7 players.
Tall Oil Fatty Acid Market Industry Trends & Insights
The Tall Oil Fatty Acid (TOFA) market is experiencing robust growth, projected to achieve a Compound Annual Growth Rate (CAGR) of approximately 5.5% from 2025 to 2033. This expansion is fueled by a confluence of factors, including the escalating demand for sustainable and bio-based chemicals across diverse industries and increasing consumer preference for eco-friendly products. The inherent properties of TOFA, such as its biodegradability and renewable origin, position it as a compelling alternative to petroleum-based chemicals, especially within the paints and coatings, soaps and detergents, and automotive sectors. Technological advancements in refining and fractionation processes are enabling the production of higher-purity TOFA grades, expanding its applicability in specialized formulations. Furthermore, the growing emphasis on circular economy principles and waste valorization within the pulp and paper industry, a primary source of crude tall oil, ensures a stable and increasingly sustainable supply chain. Market penetration is particularly strong in regions with advanced chemical manufacturing infrastructure and stringent environmental regulations. The development of innovative applications, such as bio-lubricants and advanced polymer additives, is further diversifying the market and driving demand. The global market size for TOFA is estimated to reach over $5,000 million by 2025, driven by these positive trends and proactive industry strategies.
Dominant Markets & Segments in Tall Oil Fatty Acid Market
The Tall Oil Fatty Acid (TOFA) market is characterized by regional dominance and segment-specific growth.
Dominant Region: North America and Europe currently lead the global TOFA market, driven by established pulp and paper industries, stringent environmental regulations promoting bio-based products, and a strong presence of key TOFA manufacturers and end-users. For instance, the North American market is projected to account for nearly 35% of the global market share by 2025, with a market value estimated at over $1,750 million.
Dominant Product Type: Oleic Acid is the most dominant product type within the TOFA market, owing to its versatile applications and favorable chemical properties. It is a key component in alkyd resins, soaps, and lubricants. The market for oleic acid derived from TOFA is estimated to be over $2,000 million by 2025, representing approximately 40% of the total TOFA market.
Dominant Application: Alkyd Resins represent the largest application segment for TOFA. These resins are widely used in the production of paints, varnishes, and coatings, driven by their durability, gloss, and cost-effectiveness. The alkyd resins segment is projected to reach a market value of over $1,500 million by 2025.
Dominant End-user Industry: The Paints and Coatings industry is the leading end-user sector for TOFA. The increasing demand for eco-friendly and low-VOC (Volatile Organic Compound) coatings fuels the use of TOFA-based alkyd resins. This sector is estimated to contribute over $1,800 million to the TOFA market by 2025.
Key drivers for dominance in these segments include:
- Economic Policies: Government incentives and subsidies promoting the use of bio-based materials and sustainable manufacturing practices.
- Infrastructure: Well-developed chemical processing infrastructure and robust supply chains for pulp and paper by-products.
- Consumer Preferences: Growing consumer awareness and demand for green products, influencing purchasing decisions across various end-user industries.
- Technological Advancements: Continuous innovation in TOFA extraction, purification, and application development, leading to improved product performance and wider market acceptance.
Tall Oil Fatty Acid Market Product Innovations
Product innovation in the Tall Oil Fatty Acid (TOFA) market centers on enhancing purity, developing novel derivatives, and expanding applications. Companies are focusing on producing high-purity oleic acid and linoleic acid for specialized uses in pharmaceuticals and cosmetics, alongside the development of advanced dimer acids with superior thermal stability for high-performance lubricants and adhesives. These innovations offer competitive advantages by meeting stringent industry requirements and addressing emerging market needs for sustainable and high-performance materials. Technological advancements in fractionation and chemical modification are key to achieving these product developments.
Report Segmentation & Scope
This report segments the Tall Oil Fatty Acid (TOFA) market by key categories to provide granular analysis.
Product Type: The market is segmented into Oleic Acid, Linoleic Acid, Linolenic Acid, Palmitic Acid, and Other Product Types. Oleic acid and linoleic acid are expected to dominate, with significant growth driven by their widespread industrial applications. Growth projections for these segments are robust, with oleic acid anticipated to grow at a CAGR of approximately 5.8% and linoleic acid at 5.5% through 2033.
Application: Key applications include Alkyd Resins, Dimer Acids, Fatty Acid Ester, and Other Applications. The Alkyd Resins segment is projected to remain the largest application, with steady growth driven by the paints and coatings industry. Fatty acid esters are also a rapidly expanding segment due to their use in lubricants and plasticizers.
End-user Industry: The report analyzes the market across Soaps and Detergents, Paints and Coatings, Automotive, Metal Working Fluids, Oil and Gas, and Other End-user Industries. The Paints and Coatings sector is expected to lead in market size and growth, followed by soaps and detergents. Emerging applications in automotive lubricants and specialized oilfield chemicals are also contributing to segment expansion.
Key Drivers of Tall Oil Fatty Acid Market Growth
The Tall Oil Fatty Acid (TOFA) market is propelled by several key drivers. The increasing global focus on sustainability and the circular economy is a primary catalyst, promoting the adoption of bio-based alternatives like TOFA over petroleum-derived products. Advancements in pulp and paper manufacturing processes enhance the yield and quality of crude tall oil, ensuring a consistent and cost-effective feedstock. Furthermore, the growing demand from key end-user industries such as paints and coatings, soaps and detergents, and lubricants for high-performance, eco-friendly ingredients directly fuels market expansion. Favorable government policies and regulations promoting the use of renewable resources also play a significant role. For instance, initiatives encouraging bio-based content in industrial products are creating new market opportunities, with an estimated market size of over $5,000 million in 2025.
Challenges in the Tall Oil Fatty Acid Market Sector
Despite its growth, the Tall Oil Fatty Acid (TOFA) market faces several challenges. Fluctuations in the price and availability of crude tall oil, influenced by the pulp and paper industry's output and global demand, can impact production costs and market stability. Competition from other bio-based fatty acids and petrochemical alternatives remains a significant hurdle, necessitating continuous innovation to maintain price competitiveness and product performance. Stringent quality control and standardization for certain specialized applications can also pose a challenge. Moreover, the energy-intensive nature of refining processes can contribute to higher operational costs. Supply chain complexities and logistical challenges in transporting crude tall oil from diverse geographical sources add to market constraints.
Leading Players in the Tall Oil Fatty Acid Market Market
- Lascaray S A
- Pine Chemical Group
- Imperial Industrial Minerals Company
- Arizona Chemical Co
- Harima Chemicals Group Inc
- Eastman Chemical Company
- Ingevity
- Segezha-Group
- Forchem Oyj
- Ilim Group
- KRATON CORPORATION
- UNIVAR SOLUTIONS
- Shaxian Lixin Resin Co Ltd
- Foreverest Resources Ltd
- Pasand Speciality Chemicals
- Ataman Kimya
- G C Rutteman & Co B V
Key Developments in Tall Oil Fatty Acid Market Sector
- 2023: Ingevity announced expanded production capacity for bio-based chemicals, including TOFA derivatives, to meet growing demand.
- 2022: Eastman Chemical Company launched a new line of sustainable ester-based plasticizers derived from TOFA, targeting the PVC and coatings industries.
- 2022: Kraton Corporation continued its integration of Arizona Chemical, optimizing its TOFA-based product portfolio and supply chain efficiency.
- 2021: Harima Chemicals Group Inc. invested in advanced refining technologies to produce higher-purity TOFA for specialized adhesive applications.
- 2020: Segezha-Group increased its crude tall oil extraction capabilities to support its growing TOFA production, aiming for a significant market share expansion.
Strategic Tall Oil Fatty Acid Market Market Outlook
The strategic outlook for the Tall Oil Fatty Acid (TOFA) market is highly positive, driven by the escalating global imperative for sustainable chemical solutions. Growth accelerators include the continued expansion of bio-based alkyd resins in the paints and coatings sector, the increasing use of TOFA derivatives in bio-lubricants and greases for the automotive and industrial machinery sectors, and the growing niche applications in personal care and pharmaceutical formulations. Opportunities lie in developing advanced fractionation techniques to produce tailor-made TOFA grades and exploring novel applications in areas like bioplastics and renewable energy. Strategic collaborations between TOFA producers and end-users will be crucial for co-developing innovative solutions and securing market penetration. The market is expected to witness sustained growth, with an estimated market size exceeding $7,000 million by 2033.
Tall Oil Fatty Acid Market Segmentation
-
1. Product Type
- 1.1. Oleic Acid
- 1.2. Linoleic Acid
- 1.3. Linolenic Acid
- 1.4. Palmitic Acid
- 1.5. Other Product Types
-
2. Application
- 2.1. Alkyd Resins
- 2.2. Dimer Acids
- 2.3. Fatty Acid Ester
- 2.4. Other Applications
-
3. End-user Industry
- 3.1. Soaps and Detergents
- 3.2. Paints and Coatings
- 3.3. Automotive
- 3.4. Metal Working Fluids
- 3.5. Oil and Gas
- 3.6. Other End-user Industries
Tall Oil Fatty Acid Market Segmentation By Geography
-
1. Asia Pacific
- 1.1. China
- 1.2. India
- 1.3. Japan
- 1.4. South Korea
- 1.5. Rest of Asia Pacific
-
2. North America
- 2.1. United States
- 2.2. Canada
- 2.3. Mexico
-
3. Europe
- 3.1. Germany
- 3.2. United Kingdom
- 3.3. Italy
- 3.4. France
- 3.5. Rest of Europe
-
4. South America
- 4.1. Brazil
- 4.2. Argentina
- 4.3. Rest of South America
-
5. Middle East and Africa
- 5.1. Saudi Arabia
- 5.2. South Africa
- 5.3. Rest of Middle East and Africa
Tall Oil Fatty Acid Market Regional Market Share
Geographic Coverage of Tall Oil Fatty Acid Market
Tall Oil Fatty Acid Market REPORT HIGHLIGHTS
| Aspects | Details |
|---|---|
| Study Period | 2020-2034 |
| Base Year | 2025 |
| Estimated Year | 2026 |
| Forecast Period | 2026-2034 |
| Historical Period | 2020-2025 |
| Growth Rate | CAGR of 4.66% from 2020-2034 |
| Segmentation |
|
Table of Contents
- 1. Introduction
- 1.1. Research Scope
- 1.2. Market Segmentation
- 1.3. Research Objective
- 1.4. Definitions and Assumptions
- 2. Executive Summary
- 2.1. Market Snapshot
- 3. Market Dynamics
- 3.1. Market Drivers
- 3.2. Market Restrains
- 3.3. Market Trends
- 3.4. Market Opportunities
- 4. Market Factor Analysis
- 4.1. Porters Five Forces
- 4.1.1. Bargaining Power of Suppliers
- 4.1.2. Bargaining Power of Buyers
- 4.1.3. Threat of New Entrants
- 4.1.4. Threat of Substitutes
- 4.1.5. Competitive Rivalry
- 4.2. PESTEL analysis
- 4.3. BCG Analysis
- 4.3.1. Stars (High Growth, High Market Share)
- 4.3.2. Cash Cows (Low Growth, High Market Share)
- 4.3.3. Question Mark (High Growth, Low Market Share)
- 4.3.4. Dogs (Low Growth, Low Market Share)
- 4.4. Ansoff Matrix Analysis
- 4.5. Supply Chain Analysis
- 4.6. Regulatory Landscape
- 4.7. Current Market Potential and Opportunity Assessment (TAM–SAM–SOM Framework)
- 4.8. PMV Analyst Note
- 4.1. Porters Five Forces
- 5. Market Analysis, Insights and Forecast 2021-2033
- 5.1. Market Analysis, Insights and Forecast - by Product Type
- 5.1.1. Oleic Acid
- 5.1.2. Linoleic Acid
- 5.1.3. Linolenic Acid
- 5.1.4. Palmitic Acid
- 5.1.5. Other Product Types
- 5.2. Market Analysis, Insights and Forecast - by Application
- 5.2.1. Alkyd Resins
- 5.2.2. Dimer Acids
- 5.2.3. Fatty Acid Ester
- 5.2.4. Other Applications
- 5.3. Market Analysis, Insights and Forecast - by End-user Industry
- 5.3.1. Soaps and Detergents
- 5.3.2. Paints and Coatings
- 5.3.3. Automotive
- 5.3.4. Metal Working Fluids
- 5.3.5. Oil and Gas
- 5.3.6. Other End-user Industries
- 5.4. Market Analysis, Insights and Forecast - by Region
- 5.4.1. Asia Pacific
- 5.4.2. North America
- 5.4.3. Europe
- 5.4.4. South America
- 5.4.5. Middle East and Africa
- 5.1. Market Analysis, Insights and Forecast - by Product Type
- 6. Global Tall Oil Fatty Acid Market Analysis, Insights and Forecast, 2021-2033
- 6.1. Market Analysis, Insights and Forecast - by Product Type
- 6.1.1. Oleic Acid
- 6.1.2. Linoleic Acid
- 6.1.3. Linolenic Acid
- 6.1.4. Palmitic Acid
- 6.1.5. Other Product Types
- 6.2. Market Analysis, Insights and Forecast - by Application
- 6.2.1. Alkyd Resins
- 6.2.2. Dimer Acids
- 6.2.3. Fatty Acid Ester
- 6.2.4. Other Applications
- 6.3. Market Analysis, Insights and Forecast - by End-user Industry
- 6.3.1. Soaps and Detergents
- 6.3.2. Paints and Coatings
- 6.3.3. Automotive
- 6.3.4. Metal Working Fluids
- 6.3.5. Oil and Gas
- 6.3.6. Other End-user Industries
- 6.1. Market Analysis, Insights and Forecast - by Product Type
- 7. Asia Pacific Tall Oil Fatty Acid Market Analysis, Insights and Forecast, 2020-2032
- 7.1. Market Analysis, Insights and Forecast - by Product Type
- 7.1.1. Oleic Acid
- 7.1.2. Linoleic Acid
- 7.1.3. Linolenic Acid
- 7.1.4. Palmitic Acid
- 7.1.5. Other Product Types
- 7.2. Market Analysis, Insights and Forecast - by Application
- 7.2.1. Alkyd Resins
- 7.2.2. Dimer Acids
- 7.2.3. Fatty Acid Ester
- 7.2.4. Other Applications
- 7.3. Market Analysis, Insights and Forecast - by End-user Industry
- 7.3.1. Soaps and Detergents
- 7.3.2. Paints and Coatings
- 7.3.3. Automotive
- 7.3.4. Metal Working Fluids
- 7.3.5. Oil and Gas
- 7.3.6. Other End-user Industries
- 7.1. Market Analysis, Insights and Forecast - by Product Type
- 8. North America Tall Oil Fatty Acid Market Analysis, Insights and Forecast, 2020-2032
- 8.1. Market Analysis, Insights and Forecast - by Product Type
- 8.1.1. Oleic Acid
- 8.1.2. Linoleic Acid
- 8.1.3. Linolenic Acid
- 8.1.4. Palmitic Acid
- 8.1.5. Other Product Types
- 8.2. Market Analysis, Insights and Forecast - by Application
- 8.2.1. Alkyd Resins
- 8.2.2. Dimer Acids
- 8.2.3. Fatty Acid Ester
- 8.2.4. Other Applications
- 8.3. Market Analysis, Insights and Forecast - by End-user Industry
- 8.3.1. Soaps and Detergents
- 8.3.2. Paints and Coatings
- 8.3.3. Automotive
- 8.3.4. Metal Working Fluids
- 8.3.5. Oil and Gas
- 8.3.6. Other End-user Industries
- 8.1. Market Analysis, Insights and Forecast - by Product Type
- 9. Europe Tall Oil Fatty Acid Market Analysis, Insights and Forecast, 2020-2032
- 9.1. Market Analysis, Insights and Forecast - by Product Type
- 9.1.1. Oleic Acid
- 9.1.2. Linoleic Acid
- 9.1.3. Linolenic Acid
- 9.1.4. Palmitic Acid
- 9.1.5. Other Product Types
- 9.2. Market Analysis, Insights and Forecast - by Application
- 9.2.1. Alkyd Resins
- 9.2.2. Dimer Acids
- 9.2.3. Fatty Acid Ester
- 9.2.4. Other Applications
- 9.3. Market Analysis, Insights and Forecast - by End-user Industry
- 9.3.1. Soaps and Detergents
- 9.3.2. Paints and Coatings
- 9.3.3. Automotive
- 9.3.4. Metal Working Fluids
- 9.3.5. Oil and Gas
- 9.3.6. Other End-user Industries
- 9.1. Market Analysis, Insights and Forecast - by Product Type
- 10. South America Tall Oil Fatty Acid Market Analysis, Insights and Forecast, 2020-2032
- 10.1. Market Analysis, Insights and Forecast - by Product Type
- 10.1.1. Oleic Acid
- 10.1.2. Linoleic Acid
- 10.1.3. Linolenic Acid
- 10.1.4. Palmitic Acid
- 10.1.5. Other Product Types
- 10.2. Market Analysis, Insights and Forecast - by Application
- 10.2.1. Alkyd Resins
- 10.2.2. Dimer Acids
- 10.2.3. Fatty Acid Ester
- 10.2.4. Other Applications
- 10.3. Market Analysis, Insights and Forecast - by End-user Industry
- 10.3.1. Soaps and Detergents
- 10.3.2. Paints and Coatings
- 10.3.3. Automotive
- 10.3.4. Metal Working Fluids
- 10.3.5. Oil and Gas
- 10.3.6. Other End-user Industries
- 10.1. Market Analysis, Insights and Forecast - by Product Type
- 11. Middle East and Africa Tall Oil Fatty Acid Market Analysis, Insights and Forecast, 2020-2032
- 11.1. Market Analysis, Insights and Forecast - by Product Type
- 11.1.1. Oleic Acid
- 11.1.2. Linoleic Acid
- 11.1.3. Linolenic Acid
- 11.1.4. Palmitic Acid
- 11.1.5. Other Product Types
- 11.2. Market Analysis, Insights and Forecast - by Application
- 11.2.1. Alkyd Resins
- 11.2.2. Dimer Acids
- 11.2.3. Fatty Acid Ester
- 11.2.4. Other Applications
- 11.3. Market Analysis, Insights and Forecast - by End-user Industry
- 11.3.1. Soaps and Detergents
- 11.3.2. Paints and Coatings
- 11.3.3. Automotive
- 11.3.4. Metal Working Fluids
- 11.3.5. Oil and Gas
- 11.3.6. Other End-user Industries
- 11.1. Market Analysis, Insights and Forecast - by Product Type
- 12. Competitive Analysis
- 12.1. Company Profiles
- 12.1.1 Lascaray S A
- 12.1.1.1. Company Overview
- 12.1.1.2. Products
- 12.1.1.3. Company Financials
- 12.1.1.4. SWOT Analysis
- 12.1.2 Pine Chemical Group
- 12.1.2.1. Company Overview
- 12.1.2.2. Products
- 12.1.2.3. Company Financials
- 12.1.2.4. SWOT Analysis
- 12.1.3 Imperial Industrial Minerals Company
- 12.1.3.1. Company Overview
- 12.1.3.2. Products
- 12.1.3.3. Company Financials
- 12.1.3.4. SWOT Analysis
- 12.1.4 Arizona Chemical Co
- 12.1.4.1. Company Overview
- 12.1.4.2. Products
- 12.1.4.3. Company Financials
- 12.1.4.4. SWOT Analysis
- 12.1.5 Harima Chemicals Group Inc
- 12.1.5.1. Company Overview
- 12.1.5.2. Products
- 12.1.5.3. Company Financials
- 12.1.5.4. SWOT Analysis
- 12.1.6 Eastman Chemical Company
- 12.1.6.1. Company Overview
- 12.1.6.2. Products
- 12.1.6.3. Company Financials
- 12.1.6.4. SWOT Analysis
- 12.1.7 Ingevity
- 12.1.7.1. Company Overview
- 12.1.7.2. Products
- 12.1.7.3. Company Financials
- 12.1.7.4. SWOT Analysis
- 12.1.8 Segezha-Group
- 12.1.8.1. Company Overview
- 12.1.8.2. Products
- 12.1.8.3. Company Financials
- 12.1.8.4. SWOT Analysis
- 12.1.9 Forchem Oyj
- 12.1.9.1. Company Overview
- 12.1.9.2. Products
- 12.1.9.3. Company Financials
- 12.1.9.4. SWOT Analysis
- 12.1.10 Ilim Group
- 12.1.10.1. Company Overview
- 12.1.10.2. Products
- 12.1.10.3. Company Financials
- 12.1.10.4. SWOT Analysis
- 12.1.11 KRATON CORPORATION
- 12.1.11.1. Company Overview
- 12.1.11.2. Products
- 12.1.11.3. Company Financials
- 12.1.11.4. SWOT Analysis
- 12.1.12 UNIVAR SOLUTIONS
- 12.1.12.1. Company Overview
- 12.1.12.2. Products
- 12.1.12.3. Company Financials
- 12.1.12.4. SWOT Analysis
- 12.1.13 Shaxian Lixin Resin Co Ltd
- 12.1.13.1. Company Overview
- 12.1.13.2. Products
- 12.1.13.3. Company Financials
- 12.1.13.4. SWOT Analysis
- 12.1.14 Foreverest Resources Ltd
- 12.1.14.1. Company Overview
- 12.1.14.2. Products
- 12.1.14.3. Company Financials
- 12.1.14.4. SWOT Analysis
- 12.1.15 Pasand Speciality Chemicals
- 12.1.15.1. Company Overview
- 12.1.15.2. Products
- 12.1.15.3. Company Financials
- 12.1.15.4. SWOT Analysis
- 12.1.16 Ataman Kimya
- 12.1.16.1. Company Overview
- 12.1.16.2. Products
- 12.1.16.3. Company Financials
- 12.1.16.4. SWOT Analysis
- 12.1.17 G C Rutteman & Co B V
- 12.1.17.1. Company Overview
- 12.1.17.2. Products
- 12.1.17.3. Company Financials
- 12.1.17.4. SWOT Analysis
- 12.1.1 Lascaray S A
- 12.2. Market Entropy
- 12.2.1 Company's Key Areas Served
- 12.2.2 Recent Developments
- 12.3. Company Market Share Analysis 2025
- 12.3.1 Top 5 Companies Market Share Analysis
- 12.3.2 Top 3 Companies Market Share Analysis
- 12.4. List of Potential Customers
- 13. Research Methodology
List of Figures
- Figure 1: Global Tall Oil Fatty Acid Market Revenue Breakdown (million, %) by Region 2025 & 2033
- Figure 2: Global Tall Oil Fatty Acid Market Volume Breakdown (K Tons, %) by Region 2025 & 2033
- Figure 3: Asia Pacific Tall Oil Fatty Acid Market Revenue (million), by Product Type 2025 & 2033
- Figure 4: Asia Pacific Tall Oil Fatty Acid Market Volume (K Tons), by Product Type 2025 & 2033
- Figure 5: Asia Pacific Tall Oil Fatty Acid Market Revenue Share (%), by Product Type 2025 & 2033
- Figure 6: Asia Pacific Tall Oil Fatty Acid Market Volume Share (%), by Product Type 2025 & 2033
- Figure 7: Asia Pacific Tall Oil Fatty Acid Market Revenue (million), by Application 2025 & 2033
- Figure 8: Asia Pacific Tall Oil Fatty Acid Market Volume (K Tons), by Application 2025 & 2033
- Figure 9: Asia Pacific Tall Oil Fatty Acid Market Revenue Share (%), by Application 2025 & 2033
- Figure 10: Asia Pacific Tall Oil Fatty Acid Market Volume Share (%), by Application 2025 & 2033
- Figure 11: Asia Pacific Tall Oil Fatty Acid Market Revenue (million), by End-user Industry 2025 & 2033
- Figure 12: Asia Pacific Tall Oil Fatty Acid Market Volume (K Tons), by End-user Industry 2025 & 2033
- Figure 13: Asia Pacific Tall Oil Fatty Acid Market Revenue Share (%), by End-user Industry 2025 & 2033
- Figure 14: Asia Pacific Tall Oil Fatty Acid Market Volume Share (%), by End-user Industry 2025 & 2033
- Figure 15: Asia Pacific Tall Oil Fatty Acid Market Revenue (million), by Country 2025 & 2033
- Figure 16: Asia Pacific Tall Oil Fatty Acid Market Volume (K Tons), by Country 2025 & 2033
- Figure 17: Asia Pacific Tall Oil Fatty Acid Market Revenue Share (%), by Country 2025 & 2033
- Figure 18: Asia Pacific Tall Oil Fatty Acid Market Volume Share (%), by Country 2025 & 2033
- Figure 19: North America Tall Oil Fatty Acid Market Revenue (million), by Product Type 2025 & 2033
- Figure 20: North America Tall Oil Fatty Acid Market Volume (K Tons), by Product Type 2025 & 2033
- Figure 21: North America Tall Oil Fatty Acid Market Revenue Share (%), by Product Type 2025 & 2033
- Figure 22: North America Tall Oil Fatty Acid Market Volume Share (%), by Product Type 2025 & 2033
- Figure 23: North America Tall Oil Fatty Acid Market Revenue (million), by Application 2025 & 2033
- Figure 24: North America Tall Oil Fatty Acid Market Volume (K Tons), by Application 2025 & 2033
- Figure 25: North America Tall Oil Fatty Acid Market Revenue Share (%), by Application 2025 & 2033
- Figure 26: North America Tall Oil Fatty Acid Market Volume Share (%), by Application 2025 & 2033
- Figure 27: North America Tall Oil Fatty Acid Market Revenue (million), by End-user Industry 2025 & 2033
- Figure 28: North America Tall Oil Fatty Acid Market Volume (K Tons), by End-user Industry 2025 & 2033
- Figure 29: North America Tall Oil Fatty Acid Market Revenue Share (%), by End-user Industry 2025 & 2033
- Figure 30: North America Tall Oil Fatty Acid Market Volume Share (%), by End-user Industry 2025 & 2033
- Figure 31: North America Tall Oil Fatty Acid Market Revenue (million), by Country 2025 & 2033
- Figure 32: North America Tall Oil Fatty Acid Market Volume (K Tons), by Country 2025 & 2033
- Figure 33: North America Tall Oil Fatty Acid Market Revenue Share (%), by Country 2025 & 2033
- Figure 34: North America Tall Oil Fatty Acid Market Volume Share (%), by Country 2025 & 2033
- Figure 35: Europe Tall Oil Fatty Acid Market Revenue (million), by Product Type 2025 & 2033
- Figure 36: Europe Tall Oil Fatty Acid Market Volume (K Tons), by Product Type 2025 & 2033
- Figure 37: Europe Tall Oil Fatty Acid Market Revenue Share (%), by Product Type 2025 & 2033
- Figure 38: Europe Tall Oil Fatty Acid Market Volume Share (%), by Product Type 2025 & 2033
- Figure 39: Europe Tall Oil Fatty Acid Market Revenue (million), by Application 2025 & 2033
- Figure 40: Europe Tall Oil Fatty Acid Market Volume (K Tons), by Application 2025 & 2033
- Figure 41: Europe Tall Oil Fatty Acid Market Revenue Share (%), by Application 2025 & 2033
- Figure 42: Europe Tall Oil Fatty Acid Market Volume Share (%), by Application 2025 & 2033
- Figure 43: Europe Tall Oil Fatty Acid Market Revenue (million), by End-user Industry 2025 & 2033
- Figure 44: Europe Tall Oil Fatty Acid Market Volume (K Tons), by End-user Industry 2025 & 2033
- Figure 45: Europe Tall Oil Fatty Acid Market Revenue Share (%), by End-user Industry 2025 & 2033
- Figure 46: Europe Tall Oil Fatty Acid Market Volume Share (%), by End-user Industry 2025 & 2033
- Figure 47: Europe Tall Oil Fatty Acid Market Revenue (million), by Country 2025 & 2033
- Figure 48: Europe Tall Oil Fatty Acid Market Volume (K Tons), by Country 2025 & 2033
- Figure 49: Europe Tall Oil Fatty Acid Market Revenue Share (%), by Country 2025 & 2033
- Figure 50: Europe Tall Oil Fatty Acid Market Volume Share (%), by Country 2025 & 2033
- Figure 51: South America Tall Oil Fatty Acid Market Revenue (million), by Product Type 2025 & 2033
- Figure 52: South America Tall Oil Fatty Acid Market Volume (K Tons), by Product Type 2025 & 2033
- Figure 53: South America Tall Oil Fatty Acid Market Revenue Share (%), by Product Type 2025 & 2033
- Figure 54: South America Tall Oil Fatty Acid Market Volume Share (%), by Product Type 2025 & 2033
- Figure 55: South America Tall Oil Fatty Acid Market Revenue (million), by Application 2025 & 2033
- Figure 56: South America Tall Oil Fatty Acid Market Volume (K Tons), by Application 2025 & 2033
- Figure 57: South America Tall Oil Fatty Acid Market Revenue Share (%), by Application 2025 & 2033
- Figure 58: South America Tall Oil Fatty Acid Market Volume Share (%), by Application 2025 & 2033
- Figure 59: South America Tall Oil Fatty Acid Market Revenue (million), by End-user Industry 2025 & 2033
- Figure 60: South America Tall Oil Fatty Acid Market Volume (K Tons), by End-user Industry 2025 & 2033
- Figure 61: South America Tall Oil Fatty Acid Market Revenue Share (%), by End-user Industry 2025 & 2033
- Figure 62: South America Tall Oil Fatty Acid Market Volume Share (%), by End-user Industry 2025 & 2033
- Figure 63: South America Tall Oil Fatty Acid Market Revenue (million), by Country 2025 & 2033
- Figure 64: South America Tall Oil Fatty Acid Market Volume (K Tons), by Country 2025 & 2033
- Figure 65: South America Tall Oil Fatty Acid Market Revenue Share (%), by Country 2025 & 2033
- Figure 66: South America Tall Oil Fatty Acid Market Volume Share (%), by Country 2025 & 2033
- Figure 67: Middle East and Africa Tall Oil Fatty Acid Market Revenue (million), by Product Type 2025 & 2033
- Figure 68: Middle East and Africa Tall Oil Fatty Acid Market Volume (K Tons), by Product Type 2025 & 2033
- Figure 69: Middle East and Africa Tall Oil Fatty Acid Market Revenue Share (%), by Product Type 2025 & 2033
- Figure 70: Middle East and Africa Tall Oil Fatty Acid Market Volume Share (%), by Product Type 2025 & 2033
- Figure 71: Middle East and Africa Tall Oil Fatty Acid Market Revenue (million), by Application 2025 & 2033
- Figure 72: Middle East and Africa Tall Oil Fatty Acid Market Volume (K Tons), by Application 2025 & 2033
- Figure 73: Middle East and Africa Tall Oil Fatty Acid Market Revenue Share (%), by Application 2025 & 2033
- Figure 74: Middle East and Africa Tall Oil Fatty Acid Market Volume Share (%), by Application 2025 & 2033
- Figure 75: Middle East and Africa Tall Oil Fatty Acid Market Revenue (million), by End-user Industry 2025 & 2033
- Figure 76: Middle East and Africa Tall Oil Fatty Acid Market Volume (K Tons), by End-user Industry 2025 & 2033
- Figure 77: Middle East and Africa Tall Oil Fatty Acid Market Revenue Share (%), by End-user Industry 2025 & 2033
- Figure 78: Middle East and Africa Tall Oil Fatty Acid Market Volume Share (%), by End-user Industry 2025 & 2033
- Figure 79: Middle East and Africa Tall Oil Fatty Acid Market Revenue (million), by Country 2025 & 2033
- Figure 80: Middle East and Africa Tall Oil Fatty Acid Market Volume (K Tons), by Country 2025 & 2033
- Figure 81: Middle East and Africa Tall Oil Fatty Acid Market Revenue Share (%), by Country 2025 & 2033
- Figure 82: Middle East and Africa Tall Oil Fatty Acid Market Volume Share (%), by Country 2025 & 2033
List of Tables
- Table 1: Global Tall Oil Fatty Acid Market Revenue million Forecast, by Product Type 2020 & 2033
- Table 2: Global Tall Oil Fatty Acid Market Volume K Tons Forecast, by Product Type 2020 & 2033
- Table 3: Global Tall Oil Fatty Acid Market Revenue million Forecast, by Application 2020 & 2033
- Table 4: Global Tall Oil Fatty Acid Market Volume K Tons Forecast, by Application 2020 & 2033
- Table 5: Global Tall Oil Fatty Acid Market Revenue million Forecast, by End-user Industry 2020 & 2033
- Table 6: Global Tall Oil Fatty Acid Market Volume K Tons Forecast, by End-user Industry 2020 & 2033
- Table 7: Global Tall Oil Fatty Acid Market Revenue million Forecast, by Region 2020 & 2033
- Table 8: Global Tall Oil Fatty Acid Market Volume K Tons Forecast, by Region 2020 & 2033
- Table 9: Global Tall Oil Fatty Acid Market Revenue million Forecast, by Product Type 2020 & 2033
- Table 10: Global Tall Oil Fatty Acid Market Volume K Tons Forecast, by Product Type 2020 & 2033
- Table 11: Global Tall Oil Fatty Acid Market Revenue million Forecast, by Application 2020 & 2033
- Table 12: Global Tall Oil Fatty Acid Market Volume K Tons Forecast, by Application 2020 & 2033
- Table 13: Global Tall Oil Fatty Acid Market Revenue million Forecast, by End-user Industry 2020 & 2033
- Table 14: Global Tall Oil Fatty Acid Market Volume K Tons Forecast, by End-user Industry 2020 & 2033
- Table 15: Global Tall Oil Fatty Acid Market Revenue million Forecast, by Country 2020 & 2033
- Table 16: Global Tall Oil Fatty Acid Market Volume K Tons Forecast, by Country 2020 & 2033
- Table 17: China Tall Oil Fatty Acid Market Revenue (million) Forecast, by Application 2020 & 2033
- Table 18: China Tall Oil Fatty Acid Market Volume (K Tons) Forecast, by Application 2020 & 2033
- Table 19: India Tall Oil Fatty Acid Market Revenue (million) Forecast, by Application 2020 & 2033
- Table 20: India Tall Oil Fatty Acid Market Volume (K Tons) Forecast, by Application 2020 & 2033
- Table 21: Japan Tall Oil Fatty Acid Market Revenue (million) Forecast, by Application 2020 & 2033
- Table 22: Japan Tall Oil Fatty Acid Market Volume (K Tons) Forecast, by Application 2020 & 2033
- Table 23: South Korea Tall Oil Fatty Acid Market Revenue (million) Forecast, by Application 2020 & 2033
- Table 24: South Korea Tall Oil Fatty Acid Market Volume (K Tons) Forecast, by Application 2020 & 2033
- Table 25: Rest of Asia Pacific Tall Oil Fatty Acid Market Revenue (million) Forecast, by Application 2020 & 2033
- Table 26: Rest of Asia Pacific Tall Oil Fatty Acid Market Volume (K Tons) Forecast, by Application 2020 & 2033
- Table 27: Global Tall Oil Fatty Acid Market Revenue million Forecast, by Product Type 2020 & 2033
- Table 28: Global Tall Oil Fatty Acid Market Volume K Tons Forecast, by Product Type 2020 & 2033
- Table 29: Global Tall Oil Fatty Acid Market Revenue million Forecast, by Application 2020 & 2033
- Table 30: Global Tall Oil Fatty Acid Market Volume K Tons Forecast, by Application 2020 & 2033
- Table 31: Global Tall Oil Fatty Acid Market Revenue million Forecast, by End-user Industry 2020 & 2033
- Table 32: Global Tall Oil Fatty Acid Market Volume K Tons Forecast, by End-user Industry 2020 & 2033
- Table 33: Global Tall Oil Fatty Acid Market Revenue million Forecast, by Country 2020 & 2033
- Table 34: Global Tall Oil Fatty Acid Market Volume K Tons Forecast, by Country 2020 & 2033
- Table 35: United States Tall Oil Fatty Acid Market Revenue (million) Forecast, by Application 2020 & 2033
- Table 36: United States Tall Oil Fatty Acid Market Volume (K Tons) Forecast, by Application 2020 & 2033
- Table 37: Canada Tall Oil Fatty Acid Market Revenue (million) Forecast, by Application 2020 & 2033
- Table 38: Canada Tall Oil Fatty Acid Market Volume (K Tons) Forecast, by Application 2020 & 2033
- Table 39: Mexico Tall Oil Fatty Acid Market Revenue (million) Forecast, by Application 2020 & 2033
- Table 40: Mexico Tall Oil Fatty Acid Market Volume (K Tons) Forecast, by Application 2020 & 2033
- Table 41: Global Tall Oil Fatty Acid Market Revenue million Forecast, by Product Type 2020 & 2033
- Table 42: Global Tall Oil Fatty Acid Market Volume K Tons Forecast, by Product Type 2020 & 2033
- Table 43: Global Tall Oil Fatty Acid Market Revenue million Forecast, by Application 2020 & 2033
- Table 44: Global Tall Oil Fatty Acid Market Volume K Tons Forecast, by Application 2020 & 2033
- Table 45: Global Tall Oil Fatty Acid Market Revenue million Forecast, by End-user Industry 2020 & 2033
- Table 46: Global Tall Oil Fatty Acid Market Volume K Tons Forecast, by End-user Industry 2020 & 2033
- Table 47: Global Tall Oil Fatty Acid Market Revenue million Forecast, by Country 2020 & 2033
- Table 48: Global Tall Oil Fatty Acid Market Volume K Tons Forecast, by Country 2020 & 2033
- Table 49: Germany Tall Oil Fatty Acid Market Revenue (million) Forecast, by Application 2020 & 2033
- Table 50: Germany Tall Oil Fatty Acid Market Volume (K Tons) Forecast, by Application 2020 & 2033
- Table 51: United Kingdom Tall Oil Fatty Acid Market Revenue (million) Forecast, by Application 2020 & 2033
- Table 52: United Kingdom Tall Oil Fatty Acid Market Volume (K Tons) Forecast, by Application 2020 & 2033
- Table 53: Italy Tall Oil Fatty Acid Market Revenue (million) Forecast, by Application 2020 & 2033
- Table 54: Italy Tall Oil Fatty Acid Market Volume (K Tons) Forecast, by Application 2020 & 2033
- Table 55: France Tall Oil Fatty Acid Market Revenue (million) Forecast, by Application 2020 & 2033
- Table 56: France Tall Oil Fatty Acid Market Volume (K Tons) Forecast, by Application 2020 & 2033
- Table 57: Rest of Europe Tall Oil Fatty Acid Market Revenue (million) Forecast, by Application 2020 & 2033
- Table 58: Rest of Europe Tall Oil Fatty Acid Market Volume (K Tons) Forecast, by Application 2020 & 2033
- Table 59: Global Tall Oil Fatty Acid Market Revenue million Forecast, by Product Type 2020 & 2033
- Table 60: Global Tall Oil Fatty Acid Market Volume K Tons Forecast, by Product Type 2020 & 2033
- Table 61: Global Tall Oil Fatty Acid Market Revenue million Forecast, by Application 2020 & 2033
- Table 62: Global Tall Oil Fatty Acid Market Volume K Tons Forecast, by Application 2020 & 2033
- Table 63: Global Tall Oil Fatty Acid Market Revenue million Forecast, by End-user Industry 2020 & 2033
- Table 64: Global Tall Oil Fatty Acid Market Volume K Tons Forecast, by End-user Industry 2020 & 2033
- Table 65: Global Tall Oil Fatty Acid Market Revenue million Forecast, by Country 2020 & 2033
- Table 66: Global Tall Oil Fatty Acid Market Volume K Tons Forecast, by Country 2020 & 2033
- Table 67: Brazil Tall Oil Fatty Acid Market Revenue (million) Forecast, by Application 2020 & 2033
- Table 68: Brazil Tall Oil Fatty Acid Market Volume (K Tons) Forecast, by Application 2020 & 2033
- Table 69: Argentina Tall Oil Fatty Acid Market Revenue (million) Forecast, by Application 2020 & 2033
- Table 70: Argentina Tall Oil Fatty Acid Market Volume (K Tons) Forecast, by Application 2020 & 2033
- Table 71: Rest of South America Tall Oil Fatty Acid Market Revenue (million) Forecast, by Application 2020 & 2033
- Table 72: Rest of South America Tall Oil Fatty Acid Market Volume (K Tons) Forecast, by Application 2020 & 2033
- Table 73: Global Tall Oil Fatty Acid Market Revenue million Forecast, by Product Type 2020 & 2033
- Table 74: Global Tall Oil Fatty Acid Market Volume K Tons Forecast, by Product Type 2020 & 2033
- Table 75: Global Tall Oil Fatty Acid Market Revenue million Forecast, by Application 2020 & 2033
- Table 76: Global Tall Oil Fatty Acid Market Volume K Tons Forecast, by Application 2020 & 2033
- Table 77: Global Tall Oil Fatty Acid Market Revenue million Forecast, by End-user Industry 2020 & 2033
- Table 78: Global Tall Oil Fatty Acid Market Volume K Tons Forecast, by End-user Industry 2020 & 2033
- Table 79: Global Tall Oil Fatty Acid Market Revenue million Forecast, by Country 2020 & 2033
- Table 80: Global Tall Oil Fatty Acid Market Volume K Tons Forecast, by Country 2020 & 2033
- Table 81: Saudi Arabia Tall Oil Fatty Acid Market Revenue (million) Forecast, by Application 2020 & 2033
- Table 82: Saudi Arabia Tall Oil Fatty Acid Market Volume (K Tons) Forecast, by Application 2020 & 2033
- Table 83: South Africa Tall Oil Fatty Acid Market Revenue (million) Forecast, by Application 2020 & 2033
- Table 84: South Africa Tall Oil Fatty Acid Market Volume (K Tons) Forecast, by Application 2020 & 2033
- Table 85: Rest of Middle East and Africa Tall Oil Fatty Acid Market Revenue (million) Forecast, by Application 2020 & 2033
- Table 86: Rest of Middle East and Africa Tall Oil Fatty Acid Market Volume (K Tons) Forecast, by Application 2020 & 2033
Frequently Asked Questions
1. What is the projected Compound Annual Growth Rate (CAGR) of the Tall Oil Fatty Acid Market?
The projected CAGR is approximately 4.66%.
2. Which companies are prominent players in the Tall Oil Fatty Acid Market?
Key companies in the market include Lascaray S A, Pine Chemical Group, Imperial Industrial Minerals Company, Arizona Chemical Co, Harima Chemicals Group Inc, Eastman Chemical Company, Ingevity, Segezha-Group, Forchem Oyj, Ilim Group, KRATON CORPORATION, UNIVAR SOLUTIONS, Shaxian Lixin Resin Co Ltd, Foreverest Resources Ltd, Pasand Speciality Chemicals, Ataman Kimya, G C Rutteman & Co B V.
3. What are the main segments of the Tall Oil Fatty Acid Market?
The market segments include Product Type, Application, End-user Industry.
4. Can you provide details about the market size?
The market size is estimated to be USD 4.82 million as of 2022.
5. What are some drivers contributing to market growth?
Increasing Demand for Bio-based Lubricants in Several Industries; Other Drivers.
6. What are the notable trends driving market growth?
Increasing Usage in the Automotive Industry.
7. Are there any restraints impacting market growth?
Restrictions on Cutting of Trees by Various Governments Across the Globe; Other Restraints.
8. Can you provide examples of recent developments in the market?
N/A
9. What pricing options are available for accessing the report?
Pricing options include single-user, multi-user, and enterprise licenses priced at USD 4750, USD 5250, and USD 8750 respectively.
10. Is the market size provided in terms of value or volume?
The market size is provided in terms of value, measured in million and volume, measured in K Tons.
11. Are there any specific market keywords associated with the report?
Yes, the market keyword associated with the report is "Tall Oil Fatty Acid Market," which aids in identifying and referencing the specific market segment covered.
12. How do I determine which pricing option suits my needs best?
The pricing options vary based on user requirements and access needs. Individual users may opt for single-user licenses, while businesses requiring broader access may choose multi-user or enterprise licenses for cost-effective access to the report.
13. Are there any additional resources or data provided in the Tall Oil Fatty Acid Market report?
While the report offers comprehensive insights, it's advisable to review the specific contents or supplementary materials provided to ascertain if additional resources or data are available.
14. How can I stay updated on further developments or reports in the Tall Oil Fatty Acid Market?
To stay informed about further developments, trends, and reports in the Tall Oil Fatty Acid Market, consider subscribing to industry newsletters, following relevant companies and organizations, or regularly checking reputable industry news sources and publications.
Methodology
Step 1 - Identification of Relevant Samples Size from Population Database


Step 2 - Approaches for Defining Global Market Size (Value, Volume* & Price*)

Note*: In applicable scenarios
Step 3 - Data Sources
Primary Research
- Web Analytics
- Survey Reports
- Research Institute
- Latest Research Reports
- Opinion Leaders
Secondary Research
- Annual Reports
- White Paper
- Latest Press Release
- Industry Association
- Paid Database
- Investor Presentations

Step 4 - Data Triangulation
Involves using different sources of information in order to increase the validity of a study
These sources are likely to be stakeholders in a program - participants, other researchers, program staff, other community members, and so on.
Then we put all data in single framework & apply various statistical tools to find out the dynamic on the market.
During the analysis stage, feedback from the stakeholder groups would be compared to determine areas of agreement as well as areas of divergence