
Key Insights
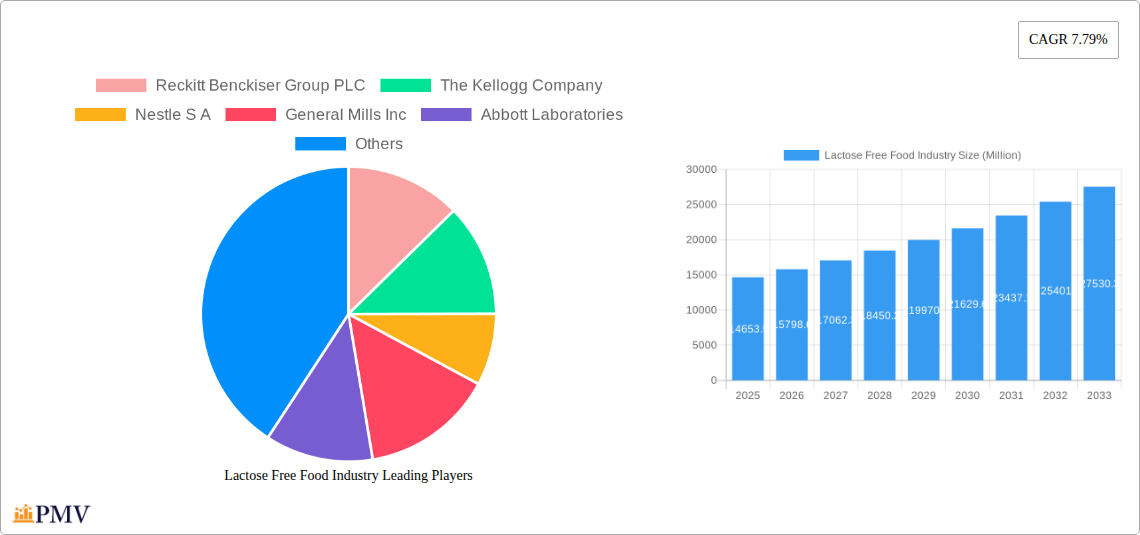
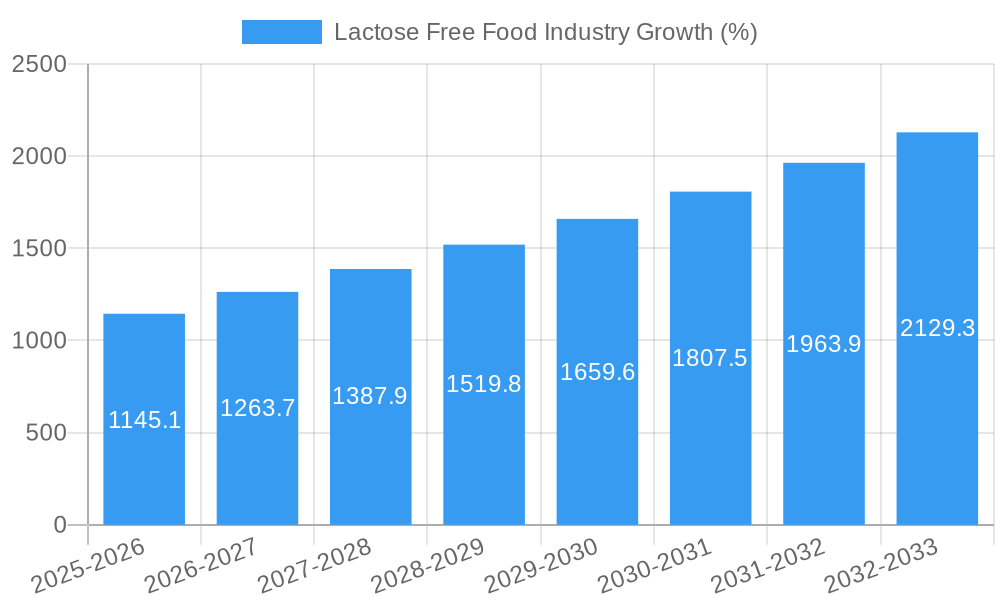
The lactose-free food market, valued at $14,653.5 million in 2025, is experiencing robust growth, projected to expand at a Compound Annual Growth Rate (CAGR) of 7.79% from 2025 to 2033. This surge is driven by the increasing prevalence of lactose intolerance globally, coupled with rising consumer awareness of health and wellness. The rising demand for convenient and healthier food options fuels the growth across various product categories, including dairy alternatives (plant-based milk, yogurt, and cheese), bakery products, confectionery, and meat and seafood products with lactose-free ingredients. The shift towards healthier diets, particularly amongst millennials and Gen Z, is a significant driver, as is the increasing availability of lactose-free products across diverse distribution channels, including supermarkets, convenience stores, and online retailers. Growth is particularly strong in North America and Europe, regions with high lactose intolerance rates and established health-conscious consumer bases. However, factors like relatively higher prices compared to conventional products and the potential for limited taste and texture in some lactose-free alternatives present challenges to market expansion.
Further growth will be influenced by ongoing product innovation, focusing on improved taste, texture, and nutritional value of lactose-free products. Expansion into emerging markets in Asia-Pacific and South America, alongside strategic partnerships between food manufacturers and technology providers, will further drive market expansion. The growing focus on clear and transparent labeling, particularly highlighting gluten-free and lactose-free attributes, enhances consumer confidence and purchasing decisions. The competitive landscape involves a mix of established multinational corporations and smaller specialized players, leading to increased product diversification and availability. The market's future outlook remains positive, driven by sustained consumer demand for healthier and more inclusive food options. Strategic investments in research and development, along with effective marketing campaigns highlighting the health benefits and versatility of lactose-free products, will be crucial for continued success.
Lactose-Free Food Industry Market Report: 2019-2033
This comprehensive report provides a detailed analysis of the global lactose-free food industry, encompassing market size, segmentation, competitive landscape, and future growth projections from 2019 to 2033. The report utilizes a robust methodology, incorporating historical data (2019-2024), a base year of 2025, and an estimated year of 2025, to forecast market trends until 2033. Key players like Reckitt Benckiser Group PLC, The Kellogg Company, Nestlé S.A., General Mills Inc., Abbott Laboratories, Danone SA, Dr. Schar AG/SPA, Blue Diamond Growers, Oatly Group AB, and Beyond Meat are analyzed, along with emerging trends and challenges shaping this dynamic market. This in-depth analysis is essential for businesses, investors, and stakeholders seeking to understand and capitalize on the opportunities within the burgeoning lactose-free food sector. The market is projected to reach xx Million by 2033.
Lactose-Free Food Industry Market Structure & Competitive Dynamics
The global lactose-free food market exhibits a moderately concentrated structure, with a few multinational corporations holding significant market share. However, the landscape is increasingly competitive due to the rise of smaller, specialized players and private label brands. Key players compete on factors such as product innovation, distribution networks, branding, and price. The innovation ecosystem is dynamic, driven by advancements in food technology and consumer demand for healthier, specialized food options. Regulatory frameworks, varying across different regions, impact product development, labeling, and marketing claims. Product substitutes, such as plant-based alternatives, pose both a threat and an opportunity, pushing existing players to innovate and diversify their offerings. Consumer preferences are shifting towards healthier and more convenient food choices, further stimulating demand for lactose-free products. Mergers and acquisitions (M&A) activity remains significant, with larger companies seeking to expand their portfolios and gain market share. In the past five years, M&A deal values in the lactose-free food sector totaled approximately xx Million, representing a CAGR of xx%.
- Market Concentration: xx% market share held by the top 5 players.
- M&A Activity: xx major deals closed in the last five years, totaling xx Million.
- Regulatory Landscape: Varies significantly across geographies, impacting labeling and product development.
- Key Competitive Factors: Product innovation, brand recognition, distribution, and pricing strategies.
Lactose-Free Food Industry Trends & Insights
The lactose-free food industry is experiencing robust growth, driven by several key factors. Rising prevalence of lactose intolerance globally, coupled with increased consumer awareness of health and wellness, is a major growth driver. Technological advancements in food processing and formulation are allowing for the development of more palatable and nutritious lactose-free products. Consumer preferences are leaning towards convenience, leading to increased demand for ready-to-eat and processed lactose-free foods. The market is witnessing a surge in plant-based alternatives, such as oat milk, soy milk, and almond milk, driving innovation and competition. The industry's CAGR is projected to be xx% during the forecast period (2025-2033), with a market penetration rate reaching xx% by 2033. This growth is fueled by increasing disposable incomes and changing dietary habits in emerging economies. Competitive dynamics remain intense, with both established players and new entrants vying for market share.
Dominant Markets & Segments in Lactose-Free Food Industry
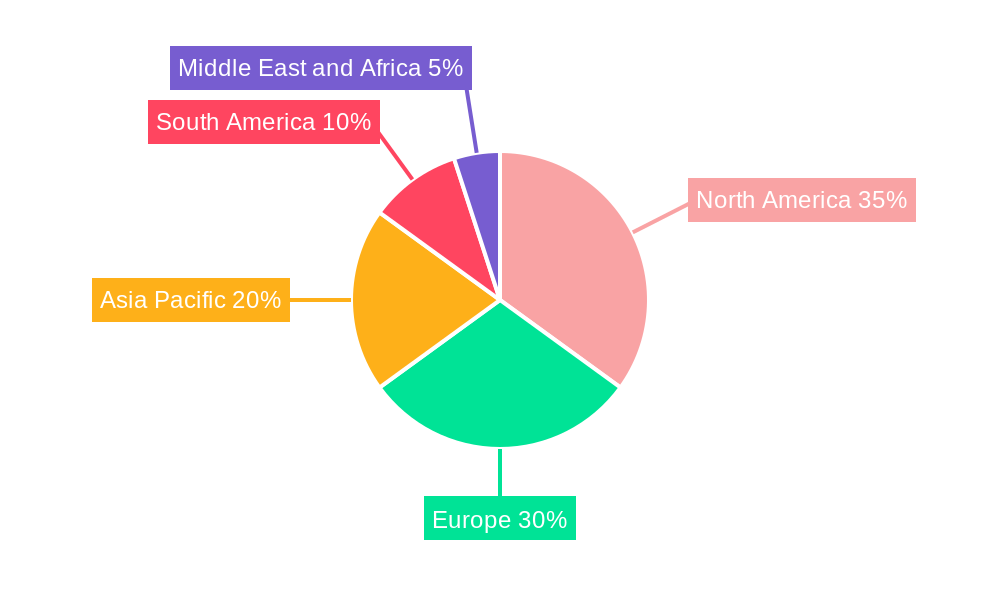
The dairy and dairy alternatives segment dominates the lactose-free food market, accounting for the largest revenue share. Within this segment, plant-based milk alternatives (oat, almond, soy) are experiencing the most significant growth. Supermarkets/hypermarkets remain the primary distribution channel, however online retail is exhibiting rapid growth. North America and Europe are currently the leading regions, driven by high levels of lactose intolerance, consumer awareness, and robust retail infrastructure.
- Leading Segment: Dairy and Dairy Alternatives
- Key Drivers in North America and Europe:
- High prevalence of lactose intolerance
- Strong consumer awareness of health and wellness
- Well-developed retail infrastructure
- High disposable incomes
- Growth in Emerging Markets: Driven by rising disposable incomes, increasing urbanization, and changing dietary habits.
Lactose-Free Food Industry Product Innovations
Recent innovations in the lactose-free food industry focus on enhancing taste, texture, and nutritional value of products. Advancements in enzyme technology and ingredient formulation allow manufacturers to replicate the taste and texture of traditional dairy products without the lactose. Plant-based alternatives are constantly improving in terms of taste, functionality, and sustainability. These innovations are crucial in attracting consumers who may be hesitant to switch to lactose-free options due to perceived taste differences. The market is also witnessing an increasing focus on fortified products, enriching lactose-free options with essential vitamins and minerals.
Report Segmentation & Scope
This report segments the lactose-free food market across various parameters:
Product Type: Bakery Products, Confectionery Products, Dairy and Dairy Alternatives, Meat and Seafood, Sauces, Condiments and Dressings, Other Product Types. Dairy and Dairy Alternatives is expected to maintain its lead, driven by innovation in plant-based alternatives.
Labeling Type: Gluten-Free Food, Lactose-Free Food, Other Labeling Types. Lactose-Free Food is the primary focus, but overlap with Gluten-Free products is also analyzed.
Distribution Channel: Supermarkets/Hypermarkets, Convenience/Grocery Stores, Online Retail Stores, Other Distribution Channels. Online retail channels are predicted to experience the highest growth rate.
Each segment's growth projection, market size, and competitive dynamics are detailed within the full report.
Key Drivers of Lactose-Free Food Industry Growth
Several factors fuel the lactose-free food industry’s growth. The rising prevalence of lactose intolerance worldwide is a primary driver. Growing consumer health consciousness and demand for healthier alternatives are also significant factors. Technological advancements enabling the creation of palatable lactose-free products play a crucial role. Stringent regulations mandating clear labeling and accurate information also contribute to market growth by increasing consumer confidence. Finally, the rise of plant-based alternatives, fueled by sustainability concerns, is further driving market expansion.
Challenges in the Lactose-Free Food Industry Sector
The lactose-free food industry faces challenges. Maintaining consistent product quality and taste can be difficult. The cost of production for some lactose-free ingredients can be higher than traditional alternatives. Strict regulatory requirements and labeling regulations add complexity and costs. Competition from established players and new entrants remains intense. Supply chain disruptions can impact production and distribution. These factors can collectively impact profitability and market expansion.
Leading Players in the Lactose-Free Food Industry Market
- Reckitt Benckiser Group PLC
- The Kellogg Company
- Nestle S.A.
- General Mills Inc.
- Abbott Laboratories
- Danone SA
- Dr. Schar AG / SPA
- Blue Diamond Growers
- Oatly Group AB
- Beyond Meat
Key Developments in Lactose-Free Food Industry Sector
- October 2022: Beyond Meat partnered with Allana Group to introduce plant-based meat products in India, expanding its market reach.
- May 2022: Danone launched Silk Nextmilk, a dairy-free beverage targeting dairy consumers in Canada, demonstrating innovation in plant-based alternatives.
- February 2023: Life Health Foods Pvt. Ltd. launched So Good Oat unsweetened beverage, broadening the range of plant-based milk alternatives.
Strategic Lactose-Free Food Industry Market Outlook
The lactose-free food industry presents significant growth opportunities. Expanding into emerging markets with rising disposable incomes and growing health awareness offers substantial potential. Innovation in product development, particularly in taste and texture, will be critical for attracting new consumers. Strategic partnerships and M&A activity will continue to shape the industry landscape. Investing in sustainable and ethical sourcing of ingredients will be crucial for long-term success. Focusing on convenient and ready-to-consume products will further boost market growth.
Lactose Free Food Industry Segmentation
-
1. Product Type
- 1.1. Bakery Products
- 1.2. Confectionery Prodcuts
- 1.3. Dairy and Dairy Alternatives
- 1.4. Meat and Seafood
- 1.5. Sauces, Condiments and Dressings
- 1.6. Other Product Types
-
2. Labeling Type
- 2.1. Gluten-Free Food
- 2.2. Lactose-Free Food
- 2.3. Other Labeling Types
-
3. Distribution Channel
- 3.1. Supermarkets/Hypermarkets
- 3.2. Convenience/Grocery Stores
- 3.3. Online Retail Stores
- 3.4. Other Distribution Channels
Lactose Free Food Industry Segmentation By Geography
-
1. North America
- 1.1. United States
- 1.2. Canada
- 1.3. Mexico
- 1.4. Rest of North America
-
2. Europe
- 2.1. Spain
- 2.2. United Kingdom
- 2.3. Germany
- 2.4. France
- 2.5. Italy
- 2.6. Russia
- 2.7. Rest of Europe
-
3. Asia Pacific
- 3.1. China
- 3.2. Japan
- 3.3. India
- 3.4. Australia
- 3.5. Rest of Asia Pacific
-
4. South America
- 4.1. Brazil
- 4.2. Argentina
- 4.3. Rest of South America
-
5. Middle East and Africa
- 5.1. South Africa
- 5.2. United Arab Emirates
- 5.3. Rest of Middle East and Africa
Lactose Free Food Industry REPORT HIGHLIGHTS
| Aspects | Details |
|---|---|
| Study Period | 2019-2033 |
| Base Year | 2024 |
| Estimated Year | 2025 |
| Forecast Period | 2025-2033 |
| Historical Period | 2019-2024 |
| Growth Rate | CAGR of 7.79% from 2019-2033 |
| Segmentation |
|
Table of Contents
- 1. Introduction
- 1.1. Research Scope
- 1.2. Market Segmentation
- 1.3. Research Methodology
- 1.4. Definitions and Assumptions
- 2. Executive Summary
- 2.1. Introduction
- 3. Market Dynamics
- 3.1. Introduction
- 3.2. Market Drivers
- 3.2.1. Increasing Demand for Clean Label Ingredients; Growing Health Consciousness of Consumers
- 3.3. Market Restrains
- 3.3.1. Higher Manufacturing Cost
- 3.4. Market Trends
- 3.4.1. Surge in Demand of Clean Label and Free From Ingredients
- 4. Market Factor Analysis
- 4.1. Porters Five Forces
- 4.2. Supply/Value Chain
- 4.3. PESTEL analysis
- 4.4. Market Entropy
- 4.5. Patent/Trademark Analysis
- 5. Global Lactose Free Food Industry Analysis, Insights and Forecast, 2019-2031
- 5.1. Market Analysis, Insights and Forecast - by Product Type
- 5.1.1. Bakery Products
- 5.1.2. Confectionery Prodcuts
- 5.1.3. Dairy and Dairy Alternatives
- 5.1.4. Meat and Seafood
- 5.1.5. Sauces, Condiments and Dressings
- 5.1.6. Other Product Types
- 5.2. Market Analysis, Insights and Forecast - by Labeling Type
- 5.2.1. Gluten-Free Food
- 5.2.2. Lactose-Free Food
- 5.2.3. Other Labeling Types
- 5.3. Market Analysis, Insights and Forecast - by Distribution Channel
- 5.3.1. Supermarkets/Hypermarkets
- 5.3.2. Convenience/Grocery Stores
- 5.3.3. Online Retail Stores
- 5.3.4. Other Distribution Channels
- 5.4. Market Analysis, Insights and Forecast - by Region
- 5.4.1. North America
- 5.4.2. Europe
- 5.4.3. Asia Pacific
- 5.4.4. South America
- 5.4.5. Middle East and Africa
- 5.1. Market Analysis, Insights and Forecast - by Product Type
- 6. North America Lactose Free Food Industry Analysis, Insights and Forecast, 2019-2031
- 6.1. Market Analysis, Insights and Forecast - by Product Type
- 6.1.1. Bakery Products
- 6.1.2. Confectionery Prodcuts
- 6.1.3. Dairy and Dairy Alternatives
- 6.1.4. Meat and Seafood
- 6.1.5. Sauces, Condiments and Dressings
- 6.1.6. Other Product Types
- 6.2. Market Analysis, Insights and Forecast - by Labeling Type
- 6.2.1. Gluten-Free Food
- 6.2.2. Lactose-Free Food
- 6.2.3. Other Labeling Types
- 6.3. Market Analysis, Insights and Forecast - by Distribution Channel
- 6.3.1. Supermarkets/Hypermarkets
- 6.3.2. Convenience/Grocery Stores
- 6.3.3. Online Retail Stores
- 6.3.4. Other Distribution Channels
- 6.1. Market Analysis, Insights and Forecast - by Product Type
- 7. Europe Lactose Free Food Industry Analysis, Insights and Forecast, 2019-2031
- 7.1. Market Analysis, Insights and Forecast - by Product Type
- 7.1.1. Bakery Products
- 7.1.2. Confectionery Prodcuts
- 7.1.3. Dairy and Dairy Alternatives
- 7.1.4. Meat and Seafood
- 7.1.5. Sauces, Condiments and Dressings
- 7.1.6. Other Product Types
- 7.2. Market Analysis, Insights and Forecast - by Labeling Type
- 7.2.1. Gluten-Free Food
- 7.2.2. Lactose-Free Food
- 7.2.3. Other Labeling Types
- 7.3. Market Analysis, Insights and Forecast - by Distribution Channel
- 7.3.1. Supermarkets/Hypermarkets
- 7.3.2. Convenience/Grocery Stores
- 7.3.3. Online Retail Stores
- 7.3.4. Other Distribution Channels
- 7.1. Market Analysis, Insights and Forecast - by Product Type
- 8. Asia Pacific Lactose Free Food Industry Analysis, Insights and Forecast, 2019-2031
- 8.1. Market Analysis, Insights and Forecast - by Product Type
- 8.1.1. Bakery Products
- 8.1.2. Confectionery Prodcuts
- 8.1.3. Dairy and Dairy Alternatives
- 8.1.4. Meat and Seafood
- 8.1.5. Sauces, Condiments and Dressings
- 8.1.6. Other Product Types
- 8.2. Market Analysis, Insights and Forecast - by Labeling Type
- 8.2.1. Gluten-Free Food
- 8.2.2. Lactose-Free Food
- 8.2.3. Other Labeling Types
- 8.3. Market Analysis, Insights and Forecast - by Distribution Channel
- 8.3.1. Supermarkets/Hypermarkets
- 8.3.2. Convenience/Grocery Stores
- 8.3.3. Online Retail Stores
- 8.3.4. Other Distribution Channels
- 8.1. Market Analysis, Insights and Forecast - by Product Type
- 9. South America Lactose Free Food Industry Analysis, Insights and Forecast, 2019-2031
- 9.1. Market Analysis, Insights and Forecast - by Product Type
- 9.1.1. Bakery Products
- 9.1.2. Confectionery Prodcuts
- 9.1.3. Dairy and Dairy Alternatives
- 9.1.4. Meat and Seafood
- 9.1.5. Sauces, Condiments and Dressings
- 9.1.6. Other Product Types
- 9.2. Market Analysis, Insights and Forecast - by Labeling Type
- 9.2.1. Gluten-Free Food
- 9.2.2. Lactose-Free Food
- 9.2.3. Other Labeling Types
- 9.3. Market Analysis, Insights and Forecast - by Distribution Channel
- 9.3.1. Supermarkets/Hypermarkets
- 9.3.2. Convenience/Grocery Stores
- 9.3.3. Online Retail Stores
- 9.3.4. Other Distribution Channels
- 9.1. Market Analysis, Insights and Forecast - by Product Type
- 10. Middle East and Africa Lactose Free Food Industry Analysis, Insights and Forecast, 2019-2031
- 10.1. Market Analysis, Insights and Forecast - by Product Type
- 10.1.1. Bakery Products
- 10.1.2. Confectionery Prodcuts
- 10.1.3. Dairy and Dairy Alternatives
- 10.1.4. Meat and Seafood
- 10.1.5. Sauces, Condiments and Dressings
- 10.1.6. Other Product Types
- 10.2. Market Analysis, Insights and Forecast - by Labeling Type
- 10.2.1. Gluten-Free Food
- 10.2.2. Lactose-Free Food
- 10.2.3. Other Labeling Types
- 10.3. Market Analysis, Insights and Forecast - by Distribution Channel
- 10.3.1. Supermarkets/Hypermarkets
- 10.3.2. Convenience/Grocery Stores
- 10.3.3. Online Retail Stores
- 10.3.4. Other Distribution Channels
- 10.1. Market Analysis, Insights and Forecast - by Product Type
- 11. North America Lactose Free Food Industry Analysis, Insights and Forecast, 2019-2031
- 11.1. Market Analysis, Insights and Forecast - By Country/Sub-region
- 11.1.1 United States
- 11.1.2 Canada
- 11.1.3 Mexico
- 11.1.4 Rest of North America
- 12. Europe Lactose Free Food Industry Analysis, Insights and Forecast, 2019-2031
- 12.1. Market Analysis, Insights and Forecast - By Country/Sub-region
- 12.1.1 Spain
- 12.1.2 United Kingdom
- 12.1.3 Germany
- 12.1.4 France
- 12.1.5 Italy
- 12.1.6 Russia
- 12.1.7 Rest of Europe
- 13. Asia Pacific Lactose Free Food Industry Analysis, Insights and Forecast, 2019-2031
- 13.1. Market Analysis, Insights and Forecast - By Country/Sub-region
- 13.1.1 China
- 13.1.2 Japan
- 13.1.3 India
- 13.1.4 Australia
- 13.1.5 Rest of Asia Pacific
- 14. South America Lactose Free Food Industry Analysis, Insights and Forecast, 2019-2031
- 14.1. Market Analysis, Insights and Forecast - By Country/Sub-region
- 14.1.1 Brazil
- 14.1.2 Argentina
- 14.1.3 Rest of South America
- 15. Middle East and Africa Lactose Free Food Industry Analysis, Insights and Forecast, 2019-2031
- 15.1. Market Analysis, Insights and Forecast - By Country/Sub-region
- 15.1.1 South Africa
- 15.1.2 United Arab Emirates
- 15.1.3 Rest of Middle East and Africa
- 16. Competitive Analysis
- 16.1. Global Market Share Analysis 2024
- 16.2. Company Profiles
- 16.2.1 Reckitt Benckiser Group PLC
- 16.2.1.1. Overview
- 16.2.1.2. Products
- 16.2.1.3. SWOT Analysis
- 16.2.1.4. Recent Developments
- 16.2.1.5. Financials (Based on Availability)
- 16.2.2 The Kellogg Company
- 16.2.2.1. Overview
- 16.2.2.2. Products
- 16.2.2.3. SWOT Analysis
- 16.2.2.4. Recent Developments
- 16.2.2.5. Financials (Based on Availability)
- 16.2.3 Nestle S A
- 16.2.3.1. Overview
- 16.2.3.2. Products
- 16.2.3.3. SWOT Analysis
- 16.2.3.4. Recent Developments
- 16.2.3.5. Financials (Based on Availability)
- 16.2.4 General Mills Inc
- 16.2.4.1. Overview
- 16.2.4.2. Products
- 16.2.4.3. SWOT Analysis
- 16.2.4.4. Recent Developments
- 16.2.4.5. Financials (Based on Availability)
- 16.2.5 Abbott Laboratories
- 16.2.5.1. Overview
- 16.2.5.2. Products
- 16.2.5.3. SWOT Analysis
- 16.2.5.4. Recent Developments
- 16.2.5.5. Financials (Based on Availability)
- 16.2.6 Danone SA
- 16.2.6.1. Overview
- 16.2.6.2. Products
- 16.2.6.3. SWOT Analysis
- 16.2.6.4. Recent Developments
- 16.2.6.5. Financials (Based on Availability)
- 16.2.7 Dr Schar AG / SPA*List Not Exhaustive
- 16.2.7.1. Overview
- 16.2.7.2. Products
- 16.2.7.3. SWOT Analysis
- 16.2.7.4. Recent Developments
- 16.2.7.5. Financials (Based on Availability)
- 16.2.8 Blue Diamond Growers
- 16.2.8.1. Overview
- 16.2.8.2. Products
- 16.2.8.3. SWOT Analysis
- 16.2.8.4. Recent Developments
- 16.2.8.5. Financials (Based on Availability)
- 16.2.9 Oatly Group AB
- 16.2.9.1. Overview
- 16.2.9.2. Products
- 16.2.9.3. SWOT Analysis
- 16.2.9.4. Recent Developments
- 16.2.9.5. Financials (Based on Availability)
- 16.2.10 Beyond Meat
- 16.2.10.1. Overview
- 16.2.10.2. Products
- 16.2.10.3. SWOT Analysis
- 16.2.10.4. Recent Developments
- 16.2.10.5. Financials (Based on Availability)
- 16.2.1 Reckitt Benckiser Group PLC
List of Figures
- Figure 1: Global Lactose Free Food Industry Revenue Breakdown (Million, %) by Region 2024 & 2032
- Figure 2: Global Lactose Free Food Industry Volume Breakdown (K Tons, %) by Region 2024 & 2032
- Figure 3: North America Lactose Free Food Industry Revenue (Million), by Country 2024 & 2032
- Figure 4: North America Lactose Free Food Industry Volume (K Tons), by Country 2024 & 2032
- Figure 5: North America Lactose Free Food Industry Revenue Share (%), by Country 2024 & 2032
- Figure 6: North America Lactose Free Food Industry Volume Share (%), by Country 2024 & 2032
- Figure 7: Europe Lactose Free Food Industry Revenue (Million), by Country 2024 & 2032
- Figure 8: Europe Lactose Free Food Industry Volume (K Tons), by Country 2024 & 2032
- Figure 9: Europe Lactose Free Food Industry Revenue Share (%), by Country 2024 & 2032
- Figure 10: Europe Lactose Free Food Industry Volume Share (%), by Country 2024 & 2032
- Figure 11: Asia Pacific Lactose Free Food Industry Revenue (Million), by Country 2024 & 2032
- Figure 12: Asia Pacific Lactose Free Food Industry Volume (K Tons), by Country 2024 & 2032
- Figure 13: Asia Pacific Lactose Free Food Industry Revenue Share (%), by Country 2024 & 2032
- Figure 14: Asia Pacific Lactose Free Food Industry Volume Share (%), by Country 2024 & 2032
- Figure 15: South America Lactose Free Food Industry Revenue (Million), by Country 2024 & 2032
- Figure 16: South America Lactose Free Food Industry Volume (K Tons), by Country 2024 & 2032
- Figure 17: South America Lactose Free Food Industry Revenue Share (%), by Country 2024 & 2032
- Figure 18: South America Lactose Free Food Industry Volume Share (%), by Country 2024 & 2032
- Figure 19: Middle East and Africa Lactose Free Food Industry Revenue (Million), by Country 2024 & 2032
- Figure 20: Middle East and Africa Lactose Free Food Industry Volume (K Tons), by Country 2024 & 2032
- Figure 21: Middle East and Africa Lactose Free Food Industry Revenue Share (%), by Country 2024 & 2032
- Figure 22: Middle East and Africa Lactose Free Food Industry Volume Share (%), by Country 2024 & 2032
- Figure 23: North America Lactose Free Food Industry Revenue (Million), by Product Type 2024 & 2032
- Figure 24: North America Lactose Free Food Industry Volume (K Tons), by Product Type 2024 & 2032
- Figure 25: North America Lactose Free Food Industry Revenue Share (%), by Product Type 2024 & 2032
- Figure 26: North America Lactose Free Food Industry Volume Share (%), by Product Type 2024 & 2032
- Figure 27: North America Lactose Free Food Industry Revenue (Million), by Labeling Type 2024 & 2032
- Figure 28: North America Lactose Free Food Industry Volume (K Tons), by Labeling Type 2024 & 2032
- Figure 29: North America Lactose Free Food Industry Revenue Share (%), by Labeling Type 2024 & 2032
- Figure 30: North America Lactose Free Food Industry Volume Share (%), by Labeling Type 2024 & 2032
- Figure 31: North America Lactose Free Food Industry Revenue (Million), by Distribution Channel 2024 & 2032
- Figure 32: North America Lactose Free Food Industry Volume (K Tons), by Distribution Channel 2024 & 2032
- Figure 33: North America Lactose Free Food Industry Revenue Share (%), by Distribution Channel 2024 & 2032
- Figure 34: North America Lactose Free Food Industry Volume Share (%), by Distribution Channel 2024 & 2032
- Figure 35: North America Lactose Free Food Industry Revenue (Million), by Country 2024 & 2032
- Figure 36: North America Lactose Free Food Industry Volume (K Tons), by Country 2024 & 2032
- Figure 37: North America Lactose Free Food Industry Revenue Share (%), by Country 2024 & 2032
- Figure 38: North America Lactose Free Food Industry Volume Share (%), by Country 2024 & 2032
- Figure 39: Europe Lactose Free Food Industry Revenue (Million), by Product Type 2024 & 2032
- Figure 40: Europe Lactose Free Food Industry Volume (K Tons), by Product Type 2024 & 2032
- Figure 41: Europe Lactose Free Food Industry Revenue Share (%), by Product Type 2024 & 2032
- Figure 42: Europe Lactose Free Food Industry Volume Share (%), by Product Type 2024 & 2032
- Figure 43: Europe Lactose Free Food Industry Revenue (Million), by Labeling Type 2024 & 2032
- Figure 44: Europe Lactose Free Food Industry Volume (K Tons), by Labeling Type 2024 & 2032
- Figure 45: Europe Lactose Free Food Industry Revenue Share (%), by Labeling Type 2024 & 2032
- Figure 46: Europe Lactose Free Food Industry Volume Share (%), by Labeling Type 2024 & 2032
- Figure 47: Europe Lactose Free Food Industry Revenue (Million), by Distribution Channel 2024 & 2032
- Figure 48: Europe Lactose Free Food Industry Volume (K Tons), by Distribution Channel 2024 & 2032
- Figure 49: Europe Lactose Free Food Industry Revenue Share (%), by Distribution Channel 2024 & 2032
- Figure 50: Europe Lactose Free Food Industry Volume Share (%), by Distribution Channel 2024 & 2032
- Figure 51: Europe Lactose Free Food Industry Revenue (Million), by Country 2024 & 2032
- Figure 52: Europe Lactose Free Food Industry Volume (K Tons), by Country 2024 & 2032
- Figure 53: Europe Lactose Free Food Industry Revenue Share (%), by Country 2024 & 2032
- Figure 54: Europe Lactose Free Food Industry Volume Share (%), by Country 2024 & 2032
- Figure 55: Asia Pacific Lactose Free Food Industry Revenue (Million), by Product Type 2024 & 2032
- Figure 56: Asia Pacific Lactose Free Food Industry Volume (K Tons), by Product Type 2024 & 2032
- Figure 57: Asia Pacific Lactose Free Food Industry Revenue Share (%), by Product Type 2024 & 2032
- Figure 58: Asia Pacific Lactose Free Food Industry Volume Share (%), by Product Type 2024 & 2032
- Figure 59: Asia Pacific Lactose Free Food Industry Revenue (Million), by Labeling Type 2024 & 2032
- Figure 60: Asia Pacific Lactose Free Food Industry Volume (K Tons), by Labeling Type 2024 & 2032
- Figure 61: Asia Pacific Lactose Free Food Industry Revenue Share (%), by Labeling Type 2024 & 2032
- Figure 62: Asia Pacific Lactose Free Food Industry Volume Share (%), by Labeling Type 2024 & 2032
- Figure 63: Asia Pacific Lactose Free Food Industry Revenue (Million), by Distribution Channel 2024 & 2032
- Figure 64: Asia Pacific Lactose Free Food Industry Volume (K Tons), by Distribution Channel 2024 & 2032
- Figure 65: Asia Pacific Lactose Free Food Industry Revenue Share (%), by Distribution Channel 2024 & 2032
- Figure 66: Asia Pacific Lactose Free Food Industry Volume Share (%), by Distribution Channel 2024 & 2032
- Figure 67: Asia Pacific Lactose Free Food Industry Revenue (Million), by Country 2024 & 2032
- Figure 68: Asia Pacific Lactose Free Food Industry Volume (K Tons), by Country 2024 & 2032
- Figure 69: Asia Pacific Lactose Free Food Industry Revenue Share (%), by Country 2024 & 2032
- Figure 70: Asia Pacific Lactose Free Food Industry Volume Share (%), by Country 2024 & 2032
- Figure 71: South America Lactose Free Food Industry Revenue (Million), by Product Type 2024 & 2032
- Figure 72: South America Lactose Free Food Industry Volume (K Tons), by Product Type 2024 & 2032
- Figure 73: South America Lactose Free Food Industry Revenue Share (%), by Product Type 2024 & 2032
- Figure 74: South America Lactose Free Food Industry Volume Share (%), by Product Type 2024 & 2032
- Figure 75: South America Lactose Free Food Industry Revenue (Million), by Labeling Type 2024 & 2032
- Figure 76: South America Lactose Free Food Industry Volume (K Tons), by Labeling Type 2024 & 2032
- Figure 77: South America Lactose Free Food Industry Revenue Share (%), by Labeling Type 2024 & 2032
- Figure 78: South America Lactose Free Food Industry Volume Share (%), by Labeling Type 2024 & 2032
- Figure 79: South America Lactose Free Food Industry Revenue (Million), by Distribution Channel 2024 & 2032
- Figure 80: South America Lactose Free Food Industry Volume (K Tons), by Distribution Channel 2024 & 2032
- Figure 81: South America Lactose Free Food Industry Revenue Share (%), by Distribution Channel 2024 & 2032
- Figure 82: South America Lactose Free Food Industry Volume Share (%), by Distribution Channel 2024 & 2032
- Figure 83: South America Lactose Free Food Industry Revenue (Million), by Country 2024 & 2032
- Figure 84: South America Lactose Free Food Industry Volume (K Tons), by Country 2024 & 2032
- Figure 85: South America Lactose Free Food Industry Revenue Share (%), by Country 2024 & 2032
- Figure 86: South America Lactose Free Food Industry Volume Share (%), by Country 2024 & 2032
- Figure 87: Middle East and Africa Lactose Free Food Industry Revenue (Million), by Product Type 2024 & 2032
- Figure 88: Middle East and Africa Lactose Free Food Industry Volume (K Tons), by Product Type 2024 & 2032
- Figure 89: Middle East and Africa Lactose Free Food Industry Revenue Share (%), by Product Type 2024 & 2032
- Figure 90: Middle East and Africa Lactose Free Food Industry Volume Share (%), by Product Type 2024 & 2032
- Figure 91: Middle East and Africa Lactose Free Food Industry Revenue (Million), by Labeling Type 2024 & 2032
- Figure 92: Middle East and Africa Lactose Free Food Industry Volume (K Tons), by Labeling Type 2024 & 2032
- Figure 93: Middle East and Africa Lactose Free Food Industry Revenue Share (%), by Labeling Type 2024 & 2032
- Figure 94: Middle East and Africa Lactose Free Food Industry Volume Share (%), by Labeling Type 2024 & 2032
- Figure 95: Middle East and Africa Lactose Free Food Industry Revenue (Million), by Distribution Channel 2024 & 2032
- Figure 96: Middle East and Africa Lactose Free Food Industry Volume (K Tons), by Distribution Channel 2024 & 2032
- Figure 97: Middle East and Africa Lactose Free Food Industry Revenue Share (%), by Distribution Channel 2024 & 2032
- Figure 98: Middle East and Africa Lactose Free Food Industry Volume Share (%), by Distribution Channel 2024 & 2032
- Figure 99: Middle East and Africa Lactose Free Food Industry Revenue (Million), by Country 2024 & 2032
- Figure 100: Middle East and Africa Lactose Free Food Industry Volume (K Tons), by Country 2024 & 2032
- Figure 101: Middle East and Africa Lactose Free Food Industry Revenue Share (%), by Country 2024 & 2032
- Figure 102: Middle East and Africa Lactose Free Food Industry Volume Share (%), by Country 2024 & 2032
List of Tables
- Table 1: Global Lactose Free Food Industry Revenue Million Forecast, by Region 2019 & 2032
- Table 2: Global Lactose Free Food Industry Volume K Tons Forecast, by Region 2019 & 2032
- Table 3: Global Lactose Free Food Industry Revenue Million Forecast, by Product Type 2019 & 2032
- Table 4: Global Lactose Free Food Industry Volume K Tons Forecast, by Product Type 2019 & 2032
- Table 5: Global Lactose Free Food Industry Revenue Million Forecast, by Labeling Type 2019 & 2032
- Table 6: Global Lactose Free Food Industry Volume K Tons Forecast, by Labeling Type 2019 & 2032
- Table 7: Global Lactose Free Food Industry Revenue Million Forecast, by Distribution Channel 2019 & 2032
- Table 8: Global Lactose Free Food Industry Volume K Tons Forecast, by Distribution Channel 2019 & 2032
- Table 9: Global Lactose Free Food Industry Revenue Million Forecast, by Region 2019 & 2032
- Table 10: Global Lactose Free Food Industry Volume K Tons Forecast, by Region 2019 & 2032
- Table 11: Global Lactose Free Food Industry Revenue Million Forecast, by Country 2019 & 2032
- Table 12: Global Lactose Free Food Industry Volume K Tons Forecast, by Country 2019 & 2032
- Table 13: United States Lactose Free Food Industry Revenue (Million) Forecast, by Application 2019 & 2032
- Table 14: United States Lactose Free Food Industry Volume (K Tons) Forecast, by Application 2019 & 2032
- Table 15: Canada Lactose Free Food Industry Revenue (Million) Forecast, by Application 2019 & 2032
- Table 16: Canada Lactose Free Food Industry Volume (K Tons) Forecast, by Application 2019 & 2032
- Table 17: Mexico Lactose Free Food Industry Revenue (Million) Forecast, by Application 2019 & 2032
- Table 18: Mexico Lactose Free Food Industry Volume (K Tons) Forecast, by Application 2019 & 2032
- Table 19: Rest of North America Lactose Free Food Industry Revenue (Million) Forecast, by Application 2019 & 2032
- Table 20: Rest of North America Lactose Free Food Industry Volume (K Tons) Forecast, by Application 2019 & 2032
- Table 21: Global Lactose Free Food Industry Revenue Million Forecast, by Country 2019 & 2032
- Table 22: Global Lactose Free Food Industry Volume K Tons Forecast, by Country 2019 & 2032
- Table 23: Spain Lactose Free Food Industry Revenue (Million) Forecast, by Application 2019 & 2032
- Table 24: Spain Lactose Free Food Industry Volume (K Tons) Forecast, by Application 2019 & 2032
- Table 25: United Kingdom Lactose Free Food Industry Revenue (Million) Forecast, by Application 2019 & 2032
- Table 26: United Kingdom Lactose Free Food Industry Volume (K Tons) Forecast, by Application 2019 & 2032
- Table 27: Germany Lactose Free Food Industry Revenue (Million) Forecast, by Application 2019 & 2032
- Table 28: Germany Lactose Free Food Industry Volume (K Tons) Forecast, by Application 2019 & 2032
- Table 29: France Lactose Free Food Industry Revenue (Million) Forecast, by Application 2019 & 2032
- Table 30: France Lactose Free Food Industry Volume (K Tons) Forecast, by Application 2019 & 2032
- Table 31: Italy Lactose Free Food Industry Revenue (Million) Forecast, by Application 2019 & 2032
- Table 32: Italy Lactose Free Food Industry Volume (K Tons) Forecast, by Application 2019 & 2032
- Table 33: Russia Lactose Free Food Industry Revenue (Million) Forecast, by Application 2019 & 2032
- Table 34: Russia Lactose Free Food Industry Volume (K Tons) Forecast, by Application 2019 & 2032
- Table 35: Rest of Europe Lactose Free Food Industry Revenue (Million) Forecast, by Application 2019 & 2032
- Table 36: Rest of Europe Lactose Free Food Industry Volume (K Tons) Forecast, by Application 2019 & 2032
- Table 37: Global Lactose Free Food Industry Revenue Million Forecast, by Country 2019 & 2032
- Table 38: Global Lactose Free Food Industry Volume K Tons Forecast, by Country 2019 & 2032
- Table 39: China Lactose Free Food Industry Revenue (Million) Forecast, by Application 2019 & 2032
- Table 40: China Lactose Free Food Industry Volume (K Tons) Forecast, by Application 2019 & 2032
- Table 41: Japan Lactose Free Food Industry Revenue (Million) Forecast, by Application 2019 & 2032
- Table 42: Japan Lactose Free Food Industry Volume (K Tons) Forecast, by Application 2019 & 2032
- Table 43: India Lactose Free Food Industry Revenue (Million) Forecast, by Application 2019 & 2032
- Table 44: India Lactose Free Food Industry Volume (K Tons) Forecast, by Application 2019 & 2032
- Table 45: Australia Lactose Free Food Industry Revenue (Million) Forecast, by Application 2019 & 2032
- Table 46: Australia Lactose Free Food Industry Volume (K Tons) Forecast, by Application 2019 & 2032
- Table 47: Rest of Asia Pacific Lactose Free Food Industry Revenue (Million) Forecast, by Application 2019 & 2032
- Table 48: Rest of Asia Pacific Lactose Free Food Industry Volume (K Tons) Forecast, by Application 2019 & 2032
- Table 49: Global Lactose Free Food Industry Revenue Million Forecast, by Country 2019 & 2032
- Table 50: Global Lactose Free Food Industry Volume K Tons Forecast, by Country 2019 & 2032
- Table 51: Brazil Lactose Free Food Industry Revenue (Million) Forecast, by Application 2019 & 2032
- Table 52: Brazil Lactose Free Food Industry Volume (K Tons) Forecast, by Application 2019 & 2032
- Table 53: Argentina Lactose Free Food Industry Revenue (Million) Forecast, by Application 2019 & 2032
- Table 54: Argentina Lactose Free Food Industry Volume (K Tons) Forecast, by Application 2019 & 2032
- Table 55: Rest of South America Lactose Free Food Industry Revenue (Million) Forecast, by Application 2019 & 2032
- Table 56: Rest of South America Lactose Free Food Industry Volume (K Tons) Forecast, by Application 2019 & 2032
- Table 57: Global Lactose Free Food Industry Revenue Million Forecast, by Country 2019 & 2032
- Table 58: Global Lactose Free Food Industry Volume K Tons Forecast, by Country 2019 & 2032
- Table 59: South Africa Lactose Free Food Industry Revenue (Million) Forecast, by Application 2019 & 2032
- Table 60: South Africa Lactose Free Food Industry Volume (K Tons) Forecast, by Application 2019 & 2032
- Table 61: United Arab Emirates Lactose Free Food Industry Revenue (Million) Forecast, by Application 2019 & 2032
- Table 62: United Arab Emirates Lactose Free Food Industry Volume (K Tons) Forecast, by Application 2019 & 2032
- Table 63: Rest of Middle East and Africa Lactose Free Food Industry Revenue (Million) Forecast, by Application 2019 & 2032
- Table 64: Rest of Middle East and Africa Lactose Free Food Industry Volume (K Tons) Forecast, by Application 2019 & 2032
- Table 65: Global Lactose Free Food Industry Revenue Million Forecast, by Product Type 2019 & 2032
- Table 66: Global Lactose Free Food Industry Volume K Tons Forecast, by Product Type 2019 & 2032
- Table 67: Global Lactose Free Food Industry Revenue Million Forecast, by Labeling Type 2019 & 2032
- Table 68: Global Lactose Free Food Industry Volume K Tons Forecast, by Labeling Type 2019 & 2032
- Table 69: Global Lactose Free Food Industry Revenue Million Forecast, by Distribution Channel 2019 & 2032
- Table 70: Global Lactose Free Food Industry Volume K Tons Forecast, by Distribution Channel 2019 & 2032
- Table 71: Global Lactose Free Food Industry Revenue Million Forecast, by Country 2019 & 2032
- Table 72: Global Lactose Free Food Industry Volume K Tons Forecast, by Country 2019 & 2032
- Table 73: United States Lactose Free Food Industry Revenue (Million) Forecast, by Application 2019 & 2032
- Table 74: United States Lactose Free Food Industry Volume (K Tons) Forecast, by Application 2019 & 2032
- Table 75: Canada Lactose Free Food Industry Revenue (Million) Forecast, by Application 2019 & 2032
- Table 76: Canada Lactose Free Food Industry Volume (K Tons) Forecast, by Application 2019 & 2032
- Table 77: Mexico Lactose Free Food Industry Revenue (Million) Forecast, by Application 2019 & 2032
- Table 78: Mexico Lactose Free Food Industry Volume (K Tons) Forecast, by Application 2019 & 2032
- Table 79: Rest of North America Lactose Free Food Industry Revenue (Million) Forecast, by Application 2019 & 2032
- Table 80: Rest of North America Lactose Free Food Industry Volume (K Tons) Forecast, by Application 2019 & 2032
- Table 81: Global Lactose Free Food Industry Revenue Million Forecast, by Product Type 2019 & 2032
- Table 82: Global Lactose Free Food Industry Volume K Tons Forecast, by Product Type 2019 & 2032
- Table 83: Global Lactose Free Food Industry Revenue Million Forecast, by Labeling Type 2019 & 2032
- Table 84: Global Lactose Free Food Industry Volume K Tons Forecast, by Labeling Type 2019 & 2032
- Table 85: Global Lactose Free Food Industry Revenue Million Forecast, by Distribution Channel 2019 & 2032
- Table 86: Global Lactose Free Food Industry Volume K Tons Forecast, by Distribution Channel 2019 & 2032
- Table 87: Global Lactose Free Food Industry Revenue Million Forecast, by Country 2019 & 2032
- Table 88: Global Lactose Free Food Industry Volume K Tons Forecast, by Country 2019 & 2032
- Table 89: Spain Lactose Free Food Industry Revenue (Million) Forecast, by Application 2019 & 2032
- Table 90: Spain Lactose Free Food Industry Volume (K Tons) Forecast, by Application 2019 & 2032
- Table 91: United Kingdom Lactose Free Food Industry Revenue (Million) Forecast, by Application 2019 & 2032
- Table 92: United Kingdom Lactose Free Food Industry Volume (K Tons) Forecast, by Application 2019 & 2032
- Table 93: Germany Lactose Free Food Industry Revenue (Million) Forecast, by Application 2019 & 2032
- Table 94: Germany Lactose Free Food Industry Volume (K Tons) Forecast, by Application 2019 & 2032
- Table 95: France Lactose Free Food Industry Revenue (Million) Forecast, by Application 2019 & 2032
- Table 96: France Lactose Free Food Industry Volume (K Tons) Forecast, by Application 2019 & 2032
- Table 97: Italy Lactose Free Food Industry Revenue (Million) Forecast, by Application 2019 & 2032
- Table 98: Italy Lactose Free Food Industry Volume (K Tons) Forecast, by Application 2019 & 2032
- Table 99: Russia Lactose Free Food Industry Revenue (Million) Forecast, by Application 2019 & 2032
- Table 100: Russia Lactose Free Food Industry Volume (K Tons) Forecast, by Application 2019 & 2032
- Table 101: Rest of Europe Lactose Free Food Industry Revenue (Million) Forecast, by Application 2019 & 2032
- Table 102: Rest of Europe Lactose Free Food Industry Volume (K Tons) Forecast, by Application 2019 & 2032
- Table 103: Global Lactose Free Food Industry Revenue Million Forecast, by Product Type 2019 & 2032
- Table 104: Global Lactose Free Food Industry Volume K Tons Forecast, by Product Type 2019 & 2032
- Table 105: Global Lactose Free Food Industry Revenue Million Forecast, by Labeling Type 2019 & 2032
- Table 106: Global Lactose Free Food Industry Volume K Tons Forecast, by Labeling Type 2019 & 2032
- Table 107: Global Lactose Free Food Industry Revenue Million Forecast, by Distribution Channel 2019 & 2032
- Table 108: Global Lactose Free Food Industry Volume K Tons Forecast, by Distribution Channel 2019 & 2032
- Table 109: Global Lactose Free Food Industry Revenue Million Forecast, by Country 2019 & 2032
- Table 110: Global Lactose Free Food Industry Volume K Tons Forecast, by Country 2019 & 2032
- Table 111: China Lactose Free Food Industry Revenue (Million) Forecast, by Application 2019 & 2032
- Table 112: China Lactose Free Food Industry Volume (K Tons) Forecast, by Application 2019 & 2032
- Table 113: Japan Lactose Free Food Industry Revenue (Million) Forecast, by Application 2019 & 2032
- Table 114: Japan Lactose Free Food Industry Volume (K Tons) Forecast, by Application 2019 & 2032
- Table 115: India Lactose Free Food Industry Revenue (Million) Forecast, by Application 2019 & 2032
- Table 116: India Lactose Free Food Industry Volume (K Tons) Forecast, by Application 2019 & 2032
- Table 117: Australia Lactose Free Food Industry Revenue (Million) Forecast, by Application 2019 & 2032
- Table 118: Australia Lactose Free Food Industry Volume (K Tons) Forecast, by Application 2019 & 2032
- Table 119: Rest of Asia Pacific Lactose Free Food Industry Revenue (Million) Forecast, by Application 2019 & 2032
- Table 120: Rest of Asia Pacific Lactose Free Food Industry Volume (K Tons) Forecast, by Application 2019 & 2032
- Table 121: Global Lactose Free Food Industry Revenue Million Forecast, by Product Type 2019 & 2032
- Table 122: Global Lactose Free Food Industry Volume K Tons Forecast, by Product Type 2019 & 2032
- Table 123: Global Lactose Free Food Industry Revenue Million Forecast, by Labeling Type 2019 & 2032
- Table 124: Global Lactose Free Food Industry Volume K Tons Forecast, by Labeling Type 2019 & 2032
- Table 125: Global Lactose Free Food Industry Revenue Million Forecast, by Distribution Channel 2019 & 2032
- Table 126: Global Lactose Free Food Industry Volume K Tons Forecast, by Distribution Channel 2019 & 2032
- Table 127: Global Lactose Free Food Industry Revenue Million Forecast, by Country 2019 & 2032
- Table 128: Global Lactose Free Food Industry Volume K Tons Forecast, by Country 2019 & 2032
- Table 129: Brazil Lactose Free Food Industry Revenue (Million) Forecast, by Application 2019 & 2032
- Table 130: Brazil Lactose Free Food Industry Volume (K Tons) Forecast, by Application 2019 & 2032
- Table 131: Argentina Lactose Free Food Industry Revenue (Million) Forecast, by Application 2019 & 2032
- Table 132: Argentina Lactose Free Food Industry Volume (K Tons) Forecast, by Application 2019 & 2032
- Table 133: Rest of South America Lactose Free Food Industry Revenue (Million) Forecast, by Application 2019 & 2032
- Table 134: Rest of South America Lactose Free Food Industry Volume (K Tons) Forecast, by Application 2019 & 2032
- Table 135: Global Lactose Free Food Industry Revenue Million Forecast, by Product Type 2019 & 2032
- Table 136: Global Lactose Free Food Industry Volume K Tons Forecast, by Product Type 2019 & 2032
- Table 137: Global Lactose Free Food Industry Revenue Million Forecast, by Labeling Type 2019 & 2032
- Table 138: Global Lactose Free Food Industry Volume K Tons Forecast, by Labeling Type 2019 & 2032
- Table 139: Global Lactose Free Food Industry Revenue Million Forecast, by Distribution Channel 2019 & 2032
- Table 140: Global Lactose Free Food Industry Volume K Tons Forecast, by Distribution Channel 2019 & 2032
- Table 141: Global Lactose Free Food Industry Revenue Million Forecast, by Country 2019 & 2032
- Table 142: Global Lactose Free Food Industry Volume K Tons Forecast, by Country 2019 & 2032
- Table 143: South Africa Lactose Free Food Industry Revenue (Million) Forecast, by Application 2019 & 2032
- Table 144: South Africa Lactose Free Food Industry Volume (K Tons) Forecast, by Application 2019 & 2032
- Table 145: United Arab Emirates Lactose Free Food Industry Revenue (Million) Forecast, by Application 2019 & 2032
- Table 146: United Arab Emirates Lactose Free Food Industry Volume (K Tons) Forecast, by Application 2019 & 2032
- Table 147: Rest of Middle East and Africa Lactose Free Food Industry Revenue (Million) Forecast, by Application 2019 & 2032
- Table 148: Rest of Middle East and Africa Lactose Free Food Industry Volume (K Tons) Forecast, by Application 2019 & 2032
Frequently Asked Questions
1. What is the projected Compound Annual Growth Rate (CAGR) of the Lactose Free Food Industry?
The projected CAGR is approximately 7.79%.
2. Which companies are prominent players in the Lactose Free Food Industry?
Key companies in the market include Reckitt Benckiser Group PLC, The Kellogg Company, Nestle S A, General Mills Inc, Abbott Laboratories, Danone SA, Dr Schar AG / SPA*List Not Exhaustive, Blue Diamond Growers, Oatly Group AB, Beyond Meat.
3. What are the main segments of the Lactose Free Food Industry?
The market segments include Product Type, Labeling Type, Distribution Channel.
4. Can you provide details about the market size?
The market size is estimated to be USD 14,653.5 Million as of 2022.
5. What are some drivers contributing to market growth?
Increasing Demand for Clean Label Ingredients; Growing Health Consciousness of Consumers.
6. What are the notable trends driving market growth?
Surge in Demand of Clean Label and Free From Ingredients.
7. Are there any restraints impacting market growth?
Higher Manufacturing Cost.
8. Can you provide examples of recent developments in the market?
February 2023: Life Health Foods Pvt. Ltd. launched a new vegan drink, So Good Oat unsweetened beverage. The product is plant-based, dairy-free milk that can be used in tea, coffee, baking, and smoothies.
9. What pricing options are available for accessing the report?
Pricing options include single-user, multi-user, and enterprise licenses priced at USD 4750, USD 5250, and USD 8750 respectively.
10. Is the market size provided in terms of value or volume?
The market size is provided in terms of value, measured in Million and volume, measured in K Tons.
11. Are there any specific market keywords associated with the report?
Yes, the market keyword associated with the report is "Lactose Free Food Industry," which aids in identifying and referencing the specific market segment covered.
12. How do I determine which pricing option suits my needs best?
The pricing options vary based on user requirements and access needs. Individual users may opt for single-user licenses, while businesses requiring broader access may choose multi-user or enterprise licenses for cost-effective access to the report.
13. Are there any additional resources or data provided in the Lactose Free Food Industry report?
While the report offers comprehensive insights, it's advisable to review the specific contents or supplementary materials provided to ascertain if additional resources or data are available.
14. How can I stay updated on further developments or reports in the Lactose Free Food Industry?
To stay informed about further developments, trends, and reports in the Lactose Free Food Industry, consider subscribing to industry newsletters, following relevant companies and organizations, or regularly checking reputable industry news sources and publications.
Methodology
Step 1 - Identification of Relevant Samples Size from Population Database


Step 2 - Approaches for Defining Global Market Size (Value, Volume* & Price*)

Note*: In applicable scenarios
Step 3 - Data Sources
Primary Research
- Web Analytics
- Survey Reports
- Research Institute
- Latest Research Reports
- Opinion Leaders
Secondary Research
- Annual Reports
- White Paper
- Latest Press Release
- Industry Association
- Paid Database
- Investor Presentations

Step 4 - Data Triangulation
Involves using different sources of information in order to increase the validity of a study
These sources are likely to be stakeholders in a program - participants, other researchers, program staff, other community members, and so on.
Then we put all data in single framework & apply various statistical tools to find out the dynamic on the market.
During the analysis stage, feedback from the stakeholder groups would be compared to determine areas of agreement as well as areas of divergence


