
Key Insights
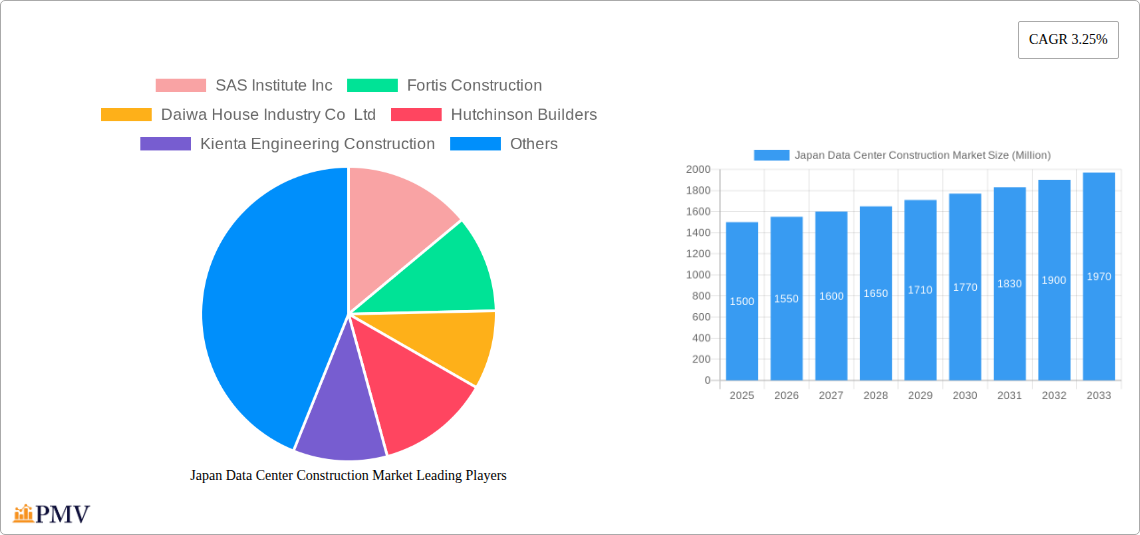
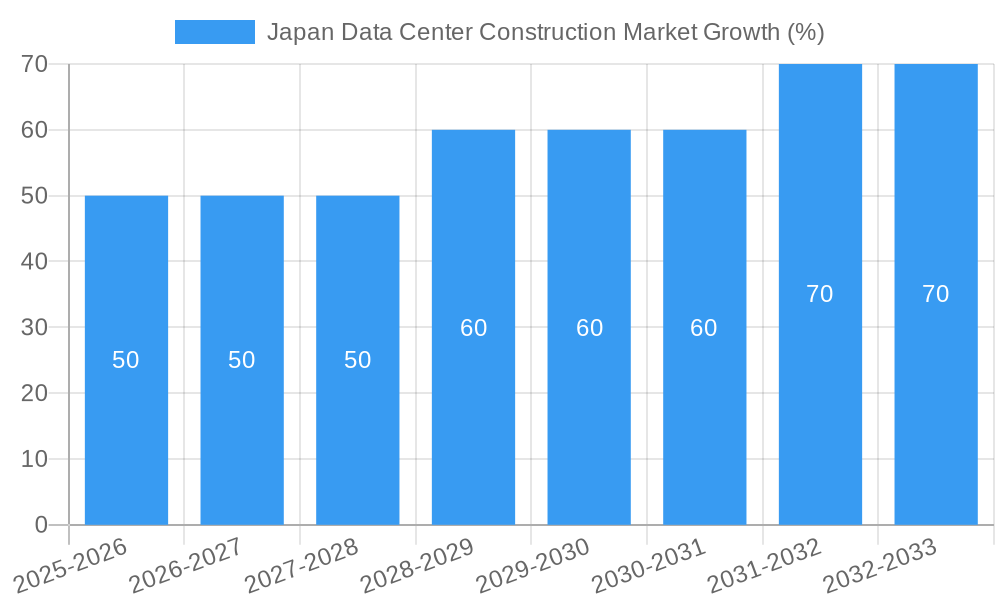
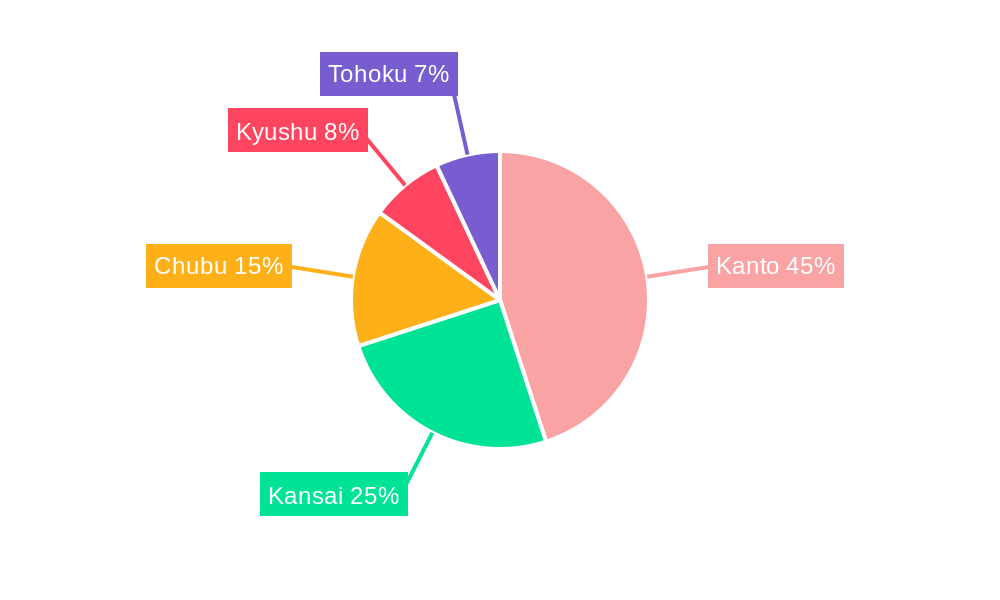
The Japan data center construction market, exhibiting a Compound Annual Growth Rate (CAGR) of 3.25%, presents a compelling investment opportunity. Driven by the increasing adoption of cloud computing, big data analytics, and the expanding digital economy, the market is poised for substantial growth throughout the forecast period (2025-2033). Key segments fueling this expansion include the burgeoning demand for large and mega data centers from IT & Telecommunication, BFSI, and Government sectors. The Kanto region, as the economic hub of Japan, is expected to dominate market share, followed by Kansai and Chubu. While the market faces challenges such as high land costs and stringent regulatory requirements, innovative cooling infrastructure solutions and advancements in power infrastructure are mitigating these constraints. The significant investment in servers, networking equipment, and physical security infrastructure further underpins market growth. Leading players like IBM, Schneider Electric, and NTT Ltd. are leveraging their expertise to cater to the growing demand, shaping the competitive landscape. The market’s future success hinges on the continued digital transformation across various industries and government initiatives promoting technological advancement.
The historical period (2019-2024) likely saw a steady growth trajectory, setting the stage for the accelerated expansion projected for the forecast period. The market segmentation reveals a strong preference for large and mega data centers, reflecting the increasing data storage and processing needs of major corporations and government agencies. Furthermore, the strategic partnerships between global technology giants and local construction companies demonstrate a concerted effort to meet the rising infrastructural demands. The continued growth will depend on government support for digital infrastructure, and the ability of companies to overcome potential labor shortages and supply chain disruptions that might arise during construction. The increasing emphasis on sustainability will likely see a greater adoption of energy-efficient technologies, influencing the choice of cooling and power infrastructure solutions.
Japan Data Center Construction Market: A Comprehensive Report (2019-2033)
This comprehensive report provides an in-depth analysis of the Japan Data Center Construction Market, offering valuable insights for stakeholders across the value chain. Covering the period from 2019 to 2033, with a focus on 2025, this report dissects market dynamics, competitive landscapes, and future growth potential. The report leverages meticulous data analysis and expert commentary to offer actionable intelligence for informed decision-making. The market is segmented by Tier Type (Tier 1, Tier 2, Tier 3, Tier 4), Data Center Size (Small, Medium, Large, Mega, Massive), Infrastructure (Cooling, Power, Racks & Cabinets, Servers, Networking, Physical Security, Design & Consulting, Other), and End-User (IT & Telecommunication, BFSI, Government, Healthcare, Other). Key players analyzed include SAS Institute Inc, Fortis Construction, Daiwa House Industry Co Ltd, Hutchinson Builders, Kienta Engineering Construction, DSCO Group, IBM Corporation, GIGA-BYTE Technology Co Ltd, Sato Kogyo (S) Pte Ltd, Nakano Corporation, Schneider Electric SE, Turner Construction Co, Hensel Phelps Construction Co Inc, Obayashi Corporation, CSF Group, HIBIYA ENGINEERING Ltd, Cummins Inc, AECOM, and NTT Ltd.
Japan Data Center Construction Market Market Structure & Competitive Dynamics
The Japan data center construction market exhibits a moderately concentrated structure, with a few large players dominating alongside numerous smaller, specialized firms. The market's innovation ecosystem is vibrant, driven by technological advancements in cooling, power infrastructure, and security systems. Stringent regulatory frameworks, focusing on energy efficiency and disaster resilience, significantly influence market dynamics. Product substitutes, such as cloud computing services, pose a competitive threat, while the market also witnesses substantial M&A activity, consolidating market share and driving innovation.
- Market Concentration: The top 5 players hold approximately xx% of the market share in 2025 (estimated).
- M&A Activity: Significant M&A deals, totaling an estimated xx Million USD in 2024, have reshaped the competitive landscape.
- Regulatory Framework: Compliance with strict building codes and environmental regulations adds complexity and cost to projects.
- End-User Trends: Growing digitalization across sectors like IT & Telecommunication, BFSI, and Government fuels demand for robust data center infrastructure.
Japan Data Center Construction Market Industry Trends & Insights
The Japan data center construction market is experiencing robust growth, driven by several factors. The increasing adoption of cloud computing, the expansion of 5G networks, and the rising demand for data storage and processing power are primary growth drivers. Technological advancements in energy-efficient cooling systems and high-density server racks contribute to increased efficiency and reduced operational costs. Furthermore, government initiatives promoting digitalization and investment in infrastructure development are accelerating market expansion. The market is expected to exhibit a CAGR of xx% during the forecast period (2025-2033). Market penetration of advanced cooling technologies is projected to reach xx% by 2033.
Dominant Markets & Segments in Japan Data Center Construction Market
The Tokyo metropolitan area dominates the Japan data center construction market, driven by high demand from major IT hubs and financial institutions. Tier 3 and Tier 4 data centers represent the largest segments in terms of capacity, while medium and large data center sizes drive substantial revenue. The IT & Telecommunication sector constitutes the largest end-user segment, showcasing the critical role of data centers in supporting digital infrastructure.
- Key Drivers for Tokyo's Dominance:
- Concentrated IT infrastructure and skilled workforce.
- Excellent connectivity and robust power grid.
- Favorable government policies supporting data center development.
- Dominant Infrastructure Segments: Power infrastructure and cooling systems constitute the largest revenue segments, reflecting the high energy demands of data centers.
Japan Data Center Construction Market Product Innovations
Recent innovations focus on energy efficiency, scalability, and enhanced security. Modular data center designs, AI-powered cooling systems, and advanced security technologies are gaining traction. These innovations cater to the rising demand for high-capacity, environmentally friendly, and secure data center infrastructure. The market is seeing increasing adoption of sustainable practices like renewable energy integration.
Report Segmentation & Scope
This report provides a granular analysis of the Japan data center construction market across various segments:
- Tier Type: The report details the market size and growth projections for each Tier (Tier 1 to Tier 4), highlighting the competitive landscape within each segment.
- Data Center Size: Market dynamics, growth prospects, and competitive analysis are presented for Small, Medium, Large, Mega, and Massive data centers.
- Infrastructure: A comprehensive breakdown of each infrastructure component (cooling, power, racks & cabinets, etc.) is included, covering market size, growth, and competitive dynamics.
- End-User: The report analyzes each end-user segment (IT & Telecommunication, BFSI, Government, Healthcare, and Others), revealing specific growth drivers and market trends.
Key Drivers of Japan Data Center Construction Market Growth
Several factors propel the market's growth: The rapid expansion of the digital economy, increased data generation, rising demand for cloud services, supportive government policies incentivizing data center infrastructure development, and robust investment by major players in expanding their data center footprints.
Challenges in the Japan Data Center Construction Market Sector
The market faces challenges including the high cost of land and construction in major urban areas, stringent regulatory requirements, potential supply chain disruptions affecting crucial components, and intense competition among established players. These factors may limit market expansion and profitability.
Leading Players in the Japan Data Center Construction Market Market
- SAS Institute Inc
- Fortis Construction
- Daiwa House Industry Co Ltd
- Hutchinson Builders
- Kienta Engineering Construction
- DSCO Group
- IBM Corporation
- GIGA-BYTE Technology Co Ltd
- Sato Kogyo (S) Pte Ltd
- Nakano Corporation
- Schneider Electric SE
- Turner Construction Co
- Hensel Phelps Construction Co Inc
- Obayashi Corporation
- CSF Group
- HIBIYA ENGINEERING Ltd
- Cummins Inc
- AECOM
- NTT Ltd
Key Developments in Japan Data Center Construction Market Sector
- September 2022: NTT Corporation's investment of approximately YEN 40 Billion in a new data center in Kyoto signifies considerable expansion plans within the sector.
- November 2022: Equinix's USD 115 Million investment in its 15th IBX data center in Tokyo demonstrates the continued strong demand and significant capital investment in the Japanese data center market.
Strategic Japan Data Center Construction Market Market Outlook
The Japanese data center construction market holds significant long-term growth potential, driven by ongoing digital transformation across diverse sectors and the increasing importance of reliable, high-capacity data center infrastructure. Strategic opportunities exist for players who can leverage technological advancements, embrace sustainable practices, and navigate regulatory complexities effectively. The market presents promising prospects for companies specializing in innovative cooling solutions, high-density server racks, and enhanced security systems.
Japan Data Center Construction Market Segmentation
-
1. Market Segmentation
-
1.1. By Infrastructure
-
1.1.1. By Electrical Infrastructure
-
1.1.1.1. Power Distribution Solutions
- 1.1.1.1.1. PDU - Basic & Smart - Metered & Switched Solutions
-
1.1.1.1.2. Transfer Switches
- 1.1.1.1.2.1. Static
- 1.1.1.1.2.2. Automatic (ATS)
-
1.1.1.1.3. Switchgear
- 1.1.1.1.3.1. Low-voltage
- 1.1.1.1.3.2. Medium-voltage
- 1.1.1.1.4. Power Panels and Components
- 1.1.1.1.5. Other Power Distribution Solutions
-
1.1.1.2. Power Back-up Solutions
- 1.1.1.2.1. UPS
- 1.1.1.2.2. Generators
- 1.1.1.3. Service
-
1.1.1.1. Power Distribution Solutions
-
1.1.2. By Mechanical Infrastructure
-
1.1.2.1. Cooling Systems
- 1.1.2.1.1. Immersion Cooling
- 1.1.2.1.2. Direct-to-Chip Cooling
- 1.1.2.1.3. Rear Door Heat Exchanger
- 1.1.2.1.4. In-row and In-rack Cooling
- 1.1.2.1.5. Racks
- 1.1.2.1.6. Other Mechanical Infrastructure
-
1.1.2.1. Cooling Systems
- 1.1.3. General Construction
-
1.1.1. By Electrical Infrastructure
-
1.2. By Tier Type
- 1.2.1. Tier-I and II
- 1.2.2. Tier-III
- 1.2.3. Tier-IV
-
1.3. By End User
- 1.3.1. Banking, Financial Services, and Insurance
- 1.3.2. IT and Telecommunications
- 1.3.3. Government and Defense
- 1.3.4. Healthcare
- 1.3.5. Other End Users
-
1.1. By Infrastructure
-
2. Infrastructure
-
2.1. By Electrical Infrastructure
-
2.1.1. Power Distribution Solutions
- 2.1.1.1. PDU - Basic & Smart - Metered & Switched Solutions
-
2.1.1.2. Transfer Switches
- 2.1.1.2.1. Static
- 2.1.1.2.2. Automatic (ATS)
-
2.1.1.3. Switchgear
- 2.1.1.3.1. Low-voltage
- 2.1.1.3.2. Medium-voltage
- 2.1.1.4. Power Panels and Components
- 2.1.1.5. Other Power Distribution Solutions
-
2.1.2. Power Back-up Solutions
- 2.1.2.1. UPS
- 2.1.2.2. Generators
- 2.1.3. Service
-
2.1.1. Power Distribution Solutions
-
2.2. By Mechanical Infrastructure
-
2.2.1. Cooling Systems
- 2.2.1.1. Immersion Cooling
- 2.2.1.2. Direct-to-Chip Cooling
- 2.2.1.3. Rear Door Heat Exchanger
- 2.2.1.4. In-row and In-rack Cooling
- 2.2.1.5. Racks
- 2.2.1.6. Other Mechanical Infrastructure
-
2.2.1. Cooling Systems
- 2.3. General Construction
-
2.1. By Electrical Infrastructure
-
3. Tier Type
- 3.1. Tier-I and II
- 3.2. Tier-III
- 3.3. Tier-IV
-
4. End User
- 4.1. Banking, Financial Services, and Insurance
- 4.2. IT and Telecommunications
- 4.3. Government and Defense
- 4.4. Healthcare
- 4.5. Other End Users
Japan Data Center Construction Market Segmentation By Geography
- 1. Japan
Japan Data Center Construction Market REPORT HIGHLIGHTS
| Aspects | Details |
|---|---|
| Study Period | 2019-2033 |
| Base Year | 2024 |
| Estimated Year | 2025 |
| Forecast Period | 2025-2033 |
| Historical Period | 2019-2024 |
| Growth Rate | CAGR of 3.25% from 2019-2033 |
| Segmentation |
|
Table of Contents
- 1. Introduction
- 1.1. Research Scope
- 1.2. Market Segmentation
- 1.3. Research Methodology
- 1.4. Definitions and Assumptions
- 2. Executive Summary
- 2.1. Introduction
- 3. Market Dynamics
- 3.1. Introduction
- 3.2. Market Drivers
- 3.2.1. Growing E-commerce and Hi-tech industries driving the DC construction in the country; Major initiatives undertaken by government to promote digital economy and connectivity infrastructure
- 3.3. Market Restrains
- 3.3.1. High Power Consumption and emission contribution of Data Centers
- 3.4. Market Trends
- 3.4.1. Tier 3 is the largest Tier Type
- 4. Market Factor Analysis
- 4.1. Porters Five Forces
- 4.2. Supply/Value Chain
- 4.3. PESTEL analysis
- 4.4. Market Entropy
- 4.5. Patent/Trademark Analysis
- 5. Japan Data Center Construction Market Analysis, Insights and Forecast, 2019-2031
- 5.1. Market Analysis, Insights and Forecast - by Market Segmentation
- 5.1.1. By Infrastructure
- 5.1.1.1. By Electrical Infrastructure
- 5.1.1.1.1. Power Distribution Solutions
- 5.1.1.1.1.1. PDU - Basic & Smart - Metered & Switched Solutions
- 5.1.1.1.1.2. Transfer Switches
- 5.1.1.1.1.2.1. Static
- 5.1.1.1.1.2.2. Automatic (ATS)
- 5.1.1.1.1.3. Switchgear
- 5.1.1.1.1.3.1. Low-voltage
- 5.1.1.1.1.3.2. Medium-voltage
- 5.1.1.1.1.4. Power Panels and Components
- 5.1.1.1.1.5. Other Power Distribution Solutions
- 5.1.1.1.2. Power Back-up Solutions
- 5.1.1.1.2.1. UPS
- 5.1.1.1.2.2. Generators
- 5.1.1.1.3. Service
- 5.1.1.1.1. Power Distribution Solutions
- 5.1.1.2. By Mechanical Infrastructure
- 5.1.1.2.1. Cooling Systems
- 5.1.1.2.1.1. Immersion Cooling
- 5.1.1.2.1.2. Direct-to-Chip Cooling
- 5.1.1.2.1.3. Rear Door Heat Exchanger
- 5.1.1.2.1.4. In-row and In-rack Cooling
- 5.1.1.2.1.5. Racks
- 5.1.1.2.1.6. Other Mechanical Infrastructure
- 5.1.1.2.1. Cooling Systems
- 5.1.1.3. General Construction
- 5.1.1.1. By Electrical Infrastructure
- 5.1.2. By Tier Type
- 5.1.2.1. Tier-I and II
- 5.1.2.2. Tier-III
- 5.1.2.3. Tier-IV
- 5.1.3. By End User
- 5.1.3.1. Banking, Financial Services, and Insurance
- 5.1.3.2. IT and Telecommunications
- 5.1.3.3. Government and Defense
- 5.1.3.4. Healthcare
- 5.1.3.5. Other End Users
- 5.1.1. By Infrastructure
- 5.2. Market Analysis, Insights and Forecast - by Infrastructure
- 5.2.1. By Electrical Infrastructure
- 5.2.1.1. Power Distribution Solutions
- 5.2.1.1.1. PDU - Basic & Smart - Metered & Switched Solutions
- 5.2.1.1.2. Transfer Switches
- 5.2.1.1.2.1. Static
- 5.2.1.1.2.2. Automatic (ATS)
- 5.2.1.1.3. Switchgear
- 5.2.1.1.3.1. Low-voltage
- 5.2.1.1.3.2. Medium-voltage
- 5.2.1.1.4. Power Panels and Components
- 5.2.1.1.5. Other Power Distribution Solutions
- 5.2.1.2. Power Back-up Solutions
- 5.2.1.2.1. UPS
- 5.2.1.2.2. Generators
- 5.2.1.3. Service
- 5.2.1.1. Power Distribution Solutions
- 5.2.2. By Mechanical Infrastructure
- 5.2.2.1. Cooling Systems
- 5.2.2.1.1. Immersion Cooling
- 5.2.2.1.2. Direct-to-Chip Cooling
- 5.2.2.1.3. Rear Door Heat Exchanger
- 5.2.2.1.4. In-row and In-rack Cooling
- 5.2.2.1.5. Racks
- 5.2.2.1.6. Other Mechanical Infrastructure
- 5.2.2.1. Cooling Systems
- 5.2.3. General Construction
- 5.2.1. By Electrical Infrastructure
- 5.3. Market Analysis, Insights and Forecast - by Tier Type
- 5.3.1. Tier-I and II
- 5.3.2. Tier-III
- 5.3.3. Tier-IV
- 5.4. Market Analysis, Insights and Forecast - by End User
- 5.4.1. Banking, Financial Services, and Insurance
- 5.4.2. IT and Telecommunications
- 5.4.3. Government and Defense
- 5.4.4. Healthcare
- 5.4.5. Other End Users
- 5.5. Market Analysis, Insights and Forecast - by Region
- 5.5.1. Japan
- 5.1. Market Analysis, Insights and Forecast - by Market Segmentation
- 6. Kanto Japan Data Center Construction Market Analysis, Insights and Forecast, 2019-2031
- 7. Kansai Japan Data Center Construction Market Analysis, Insights and Forecast, 2019-2031
- 8. Chubu Japan Data Center Construction Market Analysis, Insights and Forecast, 2019-2031
- 9. Kyushu Japan Data Center Construction Market Analysis, Insights and Forecast, 2019-2031
- 10. Tohoku Japan Data Center Construction Market Analysis, Insights and Forecast, 2019-2031
- 11. Competitive Analysis
- 11.1. Market Share Analysis 2024
- 11.2. Company Profiles
- 11.2.1 SAS Institute Inc
- 11.2.1.1. Overview
- 11.2.1.2. Products
- 11.2.1.3. SWOT Analysis
- 11.2.1.4. Recent Developments
- 11.2.1.5. Financials (Based on Availability)
- 11.2.2 Fortis Construction
- 11.2.2.1. Overview
- 11.2.2.2. Products
- 11.2.2.3. SWOT Analysis
- 11.2.2.4. Recent Developments
- 11.2.2.5. Financials (Based on Availability)
- 11.2.3 Daiwa House Industry Co Ltd
- 11.2.3.1. Overview
- 11.2.3.2. Products
- 11.2.3.3. SWOT Analysis
- 11.2.3.4. Recent Developments
- 11.2.3.5. Financials (Based on Availability)
- 11.2.4 Hutchinson Builders
- 11.2.4.1. Overview
- 11.2.4.2. Products
- 11.2.4.3. SWOT Analysis
- 11.2.4.4. Recent Developments
- 11.2.4.5. Financials (Based on Availability)
- 11.2.5 Kienta Engineering Construction
- 11.2.5.1. Overview
- 11.2.5.2. Products
- 11.2.5.3. SWOT Analysis
- 11.2.5.4. Recent Developments
- 11.2.5.5. Financials (Based on Availability)
- 11.2.6 DSCO Group
- 11.2.6.1. Overview
- 11.2.6.2. Products
- 11.2.6.3. SWOT Analysis
- 11.2.6.4. Recent Developments
- 11.2.6.5. Financials (Based on Availability)
- 11.2.7 IBM Corporation
- 11.2.7.1. Overview
- 11.2.7.2. Products
- 11.2.7.3. SWOT Analysis
- 11.2.7.4. Recent Developments
- 11.2.7.5. Financials (Based on Availability)
- 11.2.8 GIGA-BYTE Technology Co Ltd
- 11.2.8.1. Overview
- 11.2.8.2. Products
- 11.2.8.3. SWOT Analysis
- 11.2.8.4. Recent Developments
- 11.2.8.5. Financials (Based on Availability)
- 11.2.9 Sato Kogyo (S) Pte Ltd
- 11.2.9.1. Overview
- 11.2.9.2. Products
- 11.2.9.3. SWOT Analysis
- 11.2.9.4. Recent Developments
- 11.2.9.5. Financials (Based on Availability)
- 11.2.10 Nakano Corporation
- 11.2.10.1. Overview
- 11.2.10.2. Products
- 11.2.10.3. SWOT Analysis
- 11.2.10.4. Recent Developments
- 11.2.10.5. Financials (Based on Availability)
- 11.2.11 Schneider Electric SE
- 11.2.11.1. Overview
- 11.2.11.2. Products
- 11.2.11.3. SWOT Analysis
- 11.2.11.4. Recent Developments
- 11.2.11.5. Financials (Based on Availability)
- 11.2.12 Turner Construction Co
- 11.2.12.1. Overview
- 11.2.12.2. Products
- 11.2.12.3. SWOT Analysis
- 11.2.12.4. Recent Developments
- 11.2.12.5. Financials (Based on Availability)
- 11.2.13 Hensel Phelps Construction Co Inc
- 11.2.13.1. Overview
- 11.2.13.2. Products
- 11.2.13.3. SWOT Analysis
- 11.2.13.4. Recent Developments
- 11.2.13.5. Financials (Based on Availability)
- 11.2.14 Obayashi Corporation
- 11.2.14.1. Overview
- 11.2.14.2. Products
- 11.2.14.3. SWOT Analysis
- 11.2.14.4. Recent Developments
- 11.2.14.5. Financials (Based on Availability)
- 11.2.15 CSF Group
- 11.2.15.1. Overview
- 11.2.15.2. Products
- 11.2.15.3. SWOT Analysis
- 11.2.15.4. Recent Developments
- 11.2.15.5. Financials (Based on Availability)
- 11.2.16 HIBIYA ENGINEERINGLtd
- 11.2.16.1. Overview
- 11.2.16.2. Products
- 11.2.16.3. SWOT Analysis
- 11.2.16.4. Recent Developments
- 11.2.16.5. Financials (Based on Availability)
- 11.2.17 Cummins Inc
- 11.2.17.1. Overview
- 11.2.17.2. Products
- 11.2.17.3. SWOT Analysis
- 11.2.17.4. Recent Developments
- 11.2.17.5. Financials (Based on Availability)
- 11.2.18 AECOM
- 11.2.18.1. Overview
- 11.2.18.2. Products
- 11.2.18.3. SWOT Analysis
- 11.2.18.4. Recent Developments
- 11.2.18.5. Financials (Based on Availability)
- 11.2.19 NTT Ltd
- 11.2.19.1. Overview
- 11.2.19.2. Products
- 11.2.19.3. SWOT Analysis
- 11.2.19.4. Recent Developments
- 11.2.19.5. Financials (Based on Availability)
- 11.2.1 SAS Institute Inc
List of Figures
- Figure 1: Japan Data Center Construction Market Revenue Breakdown (Million, %) by Product 2024 & 2032
- Figure 2: Japan Data Center Construction Market Share (%) by Company 2024
List of Tables
- Table 1: Japan Data Center Construction Market Revenue Million Forecast, by Region 2019 & 2032
- Table 2: Japan Data Center Construction Market Volume K Unit Forecast, by Region 2019 & 2032
- Table 3: Japan Data Center Construction Market Revenue Million Forecast, by Market Segmentation 2019 & 2032
- Table 4: Japan Data Center Construction Market Volume K Unit Forecast, by Market Segmentation 2019 & 2032
- Table 5: Japan Data Center Construction Market Revenue Million Forecast, by Infrastructure 2019 & 2032
- Table 6: Japan Data Center Construction Market Volume K Unit Forecast, by Infrastructure 2019 & 2032
- Table 7: Japan Data Center Construction Market Revenue Million Forecast, by Tier Type 2019 & 2032
- Table 8: Japan Data Center Construction Market Volume K Unit Forecast, by Tier Type 2019 & 2032
- Table 9: Japan Data Center Construction Market Revenue Million Forecast, by End User 2019 & 2032
- Table 10: Japan Data Center Construction Market Volume K Unit Forecast, by End User 2019 & 2032
- Table 11: Japan Data Center Construction Market Revenue Million Forecast, by Region 2019 & 2032
- Table 12: Japan Data Center Construction Market Volume K Unit Forecast, by Region 2019 & 2032
- Table 13: Japan Data Center Construction Market Revenue Million Forecast, by Country 2019 & 2032
- Table 14: Japan Data Center Construction Market Volume K Unit Forecast, by Country 2019 & 2032
- Table 15: Kanto Japan Data Center Construction Market Revenue (Million) Forecast, by Application 2019 & 2032
- Table 16: Kanto Japan Data Center Construction Market Volume (K Unit) Forecast, by Application 2019 & 2032
- Table 17: Kansai Japan Data Center Construction Market Revenue (Million) Forecast, by Application 2019 & 2032
- Table 18: Kansai Japan Data Center Construction Market Volume (K Unit) Forecast, by Application 2019 & 2032
- Table 19: Chubu Japan Data Center Construction Market Revenue (Million) Forecast, by Application 2019 & 2032
- Table 20: Chubu Japan Data Center Construction Market Volume (K Unit) Forecast, by Application 2019 & 2032
- Table 21: Kyushu Japan Data Center Construction Market Revenue (Million) Forecast, by Application 2019 & 2032
- Table 22: Kyushu Japan Data Center Construction Market Volume (K Unit) Forecast, by Application 2019 & 2032
- Table 23: Tohoku Japan Data Center Construction Market Revenue (Million) Forecast, by Application 2019 & 2032
- Table 24: Tohoku Japan Data Center Construction Market Volume (K Unit) Forecast, by Application 2019 & 2032
- Table 25: Japan Data Center Construction Market Revenue Million Forecast, by Market Segmentation 2019 & 2032
- Table 26: Japan Data Center Construction Market Volume K Unit Forecast, by Market Segmentation 2019 & 2032
- Table 27: Japan Data Center Construction Market Revenue Million Forecast, by Infrastructure 2019 & 2032
- Table 28: Japan Data Center Construction Market Volume K Unit Forecast, by Infrastructure 2019 & 2032
- Table 29: Japan Data Center Construction Market Revenue Million Forecast, by Tier Type 2019 & 2032
- Table 30: Japan Data Center Construction Market Volume K Unit Forecast, by Tier Type 2019 & 2032
- Table 31: Japan Data Center Construction Market Revenue Million Forecast, by End User 2019 & 2032
- Table 32: Japan Data Center Construction Market Volume K Unit Forecast, by End User 2019 & 2032
- Table 33: Japan Data Center Construction Market Revenue Million Forecast, by Country 2019 & 2032
- Table 34: Japan Data Center Construction Market Volume K Unit Forecast, by Country 2019 & 2032
Frequently Asked Questions
1. What is the projected Compound Annual Growth Rate (CAGR) of the Japan Data Center Construction Market?
The projected CAGR is approximately 3.25%.
2. Which companies are prominent players in the Japan Data Center Construction Market?
Key companies in the market include SAS Institute Inc, Fortis Construction, Daiwa House Industry Co Ltd, Hutchinson Builders, Kienta Engineering Construction, DSCO Group, IBM Corporation, GIGA-BYTE Technology Co Ltd, Sato Kogyo (S) Pte Ltd, Nakano Corporation, Schneider Electric SE, Turner Construction Co, Hensel Phelps Construction Co Inc, Obayashi Corporation, CSF Group, HIBIYA ENGINEERINGLtd, Cummins Inc, AECOM, NTT Ltd.
3. What are the main segments of the Japan Data Center Construction Market?
The market segments include Market Segmentation, Infrastructure, Tier Type, End User.
4. Can you provide details about the market size?
The market size is estimated to be USD XX Million as of 2022.
5. What are some drivers contributing to market growth?
Growing E-commerce and Hi-tech industries driving the DC construction in the country; Major initiatives undertaken by government to promote digital economy and connectivity infrastructure.
6. What are the notable trends driving market growth?
Tier 3 is the largest Tier Type.
7. Are there any restraints impacting market growth?
High Power Consumption and emission contribution of Data Centers.
8. Can you provide examples of recent developments in the market?
November 2022: Equinix announced its 15th international business exchange (IBX) data center in Tokyo, Japan. The company said that it had made an initial investment of USD 115 million on the new data center, touted TY15. The first phase of TY15 is expected to provide an initial capacity of approximately 1,200 cabinets and 3,700 cabinets when fully built out. Such investments provide opportunities for the vendors in the market.
9. What pricing options are available for accessing the report?
Pricing options include single-user, multi-user, and enterprise licenses priced at USD 3800, USD 4500, and USD 5800 respectively.
10. Is the market size provided in terms of value or volume?
The market size is provided in terms of value, measured in Million and volume, measured in K Unit.
11. Are there any specific market keywords associated with the report?
Yes, the market keyword associated with the report is "Japan Data Center Construction Market," which aids in identifying and referencing the specific market segment covered.
12. How do I determine which pricing option suits my needs best?
The pricing options vary based on user requirements and access needs. Individual users may opt for single-user licenses, while businesses requiring broader access may choose multi-user or enterprise licenses for cost-effective access to the report.
13. Are there any additional resources or data provided in the Japan Data Center Construction Market report?
While the report offers comprehensive insights, it's advisable to review the specific contents or supplementary materials provided to ascertain if additional resources or data are available.
14. How can I stay updated on further developments or reports in the Japan Data Center Construction Market?
To stay informed about further developments, trends, and reports in the Japan Data Center Construction Market, consider subscribing to industry newsletters, following relevant companies and organizations, or regularly checking reputable industry news sources and publications.
Methodology
Step 1 - Identification of Relevant Samples Size from Population Database


Step 2 - Approaches for Defining Global Market Size (Value, Volume* & Price*)

Note*: In applicable scenarios
Step 3 - Data Sources
Primary Research
- Web Analytics
- Survey Reports
- Research Institute
- Latest Research Reports
- Opinion Leaders
Secondary Research
- Annual Reports
- White Paper
- Latest Press Release
- Industry Association
- Paid Database
- Investor Presentations

Step 4 - Data Triangulation
Involves using different sources of information in order to increase the validity of a study
These sources are likely to be stakeholders in a program - participants, other researchers, program staff, other community members, and so on.
Then we put all data in single framework & apply various statistical tools to find out the dynamic on the market.
During the analysis stage, feedback from the stakeholder groups would be compared to determine areas of agreement as well as areas of divergence


