
Key Insights
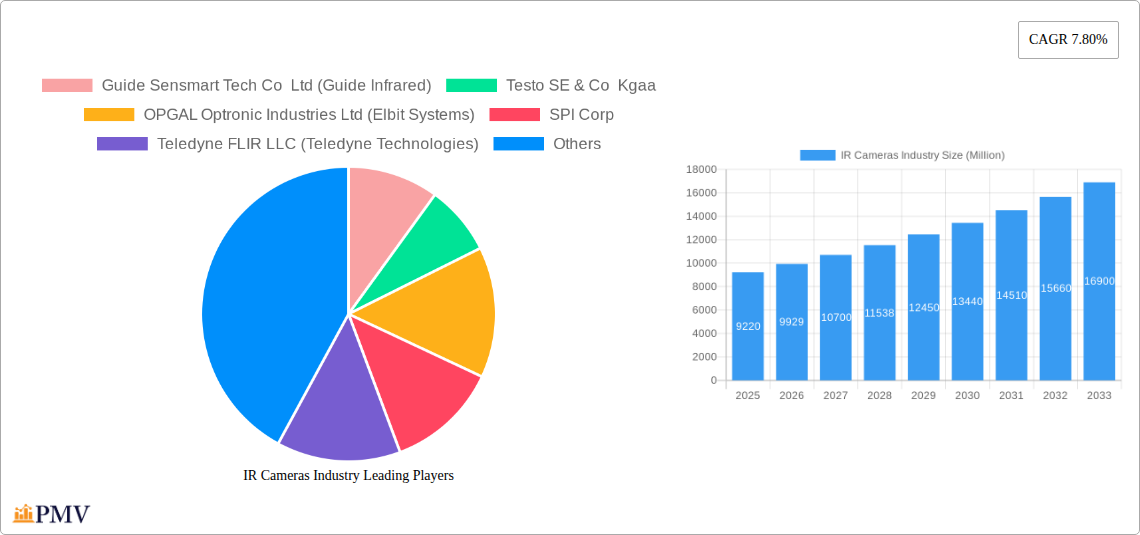
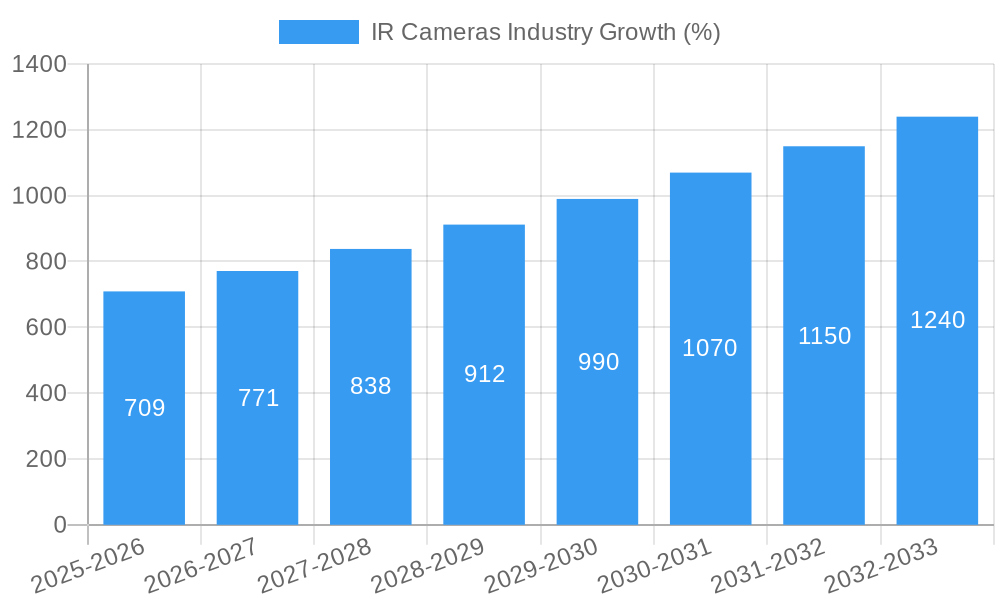
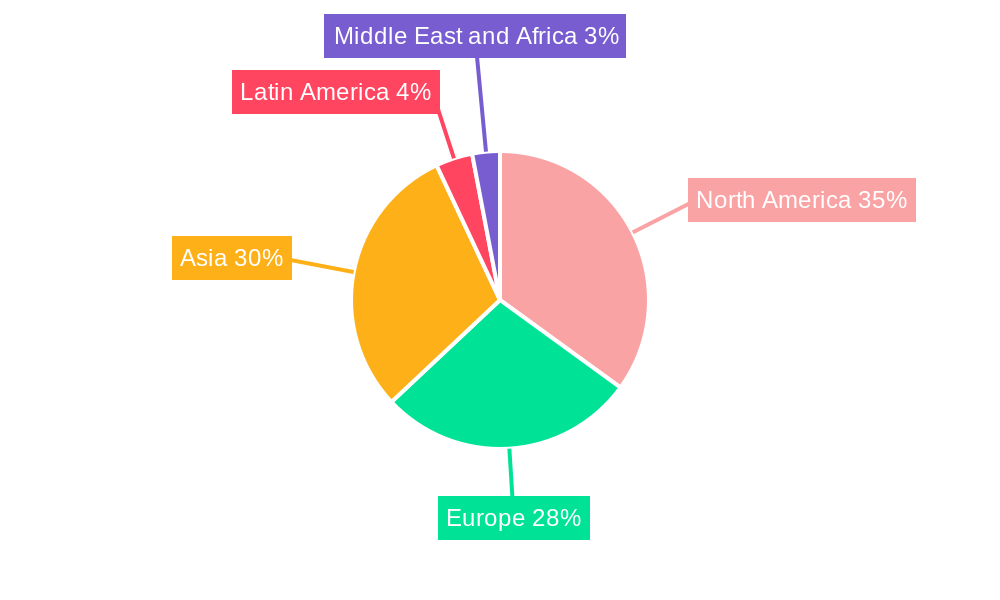
The infrared (IR) camera market, valued at $9.22 billion in 2025, is projected to experience robust growth, driven by increasing demand across diverse sectors. A compound annual growth rate (CAGR) of 7.80% from 2025 to 2033 indicates a significant expansion of this market. Key drivers include the rising adoption of IR cameras in automotive applications (advanced driver-assistance systems (ADAS) and autonomous vehicles), the expanding security and surveillance sector (both commercial and residential), and the growing need for non-destructive testing and inspection in industrial settings. Technological advancements, such as the development of more sensitive and affordable uncooled IR detectors, are further fueling market growth. While challenges such as the high initial cost of certain IR camera types and the need for specialized expertise in their operation exist, the overall market outlook remains positive, especially with the increasing integration of IR technology into smart devices and IoT applications. The segment breakdown reveals that uncooled detectors and long-wavelength IR cameras are particularly strong growth areas. Geographically, North America and Asia are anticipated to dominate the market, given their robust technological infrastructure and high adoption rates in key application areas.
Market segmentation highlights diverse application needs. The military and defense segment, a substantial contributor, benefits from IR technology's capabilities in night vision and target acquisition. The automotive sector's integration of IR cameras into ADAS and autonomous driving features is a key driver, further propelling market growth. Industrial applications, encompassing predictive maintenance and quality control, significantly contribute to market demand. Commercial and public sectors utilize IR cameras for security and monitoring, while the residential sector experiences growth due to the increasing affordability and availability of consumer-grade thermal imaging devices. The diversity of materials used in IR camera production (Germanium, Silicon, Sapphire) reflects the diverse application and performance needs across the various segments. The leading companies mentioned represent key players that are actively contributing to market growth through continuous innovation and product development. The projected growth to 2033 signifies a significant opportunity for market players to capitalize on the increasing demand for reliable and technologically advanced IR camera solutions across various industrial, commercial, and defense applications.
IR Cameras Industry Market Report: 2019-2033
This comprehensive report provides an in-depth analysis of the global IR Cameras market, offering invaluable insights for industry stakeholders, investors, and strategic decision-makers. The study period covers 2019-2033, with a base year of 2025 and a forecast period of 2025-2033. The report values are expressed in Millions. The report segments the market by type, end-user vertical, detector, and material, providing a granular view of the current landscape and future projections.
IR Cameras Industry Market Structure & Competitive Dynamics
The IR cameras market exhibits a moderately concentrated structure, with several major players holding significant market share. The competitive landscape is characterized by intense innovation, driven by the need for higher resolution, improved thermal sensitivity, and smaller form factors. Regulatory frameworks, particularly in defense and security sectors, significantly influence market dynamics. Product substitutes, such as visible light cameras with advanced image processing, exist but are limited in certain applications requiring thermal detection. End-user trends, including increased adoption in automotive safety and industrial inspection, are reshaping the market. Mergers and acquisitions (M&A) activity has been moderate, with strategic partnerships focusing on expanding technological capabilities and market reach. For example, the acquisition of Opgal by Elbit Systems highlights the consolidation in the sector. We estimate the total M&A deal value in the sector to be approximately $XX Million in the past five years. Market share data for leading players will be detailed within the full report, providing a granular analysis of the competitive landscape.
IR Cameras Industry Industry Trends & Insights
The global IR cameras market is experiencing robust growth, driven by rising demand across diverse sectors. The Compound Annual Growth Rate (CAGR) is projected to be XX% during the forecast period (2025-2033). Technological advancements, such as the development of more sensitive detectors and improved image processing algorithms, are fueling market expansion. Consumer preferences are shifting towards smaller, lighter, and more energy-efficient cameras with enhanced functionality. The increasing integration of IR cameras into various applications, such as autonomous vehicles and advanced security systems, is also contributing significantly to market growth. Competitive dynamics are characterized by continuous innovation, strategic partnerships, and expansion into new markets. Market penetration in emerging economies is expected to increase significantly due to infrastructure development and government initiatives. The adoption of various technologies, including microbolometer, and improved materials will drive future growth.
Dominant Markets & Segments in IR Cameras Industry
Leading Region/Country: North America currently dominates the IR cameras market, driven by strong demand from the military and defense, and automotive sectors. However, Asia-Pacific is projected to witness the fastest growth during the forecast period, fueled by rising investments in infrastructure and increasing industrial automation.
By Type: The long-wavelength IR segment holds the largest market share, owing to its superior performance in various applications, particularly in night vision and thermal imaging. However, the medium-wavelength IR segment is expected to experience substantial growth due to its applications in defense and security.
By End-user Vertical: The military and defense segment accounts for a significant portion of the market due to the extensive use of IR cameras in surveillance, targeting, and navigation systems. The automotive sector is a rapidly growing segment, driven by increased adoption of advanced driver-assistance systems (ADAS) and autonomous driving technologies.
By Detector: Uncooled detectors dominate the market due to their cost-effectiveness and ease of use. However, cooled detectors are experiencing growth in high-performance applications requiring superior sensitivity.
By Material: Germanium is the most widely used material due to its excellent transmission properties in the infrared spectrum. However, Silicon and other materials are gaining traction due to ongoing research and development efforts.
Key Drivers:
- Strong government support for defense and security initiatives in various regions.
- Rising investments in infrastructure and industrial automation.
- Technological advancements driving improved performance and reduced costs.
- Growing adoption in various applications across several sectors.
IR Cameras Industry Product Innovations
Recent innovations in IR cameras include the development of high-resolution sensors, advanced image processing algorithms, and smaller form factors. These advancements have expanded the applications of IR cameras into new sectors, such as healthcare and environmental monitoring. Miniaturization and the integration of AI-based features further enhance the market appeal and competitive advantage of newer models. The launch of upgraded K-Series thermal imaging cameras by Teledyne FLIR exemplifies this drive for improved clarity and efficiency, directly impacting market competitiveness.
Report Segmentation & Scope
This report provides a comprehensive segmentation of the IR cameras market across several key parameters:
- By Type: Near and Short-wavelength IR, Medium-wavelength IR, Long-wavelength IR (with growth projections and market size for each segment).
- By End-user Vertical: Military and Defense, Automotive, Industrial, Commercial and Public, Residential, Other End-user Vertical (with market size and competitive dynamics analysis for each).
- By Detector: Cooled, Uncooled (with market share and growth forecasts).
- By Material: Germanium, Silicon, Sapphire, Other Materials (with a detailed analysis of material properties and market penetration).
Each segment is analyzed in detail, providing insights into market size, growth projections, and competitive dynamics.
Key Drivers of IR Cameras Industry Growth
Several key factors are driving growth in the IR cameras industry. Technological advancements, including improved sensor technology and image processing algorithms, are leading to higher resolution, better sensitivity, and smaller, more energy-efficient cameras. Increasing demand from various end-user sectors, particularly in military and defense, automotive, and industrial applications, is another major driver. Furthermore, supportive government policies and regulations in certain regions are promoting the adoption of IR camera technology.
Challenges in the IR Cameras Industry Sector
The IR cameras industry faces several challenges, including the high cost of advanced IR sensors, which can limit adoption in certain applications. Supply chain disruptions, particularly concerning rare-earth materials used in sensor fabrication, pose another significant challenge. Intense competition and the need for continuous innovation to remain competitive are also significant hurdles. The impact of these challenges is reflected in the overall market growth rate and pricing strategies of various market players.
Leading Players in the IR Cameras Industry Market
- Guide Sensmart Tech Co Ltd (Guide Infrared)
- Testo SE & Co Kgaa
- OPGAL Optronic Industries Ltd (Elbit Systems)
- SPI Corp
- Teledyne FLIR LLC (Teledyne Technologies)
- Raytheon Company
- Seek Thermal Inc
- Leonardo DRS Inc
- InfraTec Gmb
- Fluke Corporation
- Hangzhou Hikvision Digital Technology Co Ltd
Key Developments in IR Cameras Industry Sector
- January 2024: Teledyne FLIR launched an upgraded version of its K-Series thermal imaging cameras, enhancing image clarity for firefighting and search and rescue applications. This improved product offering is anticipated to enhance its market share within the firefighting and SAR segments.
- February 2024: Prama India collaborated with C-DCAC through a TOT agreement to support local thermal camera production and innovation in India. This initiative should boost the adoption rate of thermal cameras within the Indian market and potentially support the overall growth of the industry.
Strategic IR Cameras Industry Market Outlook
The future of the IR cameras market appears bright, with strong growth potential driven by technological advancements and expanding applications across multiple sectors. Strategic opportunities exist for companies that can develop innovative products with improved performance, smaller form factors, and lower costs. Focusing on emerging markets and strategic partnerships will be crucial for long-term success. The integration of AI and machine learning capabilities into IR cameras is likely to be a significant area of future development, enhancing the value proposition of the technology across various sectors.
IR Cameras Industry Segmentation
-
1. Detector
- 1.1. Cooled
- 1.2. Uncooled
-
2. Material
- 2.1. Germanium
- 2.2. Silicon
- 2.3. Sapphire
- 2.4. Other Materials
-
3. Type
- 3.1. Near and Short-wavelength IR
- 3.2. Medium-wavelength IR
- 3.3. Long-wavelength IR
-
4. End-user Vertical
- 4.1. Military and Defense
- 4.2. Automotive
- 4.3. Industrial
- 4.4. Commercial and Public
- 4.5. Residential
- 4.6. Other End-user Vertical
IR Cameras Industry Segmentation By Geography
-
1. North America
- 1.1. United States
- 1.2. Canada
-
2. Europe
- 2.1. United Kingdom
- 2.2. Germany
- 2.3. France
-
3. Asia
- 3.1. China
- 3.2. India
- 3.3. Japan
- 3.4. Australia and New Zealand
- 4. Latin America
- 5. Middle East and Africa
IR Cameras Industry REPORT HIGHLIGHTS
| Aspects | Details |
|---|---|
| Study Period | 2019-2033 |
| Base Year | 2024 |
| Estimated Year | 2025 |
| Forecast Period | 2025-2033 |
| Historical Period | 2019-2024 |
| Growth Rate | CAGR of 7.80% from 2019-2033 |
| Segmentation |
|
Table of Contents
- 1. Introduction
- 1.1. Research Scope
- 1.2. Market Segmentation
- 1.3. Research Methodology
- 1.4. Definitions and Assumptions
- 2. Executive Summary
- 2.1. Introduction
- 3. Market Dynamics
- 3.1. Introduction
- 3.2. Market Drivers
- 3.2.1. Rising Demand for Surveillance Across Various Verticals; Gradually Decreasing Costs of Thermal Cameras
- 3.3. Market Restrains
- 3.3.1. High Costs And Limited Commercialization
- 3.4. Market Trends
- 3.4.1. Automotive Industry to be the Fastest Growing End User
- 4. Market Factor Analysis
- 4.1. Porters Five Forces
- 4.2. Supply/Value Chain
- 4.3. PESTEL analysis
- 4.4. Market Entropy
- 4.5. Patent/Trademark Analysis
- 5. Global IR Cameras Industry Analysis, Insights and Forecast, 2019-2031
- 5.1. Market Analysis, Insights and Forecast - by Detector
- 5.1.1. Cooled
- 5.1.2. Uncooled
- 5.2. Market Analysis, Insights and Forecast - by Material
- 5.2.1. Germanium
- 5.2.2. Silicon
- 5.2.3. Sapphire
- 5.2.4. Other Materials
- 5.3. Market Analysis, Insights and Forecast - by Type
- 5.3.1. Near and Short-wavelength IR
- 5.3.2. Medium-wavelength IR
- 5.3.3. Long-wavelength IR
- 5.4. Market Analysis, Insights and Forecast - by End-user Vertical
- 5.4.1. Military and Defense
- 5.4.2. Automotive
- 5.4.3. Industrial
- 5.4.4. Commercial and Public
- 5.4.5. Residential
- 5.4.6. Other End-user Vertical
- 5.5. Market Analysis, Insights and Forecast - by Region
- 5.5.1. North America
- 5.5.2. Europe
- 5.5.3. Asia
- 5.5.4. Latin America
- 5.5.5. Middle East and Africa
- 5.1. Market Analysis, Insights and Forecast - by Detector
- 6. North America IR Cameras Industry Analysis, Insights and Forecast, 2019-2031
- 6.1. Market Analysis, Insights and Forecast - by Detector
- 6.1.1. Cooled
- 6.1.2. Uncooled
- 6.2. Market Analysis, Insights and Forecast - by Material
- 6.2.1. Germanium
- 6.2.2. Silicon
- 6.2.3. Sapphire
- 6.2.4. Other Materials
- 6.3. Market Analysis, Insights and Forecast - by Type
- 6.3.1. Near and Short-wavelength IR
- 6.3.2. Medium-wavelength IR
- 6.3.3. Long-wavelength IR
- 6.4. Market Analysis, Insights and Forecast - by End-user Vertical
- 6.4.1. Military and Defense
- 6.4.2. Automotive
- 6.4.3. Industrial
- 6.4.4. Commercial and Public
- 6.4.5. Residential
- 6.4.6. Other End-user Vertical
- 6.1. Market Analysis, Insights and Forecast - by Detector
- 7. Europe IR Cameras Industry Analysis, Insights and Forecast, 2019-2031
- 7.1. Market Analysis, Insights and Forecast - by Detector
- 7.1.1. Cooled
- 7.1.2. Uncooled
- 7.2. Market Analysis, Insights and Forecast - by Material
- 7.2.1. Germanium
- 7.2.2. Silicon
- 7.2.3. Sapphire
- 7.2.4. Other Materials
- 7.3. Market Analysis, Insights and Forecast - by Type
- 7.3.1. Near and Short-wavelength IR
- 7.3.2. Medium-wavelength IR
- 7.3.3. Long-wavelength IR
- 7.4. Market Analysis, Insights and Forecast - by End-user Vertical
- 7.4.1. Military and Defense
- 7.4.2. Automotive
- 7.4.3. Industrial
- 7.4.4. Commercial and Public
- 7.4.5. Residential
- 7.4.6. Other End-user Vertical
- 7.1. Market Analysis, Insights and Forecast - by Detector
- 8. Asia IR Cameras Industry Analysis, Insights and Forecast, 2019-2031
- 8.1. Market Analysis, Insights and Forecast - by Detector
- 8.1.1. Cooled
- 8.1.2. Uncooled
- 8.2. Market Analysis, Insights and Forecast - by Material
- 8.2.1. Germanium
- 8.2.2. Silicon
- 8.2.3. Sapphire
- 8.2.4. Other Materials
- 8.3. Market Analysis, Insights and Forecast - by Type
- 8.3.1. Near and Short-wavelength IR
- 8.3.2. Medium-wavelength IR
- 8.3.3. Long-wavelength IR
- 8.4. Market Analysis, Insights and Forecast - by End-user Vertical
- 8.4.1. Military and Defense
- 8.4.2. Automotive
- 8.4.3. Industrial
- 8.4.4. Commercial and Public
- 8.4.5. Residential
- 8.4.6. Other End-user Vertical
- 8.1. Market Analysis, Insights and Forecast - by Detector
- 9. Latin America IR Cameras Industry Analysis, Insights and Forecast, 2019-2031
- 9.1. Market Analysis, Insights and Forecast - by Detector
- 9.1.1. Cooled
- 9.1.2. Uncooled
- 9.2. Market Analysis, Insights and Forecast - by Material
- 9.2.1. Germanium
- 9.2.2. Silicon
- 9.2.3. Sapphire
- 9.2.4. Other Materials
- 9.3. Market Analysis, Insights and Forecast - by Type
- 9.3.1. Near and Short-wavelength IR
- 9.3.2. Medium-wavelength IR
- 9.3.3. Long-wavelength IR
- 9.4. Market Analysis, Insights and Forecast - by End-user Vertical
- 9.4.1. Military and Defense
- 9.4.2. Automotive
- 9.4.3. Industrial
- 9.4.4. Commercial and Public
- 9.4.5. Residential
- 9.4.6. Other End-user Vertical
- 9.1. Market Analysis, Insights and Forecast - by Detector
- 10. Middle East and Africa IR Cameras Industry Analysis, Insights and Forecast, 2019-2031
- 10.1. Market Analysis, Insights and Forecast - by Detector
- 10.1.1. Cooled
- 10.1.2. Uncooled
- 10.2. Market Analysis, Insights and Forecast - by Material
- 10.2.1. Germanium
- 10.2.2. Silicon
- 10.2.3. Sapphire
- 10.2.4. Other Materials
- 10.3. Market Analysis, Insights and Forecast - by Type
- 10.3.1. Near and Short-wavelength IR
- 10.3.2. Medium-wavelength IR
- 10.3.3. Long-wavelength IR
- 10.4. Market Analysis, Insights and Forecast - by End-user Vertical
- 10.4.1. Military and Defense
- 10.4.2. Automotive
- 10.4.3. Industrial
- 10.4.4. Commercial and Public
- 10.4.5. Residential
- 10.4.6. Other End-user Vertical
- 10.1. Market Analysis, Insights and Forecast - by Detector
- 11. North America IR Cameras Industry Analysis, Insights and Forecast, 2019-2031
- 11.1. Market Analysis, Insights and Forecast - By Country/Sub-region
- 11.1.1 United States
- 11.1.2 Canada
- 12. Europe IR Cameras Industry Analysis, Insights and Forecast, 2019-2031
- 12.1. Market Analysis, Insights and Forecast - By Country/Sub-region
- 12.1.1 United Kingdom
- 12.1.2 Germany
- 12.1.3 France
- 13. Asia IR Cameras Industry Analysis, Insights and Forecast, 2019-2031
- 13.1. Market Analysis, Insights and Forecast - By Country/Sub-region
- 13.1.1 China
- 13.1.2 India
- 13.1.3 Japan
- 13.1.4 Australia and New Zealand
- 14. Latin America IR Cameras Industry Analysis, Insights and Forecast, 2019-2031
- 14.1. Market Analysis, Insights and Forecast - By Country/Sub-region
- 14.1.1.
- 15. Middle East and Africa IR Cameras Industry Analysis, Insights and Forecast, 2019-2031
- 15.1. Market Analysis, Insights and Forecast - By Country/Sub-region
- 15.1.1.
- 16. Competitive Analysis
- 16.1. Global Market Share Analysis 2024
- 16.2. Company Profiles
- 16.2.1 Guide Sensmart Tech Co Ltd (Guide Infrared)
- 16.2.1.1. Overview
- 16.2.1.2. Products
- 16.2.1.3. SWOT Analysis
- 16.2.1.4. Recent Developments
- 16.2.1.5. Financials (Based on Availability)
- 16.2.2 Testo SE & Co Kgaa
- 16.2.2.1. Overview
- 16.2.2.2. Products
- 16.2.2.3. SWOT Analysis
- 16.2.2.4. Recent Developments
- 16.2.2.5. Financials (Based on Availability)
- 16.2.3 OPGAL Optronic Industries Ltd (Elbit Systems)
- 16.2.3.1. Overview
- 16.2.3.2. Products
- 16.2.3.3. SWOT Analysis
- 16.2.3.4. Recent Developments
- 16.2.3.5. Financials (Based on Availability)
- 16.2.4 SPI Corp
- 16.2.4.1. Overview
- 16.2.4.2. Products
- 16.2.4.3. SWOT Analysis
- 16.2.4.4. Recent Developments
- 16.2.4.5. Financials (Based on Availability)
- 16.2.5 Teledyne FLIR LLC (Teledyne Technologies)
- 16.2.5.1. Overview
- 16.2.5.2. Products
- 16.2.5.3. SWOT Analysis
- 16.2.5.4. Recent Developments
- 16.2.5.5. Financials (Based on Availability)
- 16.2.6 Raytheon Company
- 16.2.6.1. Overview
- 16.2.6.2. Products
- 16.2.6.3. SWOT Analysis
- 16.2.6.4. Recent Developments
- 16.2.6.5. Financials (Based on Availability)
- 16.2.7 Seek Thermal Inc
- 16.2.7.1. Overview
- 16.2.7.2. Products
- 16.2.7.3. SWOT Analysis
- 16.2.7.4. Recent Developments
- 16.2.7.5. Financials (Based on Availability)
- 16.2.8 Leonardo DRS Inc
- 16.2.8.1. Overview
- 16.2.8.2. Products
- 16.2.8.3. SWOT Analysis
- 16.2.8.4. Recent Developments
- 16.2.8.5. Financials (Based on Availability)
- 16.2.9 InfraTec Gmb
- 16.2.9.1. Overview
- 16.2.9.2. Products
- 16.2.9.3. SWOT Analysis
- 16.2.9.4. Recent Developments
- 16.2.9.5. Financials (Based on Availability)
- 16.2.10 Fluke Corporation
- 16.2.10.1. Overview
- 16.2.10.2. Products
- 16.2.10.3. SWOT Analysis
- 16.2.10.4. Recent Developments
- 16.2.10.5. Financials (Based on Availability)
- 16.2.11 Hangzhou Hikvision Digital Technology Co Ltd
- 16.2.11.1. Overview
- 16.2.11.2. Products
- 16.2.11.3. SWOT Analysis
- 16.2.11.4. Recent Developments
- 16.2.11.5. Financials (Based on Availability)
- 16.2.1 Guide Sensmart Tech Co Ltd (Guide Infrared)
List of Figures
- Figure 1: Global IR Cameras Industry Revenue Breakdown (Million, %) by Region 2024 & 2032
- Figure 2: North America IR Cameras Industry Revenue (Million), by Country 2024 & 2032
- Figure 3: North America IR Cameras Industry Revenue Share (%), by Country 2024 & 2032
- Figure 4: Europe IR Cameras Industry Revenue (Million), by Country 2024 & 2032
- Figure 5: Europe IR Cameras Industry Revenue Share (%), by Country 2024 & 2032
- Figure 6: Asia IR Cameras Industry Revenue (Million), by Country 2024 & 2032
- Figure 7: Asia IR Cameras Industry Revenue Share (%), by Country 2024 & 2032
- Figure 8: Latin America IR Cameras Industry Revenue (Million), by Country 2024 & 2032
- Figure 9: Latin America IR Cameras Industry Revenue Share (%), by Country 2024 & 2032
- Figure 10: Middle East and Africa IR Cameras Industry Revenue (Million), by Country 2024 & 2032
- Figure 11: Middle East and Africa IR Cameras Industry Revenue Share (%), by Country 2024 & 2032
- Figure 12: North America IR Cameras Industry Revenue (Million), by Detector 2024 & 2032
- Figure 13: North America IR Cameras Industry Revenue Share (%), by Detector 2024 & 2032
- Figure 14: North America IR Cameras Industry Revenue (Million), by Material 2024 & 2032
- Figure 15: North America IR Cameras Industry Revenue Share (%), by Material 2024 & 2032
- Figure 16: North America IR Cameras Industry Revenue (Million), by Type 2024 & 2032
- Figure 17: North America IR Cameras Industry Revenue Share (%), by Type 2024 & 2032
- Figure 18: North America IR Cameras Industry Revenue (Million), by End-user Vertical 2024 & 2032
- Figure 19: North America IR Cameras Industry Revenue Share (%), by End-user Vertical 2024 & 2032
- Figure 20: North America IR Cameras Industry Revenue (Million), by Country 2024 & 2032
- Figure 21: North America IR Cameras Industry Revenue Share (%), by Country 2024 & 2032
- Figure 22: Europe IR Cameras Industry Revenue (Million), by Detector 2024 & 2032
- Figure 23: Europe IR Cameras Industry Revenue Share (%), by Detector 2024 & 2032
- Figure 24: Europe IR Cameras Industry Revenue (Million), by Material 2024 & 2032
- Figure 25: Europe IR Cameras Industry Revenue Share (%), by Material 2024 & 2032
- Figure 26: Europe IR Cameras Industry Revenue (Million), by Type 2024 & 2032
- Figure 27: Europe IR Cameras Industry Revenue Share (%), by Type 2024 & 2032
- Figure 28: Europe IR Cameras Industry Revenue (Million), by End-user Vertical 2024 & 2032
- Figure 29: Europe IR Cameras Industry Revenue Share (%), by End-user Vertical 2024 & 2032
- Figure 30: Europe IR Cameras Industry Revenue (Million), by Country 2024 & 2032
- Figure 31: Europe IR Cameras Industry Revenue Share (%), by Country 2024 & 2032
- Figure 32: Asia IR Cameras Industry Revenue (Million), by Detector 2024 & 2032
- Figure 33: Asia IR Cameras Industry Revenue Share (%), by Detector 2024 & 2032
- Figure 34: Asia IR Cameras Industry Revenue (Million), by Material 2024 & 2032
- Figure 35: Asia IR Cameras Industry Revenue Share (%), by Material 2024 & 2032
- Figure 36: Asia IR Cameras Industry Revenue (Million), by Type 2024 & 2032
- Figure 37: Asia IR Cameras Industry Revenue Share (%), by Type 2024 & 2032
- Figure 38: Asia IR Cameras Industry Revenue (Million), by End-user Vertical 2024 & 2032
- Figure 39: Asia IR Cameras Industry Revenue Share (%), by End-user Vertical 2024 & 2032
- Figure 40: Asia IR Cameras Industry Revenue (Million), by Country 2024 & 2032
- Figure 41: Asia IR Cameras Industry Revenue Share (%), by Country 2024 & 2032
- Figure 42: Latin America IR Cameras Industry Revenue (Million), by Detector 2024 & 2032
- Figure 43: Latin America IR Cameras Industry Revenue Share (%), by Detector 2024 & 2032
- Figure 44: Latin America IR Cameras Industry Revenue (Million), by Material 2024 & 2032
- Figure 45: Latin America IR Cameras Industry Revenue Share (%), by Material 2024 & 2032
- Figure 46: Latin America IR Cameras Industry Revenue (Million), by Type 2024 & 2032
- Figure 47: Latin America IR Cameras Industry Revenue Share (%), by Type 2024 & 2032
- Figure 48: Latin America IR Cameras Industry Revenue (Million), by End-user Vertical 2024 & 2032
- Figure 49: Latin America IR Cameras Industry Revenue Share (%), by End-user Vertical 2024 & 2032
- Figure 50: Latin America IR Cameras Industry Revenue (Million), by Country 2024 & 2032
- Figure 51: Latin America IR Cameras Industry Revenue Share (%), by Country 2024 & 2032
- Figure 52: Middle East and Africa IR Cameras Industry Revenue (Million), by Detector 2024 & 2032
- Figure 53: Middle East and Africa IR Cameras Industry Revenue Share (%), by Detector 2024 & 2032
- Figure 54: Middle East and Africa IR Cameras Industry Revenue (Million), by Material 2024 & 2032
- Figure 55: Middle East and Africa IR Cameras Industry Revenue Share (%), by Material 2024 & 2032
- Figure 56: Middle East and Africa IR Cameras Industry Revenue (Million), by Type 2024 & 2032
- Figure 57: Middle East and Africa IR Cameras Industry Revenue Share (%), by Type 2024 & 2032
- Figure 58: Middle East and Africa IR Cameras Industry Revenue (Million), by End-user Vertical 2024 & 2032
- Figure 59: Middle East and Africa IR Cameras Industry Revenue Share (%), by End-user Vertical 2024 & 2032
- Figure 60: Middle East and Africa IR Cameras Industry Revenue (Million), by Country 2024 & 2032
- Figure 61: Middle East and Africa IR Cameras Industry Revenue Share (%), by Country 2024 & 2032
List of Tables
- Table 1: Global IR Cameras Industry Revenue Million Forecast, by Region 2019 & 2032
- Table 2: Global IR Cameras Industry Revenue Million Forecast, by Detector 2019 & 2032
- Table 3: Global IR Cameras Industry Revenue Million Forecast, by Material 2019 & 2032
- Table 4: Global IR Cameras Industry Revenue Million Forecast, by Type 2019 & 2032
- Table 5: Global IR Cameras Industry Revenue Million Forecast, by End-user Vertical 2019 & 2032
- Table 6: Global IR Cameras Industry Revenue Million Forecast, by Region 2019 & 2032
- Table 7: Global IR Cameras Industry Revenue Million Forecast, by Country 2019 & 2032
- Table 8: United States IR Cameras Industry Revenue (Million) Forecast, by Application 2019 & 2032
- Table 9: Canada IR Cameras Industry Revenue (Million) Forecast, by Application 2019 & 2032
- Table 10: Global IR Cameras Industry Revenue Million Forecast, by Country 2019 & 2032
- Table 11: United Kingdom IR Cameras Industry Revenue (Million) Forecast, by Application 2019 & 2032
- Table 12: Germany IR Cameras Industry Revenue (Million) Forecast, by Application 2019 & 2032
- Table 13: France IR Cameras Industry Revenue (Million) Forecast, by Application 2019 & 2032
- Table 14: Global IR Cameras Industry Revenue Million Forecast, by Country 2019 & 2032
- Table 15: China IR Cameras Industry Revenue (Million) Forecast, by Application 2019 & 2032
- Table 16: India IR Cameras Industry Revenue (Million) Forecast, by Application 2019 & 2032
- Table 17: Japan IR Cameras Industry Revenue (Million) Forecast, by Application 2019 & 2032
- Table 18: Australia and New Zealand IR Cameras Industry Revenue (Million) Forecast, by Application 2019 & 2032
- Table 19: Global IR Cameras Industry Revenue Million Forecast, by Country 2019 & 2032
- Table 20: IR Cameras Industry Revenue (Million) Forecast, by Application 2019 & 2032
- Table 21: Global IR Cameras Industry Revenue Million Forecast, by Country 2019 & 2032
- Table 22: IR Cameras Industry Revenue (Million) Forecast, by Application 2019 & 2032
- Table 23: Global IR Cameras Industry Revenue Million Forecast, by Detector 2019 & 2032
- Table 24: Global IR Cameras Industry Revenue Million Forecast, by Material 2019 & 2032
- Table 25: Global IR Cameras Industry Revenue Million Forecast, by Type 2019 & 2032
- Table 26: Global IR Cameras Industry Revenue Million Forecast, by End-user Vertical 2019 & 2032
- Table 27: Global IR Cameras Industry Revenue Million Forecast, by Country 2019 & 2032
- Table 28: United States IR Cameras Industry Revenue (Million) Forecast, by Application 2019 & 2032
- Table 29: Canada IR Cameras Industry Revenue (Million) Forecast, by Application 2019 & 2032
- Table 30: Global IR Cameras Industry Revenue Million Forecast, by Detector 2019 & 2032
- Table 31: Global IR Cameras Industry Revenue Million Forecast, by Material 2019 & 2032
- Table 32: Global IR Cameras Industry Revenue Million Forecast, by Type 2019 & 2032
- Table 33: Global IR Cameras Industry Revenue Million Forecast, by End-user Vertical 2019 & 2032
- Table 34: Global IR Cameras Industry Revenue Million Forecast, by Country 2019 & 2032
- Table 35: United Kingdom IR Cameras Industry Revenue (Million) Forecast, by Application 2019 & 2032
- Table 36: Germany IR Cameras Industry Revenue (Million) Forecast, by Application 2019 & 2032
- Table 37: France IR Cameras Industry Revenue (Million) Forecast, by Application 2019 & 2032
- Table 38: Global IR Cameras Industry Revenue Million Forecast, by Detector 2019 & 2032
- Table 39: Global IR Cameras Industry Revenue Million Forecast, by Material 2019 & 2032
- Table 40: Global IR Cameras Industry Revenue Million Forecast, by Type 2019 & 2032
- Table 41: Global IR Cameras Industry Revenue Million Forecast, by End-user Vertical 2019 & 2032
- Table 42: Global IR Cameras Industry Revenue Million Forecast, by Country 2019 & 2032
- Table 43: China IR Cameras Industry Revenue (Million) Forecast, by Application 2019 & 2032
- Table 44: India IR Cameras Industry Revenue (Million) Forecast, by Application 2019 & 2032
- Table 45: Japan IR Cameras Industry Revenue (Million) Forecast, by Application 2019 & 2032
- Table 46: Australia and New Zealand IR Cameras Industry Revenue (Million) Forecast, by Application 2019 & 2032
- Table 47: Global IR Cameras Industry Revenue Million Forecast, by Detector 2019 & 2032
- Table 48: Global IR Cameras Industry Revenue Million Forecast, by Material 2019 & 2032
- Table 49: Global IR Cameras Industry Revenue Million Forecast, by Type 2019 & 2032
- Table 50: Global IR Cameras Industry Revenue Million Forecast, by End-user Vertical 2019 & 2032
- Table 51: Global IR Cameras Industry Revenue Million Forecast, by Country 2019 & 2032
- Table 52: Global IR Cameras Industry Revenue Million Forecast, by Detector 2019 & 2032
- Table 53: Global IR Cameras Industry Revenue Million Forecast, by Material 2019 & 2032
- Table 54: Global IR Cameras Industry Revenue Million Forecast, by Type 2019 & 2032
- Table 55: Global IR Cameras Industry Revenue Million Forecast, by End-user Vertical 2019 & 2032
- Table 56: Global IR Cameras Industry Revenue Million Forecast, by Country 2019 & 2032
Frequently Asked Questions
1. What is the projected Compound Annual Growth Rate (CAGR) of the IR Cameras Industry?
The projected CAGR is approximately 7.80%.
2. Which companies are prominent players in the IR Cameras Industry?
Key companies in the market include Guide Sensmart Tech Co Ltd (Guide Infrared), Testo SE & Co Kgaa, OPGAL Optronic Industries Ltd (Elbit Systems), SPI Corp, Teledyne FLIR LLC (Teledyne Technologies), Raytheon Company, Seek Thermal Inc, Leonardo DRS Inc, InfraTec Gmb, Fluke Corporation, Hangzhou Hikvision Digital Technology Co Ltd.
3. What are the main segments of the IR Cameras Industry?
The market segments include Detector, Material, Type, End-user Vertical.
4. Can you provide details about the market size?
The market size is estimated to be USD 9.22 Million as of 2022.
5. What are some drivers contributing to market growth?
Rising Demand for Surveillance Across Various Verticals; Gradually Decreasing Costs of Thermal Cameras.
6. What are the notable trends driving market growth?
Automotive Industry to be the Fastest Growing End User.
7. Are there any restraints impacting market growth?
High Costs And Limited Commercialization.
8. Can you provide examples of recent developments in the market?
February 2024 - Prama India's collaboration with the government of India's Centre for Development of Advanced Computing (C-DCAC) aims to support local production and innovation. The collaboration is being carried out through a Transfer of technology (TOT) agreement and will focus on thermal camera manufacturing, marketing, and support. Prama India's collaboration with C-DCAC is a step forward in R&D activities using technology to develop next-generation thermal cameras.
9. What pricing options are available for accessing the report?
Pricing options include single-user, multi-user, and enterprise licenses priced at USD 4750, USD 5250, and USD 8750 respectively.
10. Is the market size provided in terms of value or volume?
The market size is provided in terms of value, measured in Million.
11. Are there any specific market keywords associated with the report?
Yes, the market keyword associated with the report is "IR Cameras Industry," which aids in identifying and referencing the specific market segment covered.
12. How do I determine which pricing option suits my needs best?
The pricing options vary based on user requirements and access needs. Individual users may opt for single-user licenses, while businesses requiring broader access may choose multi-user or enterprise licenses for cost-effective access to the report.
13. Are there any additional resources or data provided in the IR Cameras Industry report?
While the report offers comprehensive insights, it's advisable to review the specific contents or supplementary materials provided to ascertain if additional resources or data are available.
14. How can I stay updated on further developments or reports in the IR Cameras Industry?
To stay informed about further developments, trends, and reports in the IR Cameras Industry, consider subscribing to industry newsletters, following relevant companies and organizations, or regularly checking reputable industry news sources and publications.
Methodology
Step 1 - Identification of Relevant Samples Size from Population Database


Step 2 - Approaches for Defining Global Market Size (Value, Volume* & Price*)

Note*: In applicable scenarios
Step 3 - Data Sources
Primary Research
- Web Analytics
- Survey Reports
- Research Institute
- Latest Research Reports
- Opinion Leaders
Secondary Research
- Annual Reports
- White Paper
- Latest Press Release
- Industry Association
- Paid Database
- Investor Presentations

Step 4 - Data Triangulation
Involves using different sources of information in order to increase the validity of a study
These sources are likely to be stakeholders in a program - participants, other researchers, program staff, other community members, and so on.
Then we put all data in single framework & apply various statistical tools to find out the dynamic on the market.
During the analysis stage, feedback from the stakeholder groups would be compared to determine areas of agreement as well as areas of divergence


