
Key Insights
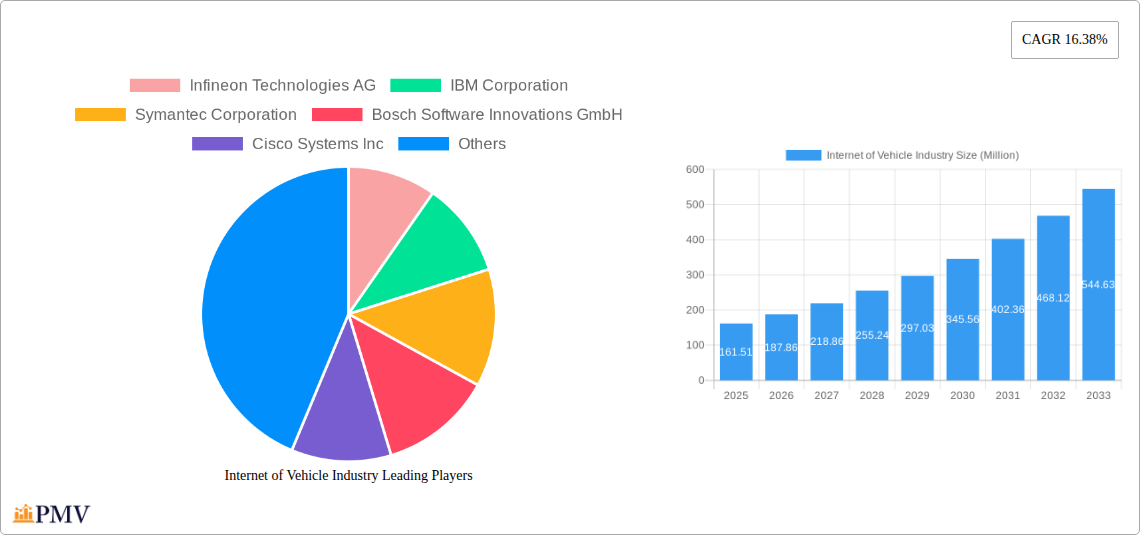
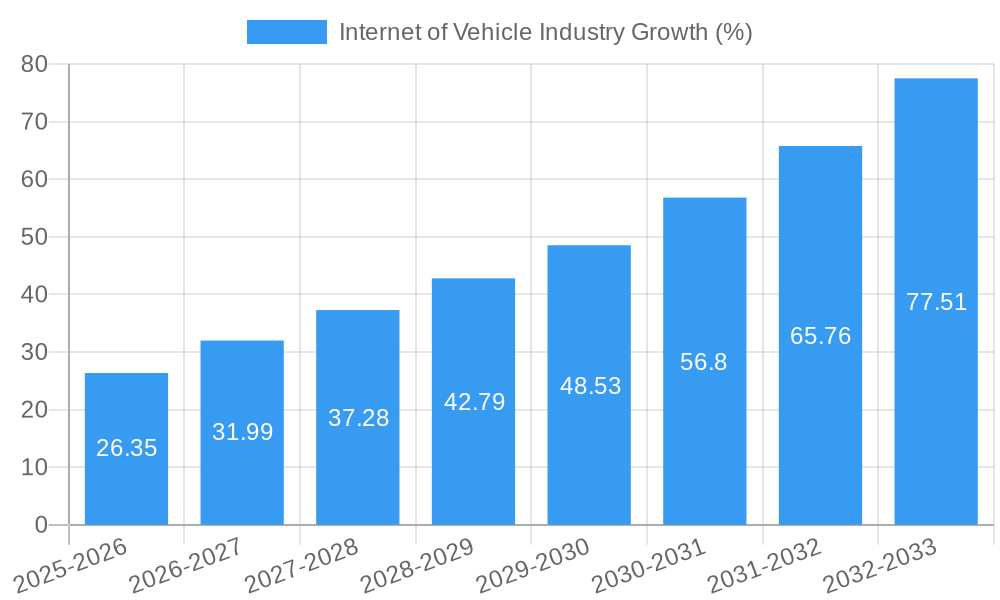
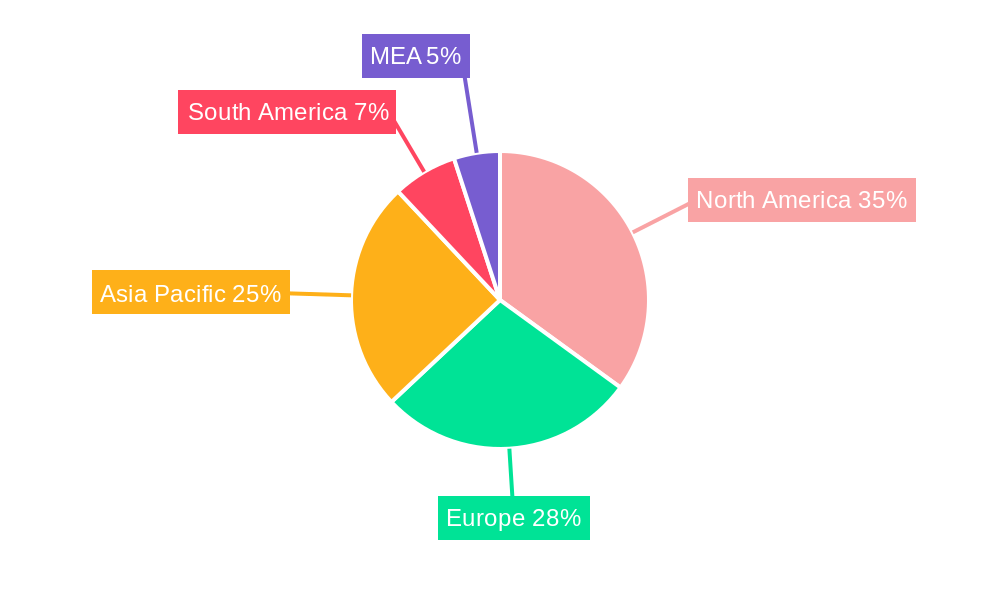
The Internet of Vehicles (IoV) market is experiencing robust growth, projected to reach \$161.51 million in 2025 and exhibiting a Compound Annual Growth Rate (CAGR) of 16.38%. This expansion is driven by several key factors. The increasing adoption of advanced driver-assistance systems (ADAS), the demand for enhanced vehicle security, and the growing need for efficient fleet management solutions are major contributors. Furthermore, the integration of telematics and connected car technologies is facilitating real-time data collection and analysis, leading to improved traffic management, reduced operational costs, and enhanced driver safety. The rising prevalence of autonomous vehicles further fuels market growth, as these vehicles rely heavily on IoV infrastructure for navigation, communication, and data processing. Segmentation reveals a strong demand across various software solutions, including real-time transit management systems, security solutions, and remote monitoring systems, alongside applications such as mobility management and integrated entertainment. Key industry players include established technology giants and automotive manufacturers, actively innovating and competing in this rapidly evolving landscape. Geographic distribution reveals strong growth potential across North America, Europe, and Asia-Pacific, with the latter expected to witness significant expansion due to increasing vehicle production and technological advancements in emerging economies.
The continued expansion of 5G networks and the development of more sophisticated Artificial Intelligence (AI) and Machine Learning (ML) algorithms will likely further accelerate IoV market growth in the coming years. However, challenges remain, including concerns about data privacy and security, the need for robust cybersecurity measures to protect against potential threats, and the high initial investment costs associated with implementing IoV infrastructure. Nevertheless, the long-term outlook for the IoV market remains positive, with significant opportunities for technological advancements and market expansion across diverse end-user industries, particularly within the transportation and logistics sectors. The market is predicted to experience a sustained high growth trajectory throughout the forecast period (2025-2033), driven by continued technological innovations and increased adoption across various segments and regions.
Internet of Vehicle (IoV) Industry Market Report: 2019-2033
This comprehensive report provides a detailed analysis of the Internet of Vehicle (IoV) industry, encompassing market structure, competitive dynamics, industry trends, and future outlook. With a study period spanning 2019-2033, a base year of 2025, and a forecast period of 2025-2033, this report offers invaluable insights for industry stakeholders, investors, and strategic decision-makers. The market is projected to reach xx Million by 2033, exhibiting a CAGR of xx% during the forecast period.
Internet of Vehicle Industry Market Structure & Competitive Dynamics
This section analyzes the IoV market's competitive landscape, encompassing market concentration, innovation ecosystems, regulatory frameworks, and M&A activities. The market exhibits a moderately consolidated structure with key players holding significant market share. Infineon Technologies AG, IBM Corporation, and Bosch Software Innovations GmbH are among the leading players, collectively commanding an estimated xx% market share in 2025. The report details the competitive strategies employed by these players, including product differentiation, technological advancements, and strategic partnerships. Innovation ecosystems are crucial, with significant R&D investment driving the development of advanced technologies such as 5G connectivity, AI-powered solutions, and enhanced security features. Regulatory frameworks, varying across different regions, significantly influence market growth and adoption. The analysis incorporates an examination of product substitutes, emerging technologies, and end-user trends impacting the market's evolution. Furthermore, the report explores M&A activities within the industry, analyzing the value and impact of notable deals, with the total value of M&A transactions exceeding xx Million in the historical period.
- Market Concentration: Moderately Consolidated
- Key Players: Infineon Technologies AG, IBM Corporation, Bosch Software Innovations GmbH, and others.
- M&A Deal Value (Historical Period): Over xx Million
Internet of Vehicle Industry Industry Trends & Insights
This section delves into the key trends shaping the IoV market, including market growth drivers, technological disruptions, consumer preferences, and competitive dynamics. The market is experiencing robust growth fueled by increasing vehicle connectivity, advancements in 5G technology, and the rising demand for enhanced safety and infotainment features. Technological disruptions, such as the integration of artificial intelligence (AI) and machine learning (ML) for autonomous driving and predictive maintenance, are transforming the landscape. Consumer preferences are shifting towards connected vehicles offering seamless integration with mobile devices and personalized experiences. The competitive dynamics are marked by intense innovation, strategic partnerships, and collaborations among industry players. The report provides a detailed analysis of these factors and their impact on market growth, including CAGR projections and market penetration rates for key segments. The increasing adoption of telematics, data analytics, and cloud computing further contributes to market expansion. The growing demand for improved fuel efficiency and reduced emissions is also a significant driver.
Dominant Markets & Segments in Internet of Vehicle Industry
This section identifies the leading regions, countries, and segments within the IoV market. The automotive sector is the primary end-user industry, followed by transportation and logistics. Within software solutions, security solutions and fleet management are prominent segments experiencing high growth. In applications, mobility management and integrated entertainment are leading.
By Software Solutions:
- Security Solution: Driven by increasing concerns over vehicle cybersecurity and data privacy.
- Fleet Management: Facilitated by advancements in GPS tracking and telematics.
- Real-time Transit Management System: Improved efficiency in public transportation.
- Remote Monitoring System: Enabling proactive maintenance and reducing downtime.
- Network Bandwidth Management: Optimizing data usage and connectivity in vehicles.
By Applications:
- Mobility Management: Facilitated by advancements in GPS tracking and telematics.
- Vehicle Management: Driven by the need for enhanced vehicle diagnostics and predictive maintenance.
- Integrated Entertainment: Fueled by increasing demand for in-car entertainment and infotainment systems.
By End-user Industry:
- Automotive: The dominant segment, driving the majority of IoV market growth.
- Transportation and Logistics: Growing adoption of IoV technologies for fleet optimization and improved efficiency.
- Others End User Industries: Expanding adoption across various sectors.
Key Drivers:
- Government initiatives promoting connected vehicle infrastructure.
- Advancements in 5G and other communication technologies.
- Increased consumer demand for connected car features.
The North American market holds a dominant position, driven by strong technological advancements and high vehicle ownership rates.
Internet of Vehicle Industry Product Innovations
The IoV industry witnesses continuous product innovation, marked by advancements in autonomous driving technologies, enhanced cybersecurity measures, and the integration of AI and machine learning capabilities. New products focus on improving vehicle safety, enhancing driver experience, and optimizing fleet management. The market emphasizes seamless integration with mobile devices and cloud platforms, delivering a connected and personalized driving experience. The competitive advantage lies in offering innovative features, robust security, and superior user experience.
Report Segmentation & Scope
This report segments the IoV market across several dimensions: By Software Solutions (Real-time Transit Management System, Security Solution, Remote Monitoring System, Network Bandwidth Management, Fleet Management), By Applications (Mobility Management, Vehicle Management, Integrated Entertainment), and By End-user Industry (Transportation and Logistics, Automotive, Others). Each segment is analyzed in detail, providing market size estimations, growth projections, and competitive dynamics.
Key Drivers of Internet of Vehicle Industry Growth
Growth in the IoV industry is fueled by technological advancements like 5G and AI, supportive government policies promoting smart cities and connected infrastructure, and rising consumer demand for enhanced vehicle safety and infotainment. Economic factors such as increased disposable income and the affordability of connected cars further contribute to market growth.
Challenges in the Internet of Vehicle Industry Sector
The IoV sector faces challenges such as stringent data privacy regulations, concerns over cybersecurity vulnerabilities, the high cost of implementation and integration, and the complexity of managing vast amounts of data generated by connected vehicles. Supply chain disruptions also impact production and deployment. These factors can potentially hinder market growth if not addressed proactively.
Leading Players in the Internet of Vehicle Industry Market
- Infineon Technologies AG
- IBM Corporation
- Symantec Corporation
- Bosch Software Innovations GmbH
- Cisco Systems Inc
- Microsoft Corporation
- Tesla Motors Inc
- Waymo LLC (Alphabet Inc)
- Oracle Corporation
- General Electric Company
- SAP SE
Key Developments in Internet of Vehicle Industry Sector
- September 2022: Bosch and Mercedes-Benz's driverless parking system received commercial approval, signifying a significant advancement in automated driving technology.
- February 2023: Cisco Systems, Inc. partnered with Mercedes-Benz to optimize the mobile office experience in the new E-Class vehicles, enhancing productivity and connectivity within the car.
Strategic Internet of Vehicle Industry Market Outlook
The IoV market holds substantial future potential, driven by the continuous development of advanced technologies, increasing vehicle connectivity rates, and growing government support for smart infrastructure. Strategic opportunities lie in developing innovative solutions focusing on enhanced safety, improved fuel efficiency, and seamless integration with various smart city initiatives. The market is poised for significant growth, presenting attractive opportunities for companies to capitalize on the evolving landscape.
Internet of Vehicle Industry Segmentation
-
1. Software Solutions
- 1.1. Real time Transit Management System
- 1.2. Security Solution
- 1.3. Remote Monitoring System
- 1.4. Network Bandwidth Management
- 1.5. Fleet Management
-
2. Applications
- 2.1. Mobility Management
- 2.2. Vehicle Management
- 2.3. Integrated Entertainment
-
3. End-user Industry
- 3.1. Transportation and Logistics
- 3.2. Automotive
- 3.3. Others End User Industries
Internet of Vehicle Industry Segmentation By Geography
- 1. North America
- 2. Europe
- 3. Asia Pacific
- 4. Rest of the World
Internet of Vehicle Industry REPORT HIGHLIGHTS
| Aspects | Details |
|---|---|
| Study Period | 2019-2033 |
| Base Year | 2024 |
| Estimated Year | 2025 |
| Forecast Period | 2025-2033 |
| Historical Period | 2019-2024 |
| Growth Rate | CAGR of 16.38% from 2019-2033 |
| Segmentation |
|
Table of Contents
- 1. Introduction
- 1.1. Research Scope
- 1.2. Market Segmentation
- 1.3. Research Methodology
- 1.4. Definitions and Assumptions
- 2. Executive Summary
- 2.1. Introduction
- 3. Market Dynamics
- 3.1. Introduction
- 3.2. Market Drivers
- 3.2.1. Increased Government Funding and Investments in Connected Transport System; Growing Demand for Smart Applications in Cars
- 3.3. Market Restrains
- 3.3.1. Slower Rate of Penetration of Connected Systems across the Developing Economies; High Initial Cost of Smart Transportation System
- 3.4. Market Trends
- 3.4.1. Automotive Sector to Witness the Growth
- 4. Market Factor Analysis
- 4.1. Porters Five Forces
- 4.2. Supply/Value Chain
- 4.3. PESTEL analysis
- 4.4. Market Entropy
- 4.5. Patent/Trademark Analysis
- 5. Global Internet of Vehicle Industry Analysis, Insights and Forecast, 2019-2031
- 5.1. Market Analysis, Insights and Forecast - by Software Solutions
- 5.1.1. Real time Transit Management System
- 5.1.2. Security Solution
- 5.1.3. Remote Monitoring System
- 5.1.4. Network Bandwidth Management
- 5.1.5. Fleet Management
- 5.2. Market Analysis, Insights and Forecast - by Applications
- 5.2.1. Mobility Management
- 5.2.2. Vehicle Management
- 5.2.3. Integrated Entertainment
- 5.3. Market Analysis, Insights and Forecast - by End-user Industry
- 5.3.1. Transportation and Logistics
- 5.3.2. Automotive
- 5.3.3. Others End User Industries
- 5.4. Market Analysis, Insights and Forecast - by Region
- 5.4.1. North America
- 5.4.2. Europe
- 5.4.3. Asia Pacific
- 5.4.4. Rest of the World
- 5.1. Market Analysis, Insights and Forecast - by Software Solutions
- 6. North America Internet of Vehicle Industry Analysis, Insights and Forecast, 2019-2031
- 6.1. Market Analysis, Insights and Forecast - by Software Solutions
- 6.1.1. Real time Transit Management System
- 6.1.2. Security Solution
- 6.1.3. Remote Monitoring System
- 6.1.4. Network Bandwidth Management
- 6.1.5. Fleet Management
- 6.2. Market Analysis, Insights and Forecast - by Applications
- 6.2.1. Mobility Management
- 6.2.2. Vehicle Management
- 6.2.3. Integrated Entertainment
- 6.3. Market Analysis, Insights and Forecast - by End-user Industry
- 6.3.1. Transportation and Logistics
- 6.3.2. Automotive
- 6.3.3. Others End User Industries
- 6.1. Market Analysis, Insights and Forecast - by Software Solutions
- 7. Europe Internet of Vehicle Industry Analysis, Insights and Forecast, 2019-2031
- 7.1. Market Analysis, Insights and Forecast - by Software Solutions
- 7.1.1. Real time Transit Management System
- 7.1.2. Security Solution
- 7.1.3. Remote Monitoring System
- 7.1.4. Network Bandwidth Management
- 7.1.5. Fleet Management
- 7.2. Market Analysis, Insights and Forecast - by Applications
- 7.2.1. Mobility Management
- 7.2.2. Vehicle Management
- 7.2.3. Integrated Entertainment
- 7.3. Market Analysis, Insights and Forecast - by End-user Industry
- 7.3.1. Transportation and Logistics
- 7.3.2. Automotive
- 7.3.3. Others End User Industries
- 7.1. Market Analysis, Insights and Forecast - by Software Solutions
- 8. Asia Pacific Internet of Vehicle Industry Analysis, Insights and Forecast, 2019-2031
- 8.1. Market Analysis, Insights and Forecast - by Software Solutions
- 8.1.1. Real time Transit Management System
- 8.1.2. Security Solution
- 8.1.3. Remote Monitoring System
- 8.1.4. Network Bandwidth Management
- 8.1.5. Fleet Management
- 8.2. Market Analysis, Insights and Forecast - by Applications
- 8.2.1. Mobility Management
- 8.2.2. Vehicle Management
- 8.2.3. Integrated Entertainment
- 8.3. Market Analysis, Insights and Forecast - by End-user Industry
- 8.3.1. Transportation and Logistics
- 8.3.2. Automotive
- 8.3.3. Others End User Industries
- 8.1. Market Analysis, Insights and Forecast - by Software Solutions
- 9. Rest of the World Internet of Vehicle Industry Analysis, Insights and Forecast, 2019-2031
- 9.1. Market Analysis, Insights and Forecast - by Software Solutions
- 9.1.1. Real time Transit Management System
- 9.1.2. Security Solution
- 9.1.3. Remote Monitoring System
- 9.1.4. Network Bandwidth Management
- 9.1.5. Fleet Management
- 9.2. Market Analysis, Insights and Forecast - by Applications
- 9.2.1. Mobility Management
- 9.2.2. Vehicle Management
- 9.2.3. Integrated Entertainment
- 9.3. Market Analysis, Insights and Forecast - by End-user Industry
- 9.3.1. Transportation and Logistics
- 9.3.2. Automotive
- 9.3.3. Others End User Industries
- 9.1. Market Analysis, Insights and Forecast - by Software Solutions
- 10. North America Internet of Vehicle Industry Analysis, Insights and Forecast, 2019-2031
- 10.1. Market Analysis, Insights and Forecast - By Country/Sub-region
- 10.1.1 United States
- 10.1.2 Canada
- 10.1.3 Mexico
- 11. Europe Internet of Vehicle Industry Analysis, Insights and Forecast, 2019-2031
- 11.1. Market Analysis, Insights and Forecast - By Country/Sub-region
- 11.1.1 Germany
- 11.1.2 United Kingdom
- 11.1.3 France
- 11.1.4 Spain
- 11.1.5 Italy
- 11.1.6 Spain
- 11.1.7 Belgium
- 11.1.8 Netherland
- 11.1.9 Nordics
- 11.1.10 Rest of Europe
- 12. Asia Pacific Internet of Vehicle Industry Analysis, Insights and Forecast, 2019-2031
- 12.1. Market Analysis, Insights and Forecast - By Country/Sub-region
- 12.1.1 China
- 12.1.2 Japan
- 12.1.3 India
- 12.1.4 South Korea
- 12.1.5 Southeast Asia
- 12.1.6 Australia
- 12.1.7 Indonesia
- 12.1.8 Phillipes
- 12.1.9 Singapore
- 12.1.10 Thailandc
- 12.1.11 Rest of Asia Pacific
- 13. South America Internet of Vehicle Industry Analysis, Insights and Forecast, 2019-2031
- 13.1. Market Analysis, Insights and Forecast - By Country/Sub-region
- 13.1.1 Brazil
- 13.1.2 Argentina
- 13.1.3 Peru
- 13.1.4 Chile
- 13.1.5 Colombia
- 13.1.6 Ecuador
- 13.1.7 Venezuela
- 13.1.8 Rest of South America
- 14. North America Internet of Vehicle Industry Analysis, Insights and Forecast, 2019-2031
- 14.1. Market Analysis, Insights and Forecast - By Country/Sub-region
- 14.1.1 United States
- 14.1.2 Canada
- 14.1.3 Mexico
- 15. MEA Internet of Vehicle Industry Analysis, Insights and Forecast, 2019-2031
- 15.1. Market Analysis, Insights and Forecast - By Country/Sub-region
- 15.1.1 United Arab Emirates
- 15.1.2 Saudi Arabia
- 15.1.3 South Africa
- 15.1.4 Rest of Middle East and Africa
- 16. Competitive Analysis
- 16.1. Global Market Share Analysis 2024
- 16.2. Company Profiles
- 16.2.1 Infineon Technologies AG
- 16.2.1.1. Overview
- 16.2.1.2. Products
- 16.2.1.3. SWOT Analysis
- 16.2.1.4. Recent Developments
- 16.2.1.5. Financials (Based on Availability)
- 16.2.2 IBM Corporation
- 16.2.2.1. Overview
- 16.2.2.2. Products
- 16.2.2.3. SWOT Analysis
- 16.2.2.4. Recent Developments
- 16.2.2.5. Financials (Based on Availability)
- 16.2.3 Symantec Corporation
- 16.2.3.1. Overview
- 16.2.3.2. Products
- 16.2.3.3. SWOT Analysis
- 16.2.3.4. Recent Developments
- 16.2.3.5. Financials (Based on Availability)
- 16.2.4 Bosch Software Innovations GmbH
- 16.2.4.1. Overview
- 16.2.4.2. Products
- 16.2.4.3. SWOT Analysis
- 16.2.4.4. Recent Developments
- 16.2.4.5. Financials (Based on Availability)
- 16.2.5 Cisco Systems Inc
- 16.2.5.1. Overview
- 16.2.5.2. Products
- 16.2.5.3. SWOT Analysis
- 16.2.5.4. Recent Developments
- 16.2.5.5. Financials (Based on Availability)
- 16.2.6 Microsoft Corporation
- 16.2.6.1. Overview
- 16.2.6.2. Products
- 16.2.6.3. SWOT Analysis
- 16.2.6.4. Recent Developments
- 16.2.6.5. Financials (Based on Availability)
- 16.2.7 Tesla Motors Inc
- 16.2.7.1. Overview
- 16.2.7.2. Products
- 16.2.7.3. SWOT Analysis
- 16.2.7.4. Recent Developments
- 16.2.7.5. Financials (Based on Availability)
- 16.2.8 Waymo LLC (Alphabet Inc )
- 16.2.8.1. Overview
- 16.2.8.2. Products
- 16.2.8.3. SWOT Analysis
- 16.2.8.4. Recent Developments
- 16.2.8.5. Financials (Based on Availability)
- 16.2.9 Oracle Corporation
- 16.2.9.1. Overview
- 16.2.9.2. Products
- 16.2.9.3. SWOT Analysis
- 16.2.9.4. Recent Developments
- 16.2.9.5. Financials (Based on Availability)
- 16.2.10 General Electric Company
- 16.2.10.1. Overview
- 16.2.10.2. Products
- 16.2.10.3. SWOT Analysis
- 16.2.10.4. Recent Developments
- 16.2.10.5. Financials (Based on Availability)
- 16.2.11 SAP SE
- 16.2.11.1. Overview
- 16.2.11.2. Products
- 16.2.11.3. SWOT Analysis
- 16.2.11.4. Recent Developments
- 16.2.11.5. Financials (Based on Availability)
- 16.2.1 Infineon Technologies AG
List of Figures
- Figure 1: Global Internet of Vehicle Industry Revenue Breakdown (Million, %) by Region 2024 & 2032
- Figure 2: North America Internet of Vehicle Industry Revenue (Million), by Country 2024 & 2032
- Figure 3: North America Internet of Vehicle Industry Revenue Share (%), by Country 2024 & 2032
- Figure 4: Europe Internet of Vehicle Industry Revenue (Million), by Country 2024 & 2032
- Figure 5: Europe Internet of Vehicle Industry Revenue Share (%), by Country 2024 & 2032
- Figure 6: Asia Pacific Internet of Vehicle Industry Revenue (Million), by Country 2024 & 2032
- Figure 7: Asia Pacific Internet of Vehicle Industry Revenue Share (%), by Country 2024 & 2032
- Figure 8: South America Internet of Vehicle Industry Revenue (Million), by Country 2024 & 2032
- Figure 9: South America Internet of Vehicle Industry Revenue Share (%), by Country 2024 & 2032
- Figure 10: North America Internet of Vehicle Industry Revenue (Million), by Country 2024 & 2032
- Figure 11: North America Internet of Vehicle Industry Revenue Share (%), by Country 2024 & 2032
- Figure 12: MEA Internet of Vehicle Industry Revenue (Million), by Country 2024 & 2032
- Figure 13: MEA Internet of Vehicle Industry Revenue Share (%), by Country 2024 & 2032
- Figure 14: North America Internet of Vehicle Industry Revenue (Million), by Software Solutions 2024 & 2032
- Figure 15: North America Internet of Vehicle Industry Revenue Share (%), by Software Solutions 2024 & 2032
- Figure 16: North America Internet of Vehicle Industry Revenue (Million), by Applications 2024 & 2032
- Figure 17: North America Internet of Vehicle Industry Revenue Share (%), by Applications 2024 & 2032
- Figure 18: North America Internet of Vehicle Industry Revenue (Million), by End-user Industry 2024 & 2032
- Figure 19: North America Internet of Vehicle Industry Revenue Share (%), by End-user Industry 2024 & 2032
- Figure 20: North America Internet of Vehicle Industry Revenue (Million), by Country 2024 & 2032
- Figure 21: North America Internet of Vehicle Industry Revenue Share (%), by Country 2024 & 2032
- Figure 22: Europe Internet of Vehicle Industry Revenue (Million), by Software Solutions 2024 & 2032
- Figure 23: Europe Internet of Vehicle Industry Revenue Share (%), by Software Solutions 2024 & 2032
- Figure 24: Europe Internet of Vehicle Industry Revenue (Million), by Applications 2024 & 2032
- Figure 25: Europe Internet of Vehicle Industry Revenue Share (%), by Applications 2024 & 2032
- Figure 26: Europe Internet of Vehicle Industry Revenue (Million), by End-user Industry 2024 & 2032
- Figure 27: Europe Internet of Vehicle Industry Revenue Share (%), by End-user Industry 2024 & 2032
- Figure 28: Europe Internet of Vehicle Industry Revenue (Million), by Country 2024 & 2032
- Figure 29: Europe Internet of Vehicle Industry Revenue Share (%), by Country 2024 & 2032
- Figure 30: Asia Pacific Internet of Vehicle Industry Revenue (Million), by Software Solutions 2024 & 2032
- Figure 31: Asia Pacific Internet of Vehicle Industry Revenue Share (%), by Software Solutions 2024 & 2032
- Figure 32: Asia Pacific Internet of Vehicle Industry Revenue (Million), by Applications 2024 & 2032
- Figure 33: Asia Pacific Internet of Vehicle Industry Revenue Share (%), by Applications 2024 & 2032
- Figure 34: Asia Pacific Internet of Vehicle Industry Revenue (Million), by End-user Industry 2024 & 2032
- Figure 35: Asia Pacific Internet of Vehicle Industry Revenue Share (%), by End-user Industry 2024 & 2032
- Figure 36: Asia Pacific Internet of Vehicle Industry Revenue (Million), by Country 2024 & 2032
- Figure 37: Asia Pacific Internet of Vehicle Industry Revenue Share (%), by Country 2024 & 2032
- Figure 38: Rest of the World Internet of Vehicle Industry Revenue (Million), by Software Solutions 2024 & 2032
- Figure 39: Rest of the World Internet of Vehicle Industry Revenue Share (%), by Software Solutions 2024 & 2032
- Figure 40: Rest of the World Internet of Vehicle Industry Revenue (Million), by Applications 2024 & 2032
- Figure 41: Rest of the World Internet of Vehicle Industry Revenue Share (%), by Applications 2024 & 2032
- Figure 42: Rest of the World Internet of Vehicle Industry Revenue (Million), by End-user Industry 2024 & 2032
- Figure 43: Rest of the World Internet of Vehicle Industry Revenue Share (%), by End-user Industry 2024 & 2032
- Figure 44: Rest of the World Internet of Vehicle Industry Revenue (Million), by Country 2024 & 2032
- Figure 45: Rest of the World Internet of Vehicle Industry Revenue Share (%), by Country 2024 & 2032
List of Tables
- Table 1: Global Internet of Vehicle Industry Revenue Million Forecast, by Region 2019 & 2032
- Table 2: Global Internet of Vehicle Industry Revenue Million Forecast, by Software Solutions 2019 & 2032
- Table 3: Global Internet of Vehicle Industry Revenue Million Forecast, by Applications 2019 & 2032
- Table 4: Global Internet of Vehicle Industry Revenue Million Forecast, by End-user Industry 2019 & 2032
- Table 5: Global Internet of Vehicle Industry Revenue Million Forecast, by Region 2019 & 2032
- Table 6: Global Internet of Vehicle Industry Revenue Million Forecast, by Country 2019 & 2032
- Table 7: United States Internet of Vehicle Industry Revenue (Million) Forecast, by Application 2019 & 2032
- Table 8: Canada Internet of Vehicle Industry Revenue (Million) Forecast, by Application 2019 & 2032
- Table 9: Mexico Internet of Vehicle Industry Revenue (Million) Forecast, by Application 2019 & 2032
- Table 10: Global Internet of Vehicle Industry Revenue Million Forecast, by Country 2019 & 2032
- Table 11: Germany Internet of Vehicle Industry Revenue (Million) Forecast, by Application 2019 & 2032
- Table 12: United Kingdom Internet of Vehicle Industry Revenue (Million) Forecast, by Application 2019 & 2032
- Table 13: France Internet of Vehicle Industry Revenue (Million) Forecast, by Application 2019 & 2032
- Table 14: Spain Internet of Vehicle Industry Revenue (Million) Forecast, by Application 2019 & 2032
- Table 15: Italy Internet of Vehicle Industry Revenue (Million) Forecast, by Application 2019 & 2032
- Table 16: Spain Internet of Vehicle Industry Revenue (Million) Forecast, by Application 2019 & 2032
- Table 17: Belgium Internet of Vehicle Industry Revenue (Million) Forecast, by Application 2019 & 2032
- Table 18: Netherland Internet of Vehicle Industry Revenue (Million) Forecast, by Application 2019 & 2032
- Table 19: Nordics Internet of Vehicle Industry Revenue (Million) Forecast, by Application 2019 & 2032
- Table 20: Rest of Europe Internet of Vehicle Industry Revenue (Million) Forecast, by Application 2019 & 2032
- Table 21: Global Internet of Vehicle Industry Revenue Million Forecast, by Country 2019 & 2032
- Table 22: China Internet of Vehicle Industry Revenue (Million) Forecast, by Application 2019 & 2032
- Table 23: Japan Internet of Vehicle Industry Revenue (Million) Forecast, by Application 2019 & 2032
- Table 24: India Internet of Vehicle Industry Revenue (Million) Forecast, by Application 2019 & 2032
- Table 25: South Korea Internet of Vehicle Industry Revenue (Million) Forecast, by Application 2019 & 2032
- Table 26: Southeast Asia Internet of Vehicle Industry Revenue (Million) Forecast, by Application 2019 & 2032
- Table 27: Australia Internet of Vehicle Industry Revenue (Million) Forecast, by Application 2019 & 2032
- Table 28: Indonesia Internet of Vehicle Industry Revenue (Million) Forecast, by Application 2019 & 2032
- Table 29: Phillipes Internet of Vehicle Industry Revenue (Million) Forecast, by Application 2019 & 2032
- Table 30: Singapore Internet of Vehicle Industry Revenue (Million) Forecast, by Application 2019 & 2032
- Table 31: Thailandc Internet of Vehicle Industry Revenue (Million) Forecast, by Application 2019 & 2032
- Table 32: Rest of Asia Pacific Internet of Vehicle Industry Revenue (Million) Forecast, by Application 2019 & 2032
- Table 33: Global Internet of Vehicle Industry Revenue Million Forecast, by Country 2019 & 2032
- Table 34: Brazil Internet of Vehicle Industry Revenue (Million) Forecast, by Application 2019 & 2032
- Table 35: Argentina Internet of Vehicle Industry Revenue (Million) Forecast, by Application 2019 & 2032
- Table 36: Peru Internet of Vehicle Industry Revenue (Million) Forecast, by Application 2019 & 2032
- Table 37: Chile Internet of Vehicle Industry Revenue (Million) Forecast, by Application 2019 & 2032
- Table 38: Colombia Internet of Vehicle Industry Revenue (Million) Forecast, by Application 2019 & 2032
- Table 39: Ecuador Internet of Vehicle Industry Revenue (Million) Forecast, by Application 2019 & 2032
- Table 40: Venezuela Internet of Vehicle Industry Revenue (Million) Forecast, by Application 2019 & 2032
- Table 41: Rest of South America Internet of Vehicle Industry Revenue (Million) Forecast, by Application 2019 & 2032
- Table 42: Global Internet of Vehicle Industry Revenue Million Forecast, by Country 2019 & 2032
- Table 43: United States Internet of Vehicle Industry Revenue (Million) Forecast, by Application 2019 & 2032
- Table 44: Canada Internet of Vehicle Industry Revenue (Million) Forecast, by Application 2019 & 2032
- Table 45: Mexico Internet of Vehicle Industry Revenue (Million) Forecast, by Application 2019 & 2032
- Table 46: Global Internet of Vehicle Industry Revenue Million Forecast, by Country 2019 & 2032
- Table 47: United Arab Emirates Internet of Vehicle Industry Revenue (Million) Forecast, by Application 2019 & 2032
- Table 48: Saudi Arabia Internet of Vehicle Industry Revenue (Million) Forecast, by Application 2019 & 2032
- Table 49: South Africa Internet of Vehicle Industry Revenue (Million) Forecast, by Application 2019 & 2032
- Table 50: Rest of Middle East and Africa Internet of Vehicle Industry Revenue (Million) Forecast, by Application 2019 & 2032
- Table 51: Global Internet of Vehicle Industry Revenue Million Forecast, by Software Solutions 2019 & 2032
- Table 52: Global Internet of Vehicle Industry Revenue Million Forecast, by Applications 2019 & 2032
- Table 53: Global Internet of Vehicle Industry Revenue Million Forecast, by End-user Industry 2019 & 2032
- Table 54: Global Internet of Vehicle Industry Revenue Million Forecast, by Country 2019 & 2032
- Table 55: Global Internet of Vehicle Industry Revenue Million Forecast, by Software Solutions 2019 & 2032
- Table 56: Global Internet of Vehicle Industry Revenue Million Forecast, by Applications 2019 & 2032
- Table 57: Global Internet of Vehicle Industry Revenue Million Forecast, by End-user Industry 2019 & 2032
- Table 58: Global Internet of Vehicle Industry Revenue Million Forecast, by Country 2019 & 2032
- Table 59: Global Internet of Vehicle Industry Revenue Million Forecast, by Software Solutions 2019 & 2032
- Table 60: Global Internet of Vehicle Industry Revenue Million Forecast, by Applications 2019 & 2032
- Table 61: Global Internet of Vehicle Industry Revenue Million Forecast, by End-user Industry 2019 & 2032
- Table 62: Global Internet of Vehicle Industry Revenue Million Forecast, by Country 2019 & 2032
- Table 63: Global Internet of Vehicle Industry Revenue Million Forecast, by Software Solutions 2019 & 2032
- Table 64: Global Internet of Vehicle Industry Revenue Million Forecast, by Applications 2019 & 2032
- Table 65: Global Internet of Vehicle Industry Revenue Million Forecast, by End-user Industry 2019 & 2032
- Table 66: Global Internet of Vehicle Industry Revenue Million Forecast, by Country 2019 & 2032
Frequently Asked Questions
1. What is the projected Compound Annual Growth Rate (CAGR) of the Internet of Vehicle Industry?
The projected CAGR is approximately 16.38%.
2. Which companies are prominent players in the Internet of Vehicle Industry?
Key companies in the market include Infineon Technologies AG, IBM Corporation, Symantec Corporation, Bosch Software Innovations GmbH, Cisco Systems Inc, Microsoft Corporation, Tesla Motors Inc, Waymo LLC (Alphabet Inc ), Oracle Corporation, General Electric Company, SAP SE.
3. What are the main segments of the Internet of Vehicle Industry?
The market segments include Software Solutions, Applications, End-user Industry.
4. Can you provide details about the market size?
The market size is estimated to be USD 161.51 Million as of 2022.
5. What are some drivers contributing to market growth?
Increased Government Funding and Investments in Connected Transport System; Growing Demand for Smart Applications in Cars.
6. What are the notable trends driving market growth?
Automotive Sector to Witness the Growth.
7. Are there any restraints impacting market growth?
Slower Rate of Penetration of Connected Systems across the Developing Economies; High Initial Cost of Smart Transportation System.
8. Can you provide examples of recent developments in the market?
February 2023 - Cisco Systems, Inc has announced it is working with Mercedes-Benz to provide an optimal mobile office experience in its new Mercedes-Benz E Class vehicles. Where the partnership will help people get work done safely, securely, and comfortably in their cars, with the modern luxury and intuitive features that Mercedes-Benz and Webex customers are accustomed to
9. What pricing options are available for accessing the report?
Pricing options include single-user, multi-user, and enterprise licenses priced at USD 4750, USD 5250, and USD 8750 respectively.
10. Is the market size provided in terms of value or volume?
The market size is provided in terms of value, measured in Million.
11. Are there any specific market keywords associated with the report?
Yes, the market keyword associated with the report is "Internet of Vehicle Industry," which aids in identifying and referencing the specific market segment covered.
12. How do I determine which pricing option suits my needs best?
The pricing options vary based on user requirements and access needs. Individual users may opt for single-user licenses, while businesses requiring broader access may choose multi-user or enterprise licenses for cost-effective access to the report.
13. Are there any additional resources or data provided in the Internet of Vehicle Industry report?
While the report offers comprehensive insights, it's advisable to review the specific contents or supplementary materials provided to ascertain if additional resources or data are available.
14. How can I stay updated on further developments or reports in the Internet of Vehicle Industry?
To stay informed about further developments, trends, and reports in the Internet of Vehicle Industry, consider subscribing to industry newsletters, following relevant companies and organizations, or regularly checking reputable industry news sources and publications.
Methodology
Step 1 - Identification of Relevant Samples Size from Population Database


Step 2 - Approaches for Defining Global Market Size (Value, Volume* & Price*)

Note*: In applicable scenarios
Step 3 - Data Sources
Primary Research
- Web Analytics
- Survey Reports
- Research Institute
- Latest Research Reports
- Opinion Leaders
Secondary Research
- Annual Reports
- White Paper
- Latest Press Release
- Industry Association
- Paid Database
- Investor Presentations

Step 4 - Data Triangulation
Involves using different sources of information in order to increase the validity of a study
These sources are likely to be stakeholders in a program - participants, other researchers, program staff, other community members, and so on.
Then we put all data in single framework & apply various statistical tools to find out the dynamic on the market.
During the analysis stage, feedback from the stakeholder groups would be compared to determine areas of agreement as well as areas of divergence


