
Key Insights
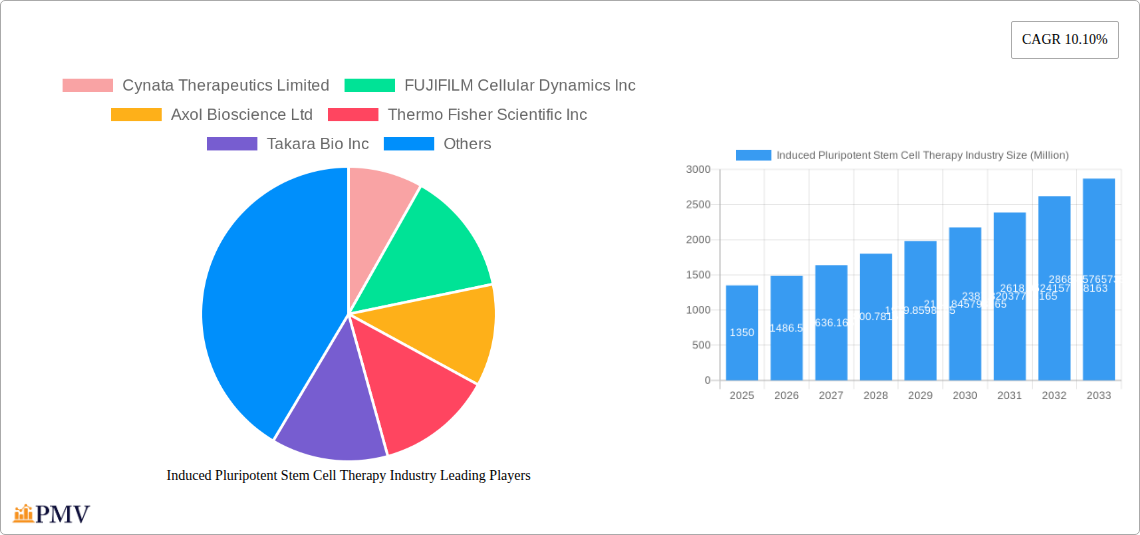
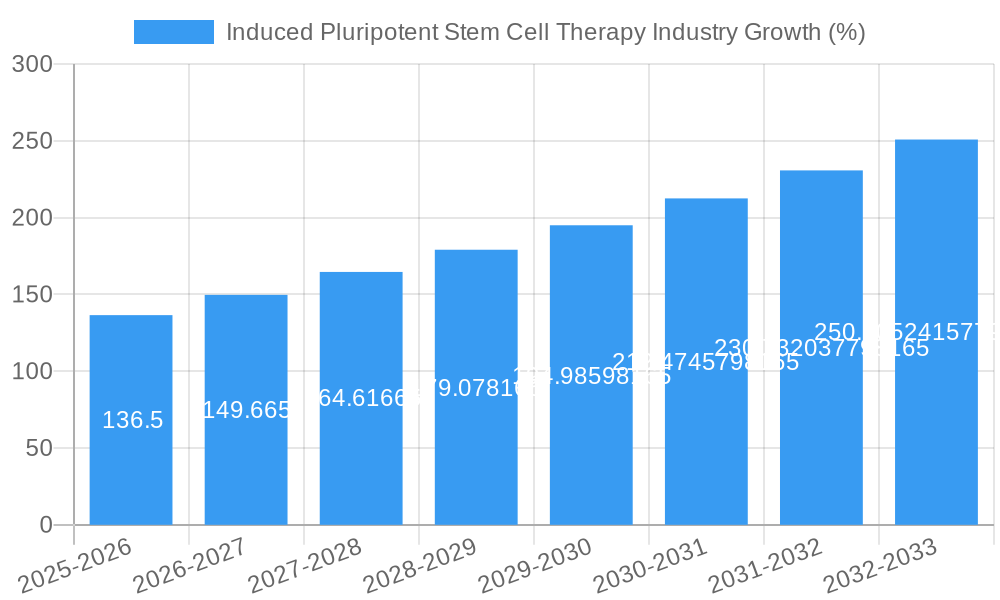
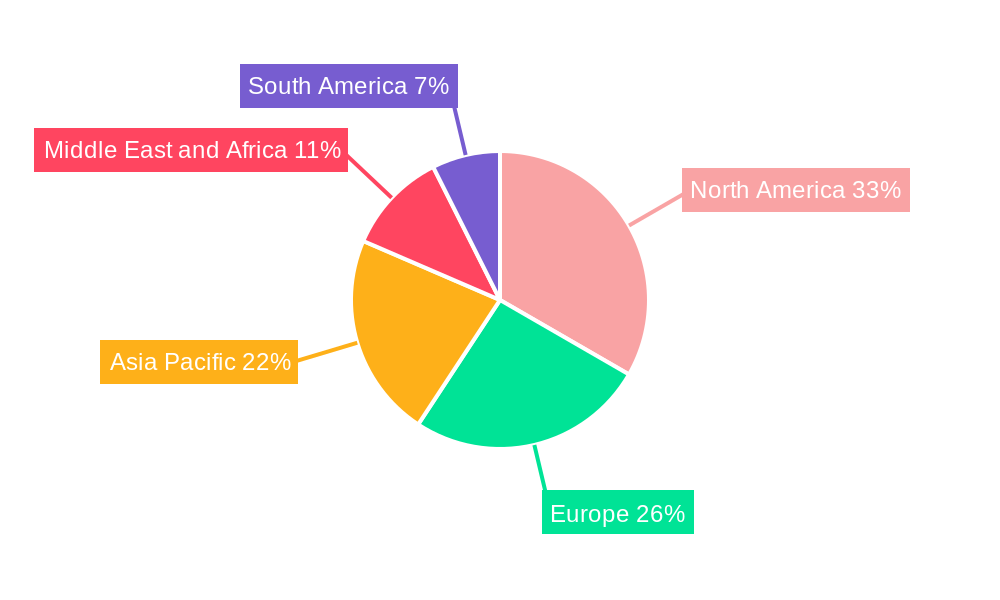
The induced pluripotent stem cell (iPSC) therapy market is experiencing robust growth, projected to reach $1.35 billion in 2025 and maintain a compound annual growth rate (CAGR) of 10.1% from 2025 to 2033. This expansion is driven by several key factors. Firstly, the increasing prevalence of chronic diseases like diabetes and Parkinson's disease fuels demand for innovative therapeutic approaches. iPSCs offer the potential to generate patient-specific cells for transplantation and disease modeling, personalized medicine representing a significant market driver. Secondly, advancements in iPSC technology, including improved cell differentiation protocols and enhanced safety profiles, are contributing to increased clinical trial activity and regulatory approvals, bolstering investor confidence and market expansion. The versatility of iPSCs also contributes to growth, as they can be differentiated into various cell types (hepatocytes, fibroblasts, keratinocytes, neurons) enabling their application across diverse therapeutic areas such as drug development, regenerative medicine, and toxicity testing. The market's segmentation further reflects its diverse applications, with Drug Development and Regenerative Medicine currently holding substantial market shares, followed by Tissue Engineering and Cell Therapy. North America and Europe currently dominate the market, however, the Asia-Pacific region is poised for significant growth due to increasing investments in research and development infrastructure.
While the market presents immense potential, challenges remain. The high cost of iPSC-based therapies, coupled with lengthy regulatory approval processes, can hinder widespread adoption. Furthermore, concerns regarding the potential for tumorigenicity and immune rejection require continued research and technological advancements to mitigate risks. Despite these challenges, the long-term outlook remains positive, fuelled by the ongoing development of innovative technologies, increasing collaborations between academia and industry, and growing government support for regenerative medicine research. The expanding application of iPSCs in disease modeling is also creating lucrative opportunities for researchers and pharmaceutical companies to accelerate drug discovery and development. Competition among key players like Cynata Therapeutics, FUJIFILM Cellular Dynamics, and Axol Bioscience, among others, is further stimulating innovation and driving market expansion. Over the forecast period, continued investment in R&D and strategic partnerships are expected to unlock the full therapeutic potential of iPSCs, leading to sustained market growth.
Induced Pluripotent Stem Cell Therapy Industry: A Comprehensive Market Report (2019-2033)
This detailed report provides a comprehensive analysis of the Induced Pluripotent Stem Cell (iPSC) Therapy industry, offering invaluable insights for investors, researchers, and industry professionals. With a study period spanning 2019-2033, a base year of 2025, and a forecast period of 2025-2033, this report offers a granular view of market trends, competitive dynamics, and future growth potential. The market is segmented by derived cell type, application, and end-user, providing a nuanced understanding of this rapidly evolving sector. The report's projected market value for 2025 is xx Million, with a Compound Annual Growth Rate (CAGR) of xx% during the forecast period.
Induced Pluripotent Stem Cell Therapy Industry Market Structure & Competitive Dynamics
The iPSC therapy market exhibits a moderately concentrated structure, with several key players dominating specific segments. Market share is influenced by factors such as technological innovation, regulatory approvals, and strategic partnerships. The industry is characterized by a dynamic innovation ecosystem, with ongoing research and development efforts driving the development of novel iPSC-derived therapies. Regulatory frameworks, particularly those concerning cell-based therapies, play a crucial role in market growth. Product substitutes, such as traditional drug therapies, pose competitive pressure. However, the unique advantages of iPSC therapies, particularly in regenerative medicine and personalized medicine, are driving market expansion.
End-user trends, primarily driven by the increasing demand for advanced therapeutic solutions from research institutions and pharmaceutical companies, are shaping market growth. Mergers and acquisitions (M&A) activity has been significant, with deal values reaching xx Million in recent years. Examples include:
- Strategic alliances between technology providers and pharmaceutical giants to expedite product development.
- Acquisitions of smaller biotech companies specializing in specific iPSC technologies.
- Consolidation among key players to enhance market share and expand product portfolios.
The competitive landscape is shaped by continuous innovation, strategic collaborations, and regulatory approvals. This report offers a detailed analysis of the competitive dynamics, including market share estimations for leading companies such as Cynata Therapeutics Limited, FUJIFILM Cellular Dynamics Inc, and Axol Bioscience Ltd.
Induced Pluripotent Stem Cell Therapy Industry Industry Trends & Insights
The iPSC therapy market is experiencing robust growth, fueled by several key trends. The increasing prevalence of chronic diseases requiring innovative treatment approaches significantly boosts the demand for iPSC-derived therapies. Technological advancements in iPSC derivation, differentiation, and scale-up are driving efficiency and reducing costs, thereby improving market accessibility. Consumer preferences are increasingly shifting towards personalized medicine, aligning perfectly with the tailored treatment options offered by iPSC therapies.
The industry's rapid growth is further supported by the rising adoption of iPSC-based drug discovery and development platforms. These platforms offer accelerated drug development, reduced costs, and increased accuracy in preclinical testing. Government initiatives promoting regenerative medicine and cell therapy research are also contributing to market expansion. However, challenges remain, such as regulatory complexities, high manufacturing costs, and the need for further clinical validation. This report analyzes these factors in detail and provides a forecast of market penetration and CAGR projections for various iPSC therapy applications.
Dominant Markets & Segments in Induced Pluripotent Stem Cell Therapy Industry
The North American region currently holds a dominant position in the iPSC therapy market, driven by strong research infrastructure, substantial investments in biotechnology, and supportive regulatory frameworks. Within this region, the United States represents the largest national market.
Key Drivers in North America:
- Robust funding for biomedical research and development.
- Presence of major pharmaceutical and biotechnology companies actively engaged in iPSC research.
- Well-established regulatory pathways for cell-based therapies.
Dominant Segments:
- Derived Cell Type: Hepatocytes and neurons are currently dominant due to established applications in drug development and disease modeling, respectively. However, the Fibroblasts and Keratinocytes segments are predicted to experience significant growth in the forecast period.
- Application: Drug development and regenerative medicine hold the largest market share, followed by toxicity testing and tissue engineering. The Cell Therapy application market segment is expected to witness exponential growth in the coming years.
- End User: Research institutions constitute a major portion of the market, while the other end-users (pharmaceutical and biotech companies) also show strong growth potential. This segment is projected to grow significantly due to increased outsourcing of iPSC-related research.
The report provides a detailed analysis of the market size and growth projections for each segment, highlighting the underlying factors driving their dominance.
Induced Pluripotent Stem Cell Therapy Industry Product Innovations
Recent advancements in iPSC technology have focused on improving the efficiency of cell derivation, differentiation, and scale-up. This includes the development of novel reprogramming techniques, improved culture media, and automated cell processing systems. Innovative applications are emerging, such as the creation of patient-specific iPSC-derived models for disease research and personalized medicine. The key competitive advantages lie in developing high-quality, readily accessible, and scalable iPSC platforms that meet the increasing demands of both research and clinical applications. This includes technologies that enhance the safety and efficacy of iPSC-derived therapies, leading to faster regulatory approval.
Report Segmentation & Scope
This report segments the iPSC therapy market across various dimensions:
Derived Cell Type: Hepatocytes, Fibroblasts, Keratinocytes, Neurons, and Others. Each segment's growth is analyzed considering factors like application-specific demand and technological advancements.
Application: Drug Development (including target identification, lead optimization, and toxicity testing), Regenerative Medicine, Toxicity Testing, Tissue Engineering, Cell Therapy, and Disease Modeling. Market size and growth projections are provided for each application, reflecting the varying growth rates of each therapeutic area.
End User: Research Institutions (academic institutions, government research labs) and Other End Users (pharmaceutical and biotech companies, contract research organizations). The influence of funding, research trends, and business models on the growth of each end-user segment is comprehensively evaluated.
Key Drivers of Induced Pluripotent Stem Cell Therapy Industry Growth
The iPSC therapy market's growth is driven by several key factors: increased funding for regenerative medicine research, advancements in iPSC technology enabling greater efficiency and scalability, growing demand for personalized medicine, and supportive regulatory environments in key markets. The increasing prevalence of chronic diseases further fuels the demand for novel therapeutic solutions, including iPSC-based therapies. The global initiatives promoting the development of innovative cell-based therapies and supportive government policies encouraging the development of regenerative medicine also contribute to this rapid expansion.
Challenges in the Induced Pluripotent Stem Cell Therapy Industry Sector
Significant challenges hinder the widespread adoption of iPSC therapies. Stringent regulatory pathways for cell-based therapies lengthen the approval process, impacting market entry timelines. The high cost of manufacturing iPSC-derived cells and associated infrastructure poses a significant barrier to market expansion, particularly for smaller biotech companies. Competitive pressures from existing drug therapies and the emergence of alternative cell-based therapies continue to shape the dynamics of this innovative field. These factors combined could lead to a xx Million decrease in market value by xx.
Leading Players in the Induced Pluripotent Stem Cell Therapy Industry Market
- Cynata Therapeutics Limited
- FUJIFILM Cellular Dynamics Inc
- Axol Bioscience Ltd
- Thermo Fisher Scientific Inc
- Takara Bio Inc
- REPROCELL USA Inc
- LizarBio Therapeutics (Pluricell Biotech)
- Fate Therapeutics Inc
- Sumitomo Dainippon Pharma Co Ltd
- Ncardia
- ViaCyte Inc
- Evotec SE
Key Developments in Induced Pluripotent Stem Cell Therapy Industry Sector
November 2022: Prepaire Labs signed a 5-year agreement with Ncardia to accelerate drug discovery and development. This collaboration underscores the increasing importance of iPSC-based platforms in drug development.
October 2022: CiRA Foundation and the Cell and Gene Therapy Catapult (CGT Catapult) launched a collaborative research initiative focused on iPS cell characterization, aiming to standardize iPSC technologies and accelerate their translation into clinical applications.
Strategic Induced Pluripotent Stem Cell Therapy Industry Market Outlook
The future of the iPSC therapy market appears bright, with significant growth potential driven by ongoing technological innovations, increasing demand for personalized medicine, and expanding applications across various therapeutic areas. Strategic partnerships and collaborations among key players will be critical for accelerating product development and market penetration. Focus on improving manufacturing efficiency, reducing costs, and securing regulatory approvals will be crucial for maximizing market potential. The global market is projected to reach xx Million by 2033, representing substantial growth opportunities for companies in this sector.
Induced Pluripotent Stem Cell Therapy Industry Segmentation
-
1. Derived Cell Type
- 1.1. Hepatocytes
- 1.2. Fibroblasts
- 1.3. Keratinocytes
- 1.4. Neurons
- 1.5. Others
-
2. Application
- 2.1. Drug Development
- 2.2. Regenerative Medicine
- 2.3. Toxicity Testing
- 2.4. Tissue Engineering
- 2.5. Cell Therapy
- 2.6. Disease Modeling
-
3. End User
- 3.1. Research Institutions
- 3.2. Other End Users
Induced Pluripotent Stem Cell Therapy Industry Segmentation By Geography
-
1. North America
- 1.1. United States
- 1.2. Canada
- 1.3. Mexico
-
2. Europe
- 2.1. Germany
- 2.2. United Kingdom
- 2.3. France
- 2.4. Italy
- 2.5. Spain
- 2.6. Rest of Europe
-
3. Asia Pacific
- 3.1. China
- 3.2. Japan
- 3.3. India
- 3.4. Australia
- 3.5. South Korea
- 3.6. Rest of Asia Pacific
-
4. Middle East and Africa
- 4.1. GCC
- 4.2. South Africa
- 4.3. Rest of Middle East and Africa
-
5. South America
- 5.1. Brazil
- 5.2. Argentina
- 5.3. Rest of South America
Induced Pluripotent Stem Cell Therapy Industry REPORT HIGHLIGHTS
| Aspects | Details |
|---|---|
| Study Period | 2019-2033 |
| Base Year | 2024 |
| Estimated Year | 2025 |
| Forecast Period | 2025-2033 |
| Historical Period | 2019-2024 |
| Growth Rate | CAGR of 10.10% from 2019-2033 |
| Segmentation |
|
Table of Contents
- 1. Introduction
- 1.1. Research Scope
- 1.2. Market Segmentation
- 1.3. Research Methodology
- 1.4. Definitions and Assumptions
- 2. Executive Summary
- 2.1. Introduction
- 3. Market Dynamics
- 3.1. Introduction
- 3.2. Market Drivers
- 3.2.1. Increase in Research and Development Activities in Stem Cells Therapies; Surge in Adoption of Personalized Medicine
- 3.3. Market Restrains
- 3.3.1. Lack of Awareness Regarding Stem Cell Therapies and High Cost of Treatment
- 3.4. Market Trends
- 3.4.1. Regenerative Medicine Segment is Expected to Witness Significant Growth Over the Forecast Period
- 4. Market Factor Analysis
- 4.1. Porters Five Forces
- 4.2. Supply/Value Chain
- 4.3. PESTEL analysis
- 4.4. Market Entropy
- 4.5. Patent/Trademark Analysis
- 5. Global Induced Pluripotent Stem Cell Therapy Industry Analysis, Insights and Forecast, 2019-2031
- 5.1. Market Analysis, Insights and Forecast - by Derived Cell Type
- 5.1.1. Hepatocytes
- 5.1.2. Fibroblasts
- 5.1.3. Keratinocytes
- 5.1.4. Neurons
- 5.1.5. Others
- 5.2. Market Analysis, Insights and Forecast - by Application
- 5.2.1. Drug Development
- 5.2.2. Regenerative Medicine
- 5.2.3. Toxicity Testing
- 5.2.4. Tissue Engineering
- 5.2.5. Cell Therapy
- 5.2.6. Disease Modeling
- 5.3. Market Analysis, Insights and Forecast - by End User
- 5.3.1. Research Institutions
- 5.3.2. Other End Users
- 5.4. Market Analysis, Insights and Forecast - by Region
- 5.4.1. North America
- 5.4.2. Europe
- 5.4.3. Asia Pacific
- 5.4.4. Middle East and Africa
- 5.4.5. South America
- 5.1. Market Analysis, Insights and Forecast - by Derived Cell Type
- 6. North America Induced Pluripotent Stem Cell Therapy Industry Analysis, Insights and Forecast, 2019-2031
- 6.1. Market Analysis, Insights and Forecast - by Derived Cell Type
- 6.1.1. Hepatocytes
- 6.1.2. Fibroblasts
- 6.1.3. Keratinocytes
- 6.1.4. Neurons
- 6.1.5. Others
- 6.2. Market Analysis, Insights and Forecast - by Application
- 6.2.1. Drug Development
- 6.2.2. Regenerative Medicine
- 6.2.3. Toxicity Testing
- 6.2.4. Tissue Engineering
- 6.2.5. Cell Therapy
- 6.2.6. Disease Modeling
- 6.3. Market Analysis, Insights and Forecast - by End User
- 6.3.1. Research Institutions
- 6.3.2. Other End Users
- 6.1. Market Analysis, Insights and Forecast - by Derived Cell Type
- 7. Europe Induced Pluripotent Stem Cell Therapy Industry Analysis, Insights and Forecast, 2019-2031
- 7.1. Market Analysis, Insights and Forecast - by Derived Cell Type
- 7.1.1. Hepatocytes
- 7.1.2. Fibroblasts
- 7.1.3. Keratinocytes
- 7.1.4. Neurons
- 7.1.5. Others
- 7.2. Market Analysis, Insights and Forecast - by Application
- 7.2.1. Drug Development
- 7.2.2. Regenerative Medicine
- 7.2.3. Toxicity Testing
- 7.2.4. Tissue Engineering
- 7.2.5. Cell Therapy
- 7.2.6. Disease Modeling
- 7.3. Market Analysis, Insights and Forecast - by End User
- 7.3.1. Research Institutions
- 7.3.2. Other End Users
- 7.1. Market Analysis, Insights and Forecast - by Derived Cell Type
- 8. Asia Pacific Induced Pluripotent Stem Cell Therapy Industry Analysis, Insights and Forecast, 2019-2031
- 8.1. Market Analysis, Insights and Forecast - by Derived Cell Type
- 8.1.1. Hepatocytes
- 8.1.2. Fibroblasts
- 8.1.3. Keratinocytes
- 8.1.4. Neurons
- 8.1.5. Others
- 8.2. Market Analysis, Insights and Forecast - by Application
- 8.2.1. Drug Development
- 8.2.2. Regenerative Medicine
- 8.2.3. Toxicity Testing
- 8.2.4. Tissue Engineering
- 8.2.5. Cell Therapy
- 8.2.6. Disease Modeling
- 8.3. Market Analysis, Insights and Forecast - by End User
- 8.3.1. Research Institutions
- 8.3.2. Other End Users
- 8.1. Market Analysis, Insights and Forecast - by Derived Cell Type
- 9. Middle East and Africa Induced Pluripotent Stem Cell Therapy Industry Analysis, Insights and Forecast, 2019-2031
- 9.1. Market Analysis, Insights and Forecast - by Derived Cell Type
- 9.1.1. Hepatocytes
- 9.1.2. Fibroblasts
- 9.1.3. Keratinocytes
- 9.1.4. Neurons
- 9.1.5. Others
- 9.2. Market Analysis, Insights and Forecast - by Application
- 9.2.1. Drug Development
- 9.2.2. Regenerative Medicine
- 9.2.3. Toxicity Testing
- 9.2.4. Tissue Engineering
- 9.2.5. Cell Therapy
- 9.2.6. Disease Modeling
- 9.3. Market Analysis, Insights and Forecast - by End User
- 9.3.1. Research Institutions
- 9.3.2. Other End Users
- 9.1. Market Analysis, Insights and Forecast - by Derived Cell Type
- 10. South America Induced Pluripotent Stem Cell Therapy Industry Analysis, Insights and Forecast, 2019-2031
- 10.1. Market Analysis, Insights and Forecast - by Derived Cell Type
- 10.1.1. Hepatocytes
- 10.1.2. Fibroblasts
- 10.1.3. Keratinocytes
- 10.1.4. Neurons
- 10.1.5. Others
- 10.2. Market Analysis, Insights and Forecast - by Application
- 10.2.1. Drug Development
- 10.2.2. Regenerative Medicine
- 10.2.3. Toxicity Testing
- 10.2.4. Tissue Engineering
- 10.2.5. Cell Therapy
- 10.2.6. Disease Modeling
- 10.3. Market Analysis, Insights and Forecast - by End User
- 10.3.1. Research Institutions
- 10.3.2. Other End Users
- 10.1. Market Analysis, Insights and Forecast - by Derived Cell Type
- 11. North America Induced Pluripotent Stem Cell Therapy Industry Analysis, Insights and Forecast, 2019-2031
- 11.1. Market Analysis, Insights and Forecast - By Country/Sub-region
- 11.1.1. undefined
- 12. Europe Induced Pluripotent Stem Cell Therapy Industry Analysis, Insights and Forecast, 2019-2031
- 12.1. Market Analysis, Insights and Forecast - By Country/Sub-region
- 12.1.1. undefined
- 13. Asia Pacific Induced Pluripotent Stem Cell Therapy Industry Analysis, Insights and Forecast, 2019-2031
- 13.1. Market Analysis, Insights and Forecast - By Country/Sub-region
- 13.1.1. undefined
- 14. Middle East and Africa Induced Pluripotent Stem Cell Therapy Industry Analysis, Insights and Forecast, 2019-2031
- 14.1. Market Analysis, Insights and Forecast - By Country/Sub-region
- 14.1.1. undefined
- 15. South America Induced Pluripotent Stem Cell Therapy Industry Analysis, Insights and Forecast, 2019-2031
- 15.1. Market Analysis, Insights and Forecast - By Country/Sub-region
- 15.1.1. undefined
- 16. Competitive Analysis
- 16.1. Global Market Share Analysis 2024
- 16.2. Company Profiles
- 16.2.1 Cynata Therapeutics Limited
- 16.2.1.1. Overview
- 16.2.1.2. Products
- 16.2.1.3. SWOT Analysis
- 16.2.1.4. Recent Developments
- 16.2.1.5. Financials (Based on Availability)
- 16.2.2 FUJIFILM Cellular Dynamics Inc
- 16.2.2.1. Overview
- 16.2.2.2. Products
- 16.2.2.3. SWOT Analysis
- 16.2.2.4. Recent Developments
- 16.2.2.5. Financials (Based on Availability)
- 16.2.3 Axol Bioscience Ltd
- 16.2.3.1. Overview
- 16.2.3.2. Products
- 16.2.3.3. SWOT Analysis
- 16.2.3.4. Recent Developments
- 16.2.3.5. Financials (Based on Availability)
- 16.2.4 Thermo Fisher Scientific Inc
- 16.2.4.1. Overview
- 16.2.4.2. Products
- 16.2.4.3. SWOT Analysis
- 16.2.4.4. Recent Developments
- 16.2.4.5. Financials (Based on Availability)
- 16.2.5 Takara Bio Inc
- 16.2.5.1. Overview
- 16.2.5.2. Products
- 16.2.5.3. SWOT Analysis
- 16.2.5.4. Recent Developments
- 16.2.5.5. Financials (Based on Availability)
- 16.2.6 REPROCELL USA Inc
- 16.2.6.1. Overview
- 16.2.6.2. Products
- 16.2.6.3. SWOT Analysis
- 16.2.6.4. Recent Developments
- 16.2.6.5. Financials (Based on Availability)
- 16.2.7 LizarBio Therapeutics (Pluricell Biotech)
- 16.2.7.1. Overview
- 16.2.7.2. Products
- 16.2.7.3. SWOT Analysis
- 16.2.7.4. Recent Developments
- 16.2.7.5. Financials (Based on Availability)
- 16.2.8 Fate Therapeutics Inc
- 16.2.8.1. Overview
- 16.2.8.2. Products
- 16.2.8.3. SWOT Analysis
- 16.2.8.4. Recent Developments
- 16.2.8.5. Financials (Based on Availability)
- 16.2.9 Sumitomo Dainippon Pharma Co Ltd
- 16.2.9.1. Overview
- 16.2.9.2. Products
- 16.2.9.3. SWOT Analysis
- 16.2.9.4. Recent Developments
- 16.2.9.5. Financials (Based on Availability)
- 16.2.10 Ncardia
- 16.2.10.1. Overview
- 16.2.10.2. Products
- 16.2.10.3. SWOT Analysis
- 16.2.10.4. Recent Developments
- 16.2.10.5. Financials (Based on Availability)
- 16.2.11 ViaCyte Inc
- 16.2.11.1. Overview
- 16.2.11.2. Products
- 16.2.11.3. SWOT Analysis
- 16.2.11.4. Recent Developments
- 16.2.11.5. Financials (Based on Availability)
- 16.2.12 Evotec SE
- 16.2.12.1. Overview
- 16.2.12.2. Products
- 16.2.12.3. SWOT Analysis
- 16.2.12.4. Recent Developments
- 16.2.12.5. Financials (Based on Availability)
- 16.2.1 Cynata Therapeutics Limited
List of Figures
- Figure 1: Global Induced Pluripotent Stem Cell Therapy Industry Revenue Breakdown (Million, %) by Region 2024 & 2032
- Figure 2: Global Induced Pluripotent Stem Cell Therapy Industry Volume Breakdown (K unit, %) by Region 2024 & 2032
- Figure 3: North America Induced Pluripotent Stem Cell Therapy Industry Revenue (Million), by Country 2024 & 2032
- Figure 4: North America Induced Pluripotent Stem Cell Therapy Industry Volume (K unit), by Country 2024 & 2032
- Figure 5: North America Induced Pluripotent Stem Cell Therapy Industry Revenue Share (%), by Country 2024 & 2032
- Figure 6: North America Induced Pluripotent Stem Cell Therapy Industry Volume Share (%), by Country 2024 & 2032
- Figure 7: Europe Induced Pluripotent Stem Cell Therapy Industry Revenue (Million), by Country 2024 & 2032
- Figure 8: Europe Induced Pluripotent Stem Cell Therapy Industry Volume (K unit), by Country 2024 & 2032
- Figure 9: Europe Induced Pluripotent Stem Cell Therapy Industry Revenue Share (%), by Country 2024 & 2032
- Figure 10: Europe Induced Pluripotent Stem Cell Therapy Industry Volume Share (%), by Country 2024 & 2032
- Figure 11: Asia Pacific Induced Pluripotent Stem Cell Therapy Industry Revenue (Million), by Country 2024 & 2032
- Figure 12: Asia Pacific Induced Pluripotent Stem Cell Therapy Industry Volume (K unit), by Country 2024 & 2032
- Figure 13: Asia Pacific Induced Pluripotent Stem Cell Therapy Industry Revenue Share (%), by Country 2024 & 2032
- Figure 14: Asia Pacific Induced Pluripotent Stem Cell Therapy Industry Volume Share (%), by Country 2024 & 2032
- Figure 15: Middle East and Africa Induced Pluripotent Stem Cell Therapy Industry Revenue (Million), by Country 2024 & 2032
- Figure 16: Middle East and Africa Induced Pluripotent Stem Cell Therapy Industry Volume (K unit), by Country 2024 & 2032
- Figure 17: Middle East and Africa Induced Pluripotent Stem Cell Therapy Industry Revenue Share (%), by Country 2024 & 2032
- Figure 18: Middle East and Africa Induced Pluripotent Stem Cell Therapy Industry Volume Share (%), by Country 2024 & 2032
- Figure 19: South America Induced Pluripotent Stem Cell Therapy Industry Revenue (Million), by Country 2024 & 2032
- Figure 20: South America Induced Pluripotent Stem Cell Therapy Industry Volume (K unit), by Country 2024 & 2032
- Figure 21: South America Induced Pluripotent Stem Cell Therapy Industry Revenue Share (%), by Country 2024 & 2032
- Figure 22: South America Induced Pluripotent Stem Cell Therapy Industry Volume Share (%), by Country 2024 & 2032
- Figure 23: North America Induced Pluripotent Stem Cell Therapy Industry Revenue (Million), by Derived Cell Type 2024 & 2032
- Figure 24: North America Induced Pluripotent Stem Cell Therapy Industry Volume (K unit), by Derived Cell Type 2024 & 2032
- Figure 25: North America Induced Pluripotent Stem Cell Therapy Industry Revenue Share (%), by Derived Cell Type 2024 & 2032
- Figure 26: North America Induced Pluripotent Stem Cell Therapy Industry Volume Share (%), by Derived Cell Type 2024 & 2032
- Figure 27: North America Induced Pluripotent Stem Cell Therapy Industry Revenue (Million), by Application 2024 & 2032
- Figure 28: North America Induced Pluripotent Stem Cell Therapy Industry Volume (K unit), by Application 2024 & 2032
- Figure 29: North America Induced Pluripotent Stem Cell Therapy Industry Revenue Share (%), by Application 2024 & 2032
- Figure 30: North America Induced Pluripotent Stem Cell Therapy Industry Volume Share (%), by Application 2024 & 2032
- Figure 31: North America Induced Pluripotent Stem Cell Therapy Industry Revenue (Million), by End User 2024 & 2032
- Figure 32: North America Induced Pluripotent Stem Cell Therapy Industry Volume (K unit), by End User 2024 & 2032
- Figure 33: North America Induced Pluripotent Stem Cell Therapy Industry Revenue Share (%), by End User 2024 & 2032
- Figure 34: North America Induced Pluripotent Stem Cell Therapy Industry Volume Share (%), by End User 2024 & 2032
- Figure 35: North America Induced Pluripotent Stem Cell Therapy Industry Revenue (Million), by Country 2024 & 2032
- Figure 36: North America Induced Pluripotent Stem Cell Therapy Industry Volume (K unit), by Country 2024 & 2032
- Figure 37: North America Induced Pluripotent Stem Cell Therapy Industry Revenue Share (%), by Country 2024 & 2032
- Figure 38: North America Induced Pluripotent Stem Cell Therapy Industry Volume Share (%), by Country 2024 & 2032
- Figure 39: Europe Induced Pluripotent Stem Cell Therapy Industry Revenue (Million), by Derived Cell Type 2024 & 2032
- Figure 40: Europe Induced Pluripotent Stem Cell Therapy Industry Volume (K unit), by Derived Cell Type 2024 & 2032
- Figure 41: Europe Induced Pluripotent Stem Cell Therapy Industry Revenue Share (%), by Derived Cell Type 2024 & 2032
- Figure 42: Europe Induced Pluripotent Stem Cell Therapy Industry Volume Share (%), by Derived Cell Type 2024 & 2032
- Figure 43: Europe Induced Pluripotent Stem Cell Therapy Industry Revenue (Million), by Application 2024 & 2032
- Figure 44: Europe Induced Pluripotent Stem Cell Therapy Industry Volume (K unit), by Application 2024 & 2032
- Figure 45: Europe Induced Pluripotent Stem Cell Therapy Industry Revenue Share (%), by Application 2024 & 2032
- Figure 46: Europe Induced Pluripotent Stem Cell Therapy Industry Volume Share (%), by Application 2024 & 2032
- Figure 47: Europe Induced Pluripotent Stem Cell Therapy Industry Revenue (Million), by End User 2024 & 2032
- Figure 48: Europe Induced Pluripotent Stem Cell Therapy Industry Volume (K unit), by End User 2024 & 2032
- Figure 49: Europe Induced Pluripotent Stem Cell Therapy Industry Revenue Share (%), by End User 2024 & 2032
- Figure 50: Europe Induced Pluripotent Stem Cell Therapy Industry Volume Share (%), by End User 2024 & 2032
- Figure 51: Europe Induced Pluripotent Stem Cell Therapy Industry Revenue (Million), by Country 2024 & 2032
- Figure 52: Europe Induced Pluripotent Stem Cell Therapy Industry Volume (K unit), by Country 2024 & 2032
- Figure 53: Europe Induced Pluripotent Stem Cell Therapy Industry Revenue Share (%), by Country 2024 & 2032
- Figure 54: Europe Induced Pluripotent Stem Cell Therapy Industry Volume Share (%), by Country 2024 & 2032
- Figure 55: Asia Pacific Induced Pluripotent Stem Cell Therapy Industry Revenue (Million), by Derived Cell Type 2024 & 2032
- Figure 56: Asia Pacific Induced Pluripotent Stem Cell Therapy Industry Volume (K unit), by Derived Cell Type 2024 & 2032
- Figure 57: Asia Pacific Induced Pluripotent Stem Cell Therapy Industry Revenue Share (%), by Derived Cell Type 2024 & 2032
- Figure 58: Asia Pacific Induced Pluripotent Stem Cell Therapy Industry Volume Share (%), by Derived Cell Type 2024 & 2032
- Figure 59: Asia Pacific Induced Pluripotent Stem Cell Therapy Industry Revenue (Million), by Application 2024 & 2032
- Figure 60: Asia Pacific Induced Pluripotent Stem Cell Therapy Industry Volume (K unit), by Application 2024 & 2032
- Figure 61: Asia Pacific Induced Pluripotent Stem Cell Therapy Industry Revenue Share (%), by Application 2024 & 2032
- Figure 62: Asia Pacific Induced Pluripotent Stem Cell Therapy Industry Volume Share (%), by Application 2024 & 2032
- Figure 63: Asia Pacific Induced Pluripotent Stem Cell Therapy Industry Revenue (Million), by End User 2024 & 2032
- Figure 64: Asia Pacific Induced Pluripotent Stem Cell Therapy Industry Volume (K unit), by End User 2024 & 2032
- Figure 65: Asia Pacific Induced Pluripotent Stem Cell Therapy Industry Revenue Share (%), by End User 2024 & 2032
- Figure 66: Asia Pacific Induced Pluripotent Stem Cell Therapy Industry Volume Share (%), by End User 2024 & 2032
- Figure 67: Asia Pacific Induced Pluripotent Stem Cell Therapy Industry Revenue (Million), by Country 2024 & 2032
- Figure 68: Asia Pacific Induced Pluripotent Stem Cell Therapy Industry Volume (K unit), by Country 2024 & 2032
- Figure 69: Asia Pacific Induced Pluripotent Stem Cell Therapy Industry Revenue Share (%), by Country 2024 & 2032
- Figure 70: Asia Pacific Induced Pluripotent Stem Cell Therapy Industry Volume Share (%), by Country 2024 & 2032
- Figure 71: Middle East and Africa Induced Pluripotent Stem Cell Therapy Industry Revenue (Million), by Derived Cell Type 2024 & 2032
- Figure 72: Middle East and Africa Induced Pluripotent Stem Cell Therapy Industry Volume (K unit), by Derived Cell Type 2024 & 2032
- Figure 73: Middle East and Africa Induced Pluripotent Stem Cell Therapy Industry Revenue Share (%), by Derived Cell Type 2024 & 2032
- Figure 74: Middle East and Africa Induced Pluripotent Stem Cell Therapy Industry Volume Share (%), by Derived Cell Type 2024 & 2032
- Figure 75: Middle East and Africa Induced Pluripotent Stem Cell Therapy Industry Revenue (Million), by Application 2024 & 2032
- Figure 76: Middle East and Africa Induced Pluripotent Stem Cell Therapy Industry Volume (K unit), by Application 2024 & 2032
- Figure 77: Middle East and Africa Induced Pluripotent Stem Cell Therapy Industry Revenue Share (%), by Application 2024 & 2032
- Figure 78: Middle East and Africa Induced Pluripotent Stem Cell Therapy Industry Volume Share (%), by Application 2024 & 2032
- Figure 79: Middle East and Africa Induced Pluripotent Stem Cell Therapy Industry Revenue (Million), by End User 2024 & 2032
- Figure 80: Middle East and Africa Induced Pluripotent Stem Cell Therapy Industry Volume (K unit), by End User 2024 & 2032
- Figure 81: Middle East and Africa Induced Pluripotent Stem Cell Therapy Industry Revenue Share (%), by End User 2024 & 2032
- Figure 82: Middle East and Africa Induced Pluripotent Stem Cell Therapy Industry Volume Share (%), by End User 2024 & 2032
- Figure 83: Middle East and Africa Induced Pluripotent Stem Cell Therapy Industry Revenue (Million), by Country 2024 & 2032
- Figure 84: Middle East and Africa Induced Pluripotent Stem Cell Therapy Industry Volume (K unit), by Country 2024 & 2032
- Figure 85: Middle East and Africa Induced Pluripotent Stem Cell Therapy Industry Revenue Share (%), by Country 2024 & 2032
- Figure 86: Middle East and Africa Induced Pluripotent Stem Cell Therapy Industry Volume Share (%), by Country 2024 & 2032
- Figure 87: South America Induced Pluripotent Stem Cell Therapy Industry Revenue (Million), by Derived Cell Type 2024 & 2032
- Figure 88: South America Induced Pluripotent Stem Cell Therapy Industry Volume (K unit), by Derived Cell Type 2024 & 2032
- Figure 89: South America Induced Pluripotent Stem Cell Therapy Industry Revenue Share (%), by Derived Cell Type 2024 & 2032
- Figure 90: South America Induced Pluripotent Stem Cell Therapy Industry Volume Share (%), by Derived Cell Type 2024 & 2032
- Figure 91: South America Induced Pluripotent Stem Cell Therapy Industry Revenue (Million), by Application 2024 & 2032
- Figure 92: South America Induced Pluripotent Stem Cell Therapy Industry Volume (K unit), by Application 2024 & 2032
- Figure 93: South America Induced Pluripotent Stem Cell Therapy Industry Revenue Share (%), by Application 2024 & 2032
- Figure 94: South America Induced Pluripotent Stem Cell Therapy Industry Volume Share (%), by Application 2024 & 2032
- Figure 95: South America Induced Pluripotent Stem Cell Therapy Industry Revenue (Million), by End User 2024 & 2032
- Figure 96: South America Induced Pluripotent Stem Cell Therapy Industry Volume (K unit), by End User 2024 & 2032
- Figure 97: South America Induced Pluripotent Stem Cell Therapy Industry Revenue Share (%), by End User 2024 & 2032
- Figure 98: South America Induced Pluripotent Stem Cell Therapy Industry Volume Share (%), by End User 2024 & 2032
- Figure 99: South America Induced Pluripotent Stem Cell Therapy Industry Revenue (Million), by Country 2024 & 2032
- Figure 100: South America Induced Pluripotent Stem Cell Therapy Industry Volume (K unit), by Country 2024 & 2032
- Figure 101: South America Induced Pluripotent Stem Cell Therapy Industry Revenue Share (%), by Country 2024 & 2032
- Figure 102: South America Induced Pluripotent Stem Cell Therapy Industry Volume Share (%), by Country 2024 & 2032
List of Tables
- Table 1: Global Induced Pluripotent Stem Cell Therapy Industry Revenue Million Forecast, by Region 2019 & 2032
- Table 2: Global Induced Pluripotent Stem Cell Therapy Industry Volume K unit Forecast, by Region 2019 & 2032
- Table 3: Global Induced Pluripotent Stem Cell Therapy Industry Revenue Million Forecast, by Derived Cell Type 2019 & 2032
- Table 4: Global Induced Pluripotent Stem Cell Therapy Industry Volume K unit Forecast, by Derived Cell Type 2019 & 2032
- Table 5: Global Induced Pluripotent Stem Cell Therapy Industry Revenue Million Forecast, by Application 2019 & 2032
- Table 6: Global Induced Pluripotent Stem Cell Therapy Industry Volume K unit Forecast, by Application 2019 & 2032
- Table 7: Global Induced Pluripotent Stem Cell Therapy Industry Revenue Million Forecast, by End User 2019 & 2032
- Table 8: Global Induced Pluripotent Stem Cell Therapy Industry Volume K unit Forecast, by End User 2019 & 2032
- Table 9: Global Induced Pluripotent Stem Cell Therapy Industry Revenue Million Forecast, by Region 2019 & 2032
- Table 10: Global Induced Pluripotent Stem Cell Therapy Industry Volume K unit Forecast, by Region 2019 & 2032
- Table 11: Global Induced Pluripotent Stem Cell Therapy Industry Revenue Million Forecast, by Country 2019 & 2032
- Table 12: Global Induced Pluripotent Stem Cell Therapy Industry Volume K unit Forecast, by Country 2019 & 2032
- Table 13: Global Induced Pluripotent Stem Cell Therapy Industry Revenue Million Forecast, by Country 2019 & 2032
- Table 14: Global Induced Pluripotent Stem Cell Therapy Industry Volume K unit Forecast, by Country 2019 & 2032
- Table 15: Global Induced Pluripotent Stem Cell Therapy Industry Revenue Million Forecast, by Country 2019 & 2032
- Table 16: Global Induced Pluripotent Stem Cell Therapy Industry Volume K unit Forecast, by Country 2019 & 2032
- Table 17: Global Induced Pluripotent Stem Cell Therapy Industry Revenue Million Forecast, by Country 2019 & 2032
- Table 18: Global Induced Pluripotent Stem Cell Therapy Industry Volume K unit Forecast, by Country 2019 & 2032
- Table 19: Global Induced Pluripotent Stem Cell Therapy Industry Revenue Million Forecast, by Country 2019 & 2032
- Table 20: Global Induced Pluripotent Stem Cell Therapy Industry Volume K unit Forecast, by Country 2019 & 2032
- Table 21: Global Induced Pluripotent Stem Cell Therapy Industry Revenue Million Forecast, by Derived Cell Type 2019 & 2032
- Table 22: Global Induced Pluripotent Stem Cell Therapy Industry Volume K unit Forecast, by Derived Cell Type 2019 & 2032
- Table 23: Global Induced Pluripotent Stem Cell Therapy Industry Revenue Million Forecast, by Application 2019 & 2032
- Table 24: Global Induced Pluripotent Stem Cell Therapy Industry Volume K unit Forecast, by Application 2019 & 2032
- Table 25: Global Induced Pluripotent Stem Cell Therapy Industry Revenue Million Forecast, by End User 2019 & 2032
- Table 26: Global Induced Pluripotent Stem Cell Therapy Industry Volume K unit Forecast, by End User 2019 & 2032
- Table 27: Global Induced Pluripotent Stem Cell Therapy Industry Revenue Million Forecast, by Country 2019 & 2032
- Table 28: Global Induced Pluripotent Stem Cell Therapy Industry Volume K unit Forecast, by Country 2019 & 2032
- Table 29: United States Induced Pluripotent Stem Cell Therapy Industry Revenue (Million) Forecast, by Application 2019 & 2032
- Table 30: United States Induced Pluripotent Stem Cell Therapy Industry Volume (K unit) Forecast, by Application 2019 & 2032
- Table 31: Canada Induced Pluripotent Stem Cell Therapy Industry Revenue (Million) Forecast, by Application 2019 & 2032
- Table 32: Canada Induced Pluripotent Stem Cell Therapy Industry Volume (K unit) Forecast, by Application 2019 & 2032
- Table 33: Mexico Induced Pluripotent Stem Cell Therapy Industry Revenue (Million) Forecast, by Application 2019 & 2032
- Table 34: Mexico Induced Pluripotent Stem Cell Therapy Industry Volume (K unit) Forecast, by Application 2019 & 2032
- Table 35: Global Induced Pluripotent Stem Cell Therapy Industry Revenue Million Forecast, by Derived Cell Type 2019 & 2032
- Table 36: Global Induced Pluripotent Stem Cell Therapy Industry Volume K unit Forecast, by Derived Cell Type 2019 & 2032
- Table 37: Global Induced Pluripotent Stem Cell Therapy Industry Revenue Million Forecast, by Application 2019 & 2032
- Table 38: Global Induced Pluripotent Stem Cell Therapy Industry Volume K unit Forecast, by Application 2019 & 2032
- Table 39: Global Induced Pluripotent Stem Cell Therapy Industry Revenue Million Forecast, by End User 2019 & 2032
- Table 40: Global Induced Pluripotent Stem Cell Therapy Industry Volume K unit Forecast, by End User 2019 & 2032
- Table 41: Global Induced Pluripotent Stem Cell Therapy Industry Revenue Million Forecast, by Country 2019 & 2032
- Table 42: Global Induced Pluripotent Stem Cell Therapy Industry Volume K unit Forecast, by Country 2019 & 2032
- Table 43: Germany Induced Pluripotent Stem Cell Therapy Industry Revenue (Million) Forecast, by Application 2019 & 2032
- Table 44: Germany Induced Pluripotent Stem Cell Therapy Industry Volume (K unit) Forecast, by Application 2019 & 2032
- Table 45: United Kingdom Induced Pluripotent Stem Cell Therapy Industry Revenue (Million) Forecast, by Application 2019 & 2032
- Table 46: United Kingdom Induced Pluripotent Stem Cell Therapy Industry Volume (K unit) Forecast, by Application 2019 & 2032
- Table 47: France Induced Pluripotent Stem Cell Therapy Industry Revenue (Million) Forecast, by Application 2019 & 2032
- Table 48: France Induced Pluripotent Stem Cell Therapy Industry Volume (K unit) Forecast, by Application 2019 & 2032
- Table 49: Italy Induced Pluripotent Stem Cell Therapy Industry Revenue (Million) Forecast, by Application 2019 & 2032
- Table 50: Italy Induced Pluripotent Stem Cell Therapy Industry Volume (K unit) Forecast, by Application 2019 & 2032
- Table 51: Spain Induced Pluripotent Stem Cell Therapy Industry Revenue (Million) Forecast, by Application 2019 & 2032
- Table 52: Spain Induced Pluripotent Stem Cell Therapy Industry Volume (K unit) Forecast, by Application 2019 & 2032
- Table 53: Rest of Europe Induced Pluripotent Stem Cell Therapy Industry Revenue (Million) Forecast, by Application 2019 & 2032
- Table 54: Rest of Europe Induced Pluripotent Stem Cell Therapy Industry Volume (K unit) Forecast, by Application 2019 & 2032
- Table 55: Global Induced Pluripotent Stem Cell Therapy Industry Revenue Million Forecast, by Derived Cell Type 2019 & 2032
- Table 56: Global Induced Pluripotent Stem Cell Therapy Industry Volume K unit Forecast, by Derived Cell Type 2019 & 2032
- Table 57: Global Induced Pluripotent Stem Cell Therapy Industry Revenue Million Forecast, by Application 2019 & 2032
- Table 58: Global Induced Pluripotent Stem Cell Therapy Industry Volume K unit Forecast, by Application 2019 & 2032
- Table 59: Global Induced Pluripotent Stem Cell Therapy Industry Revenue Million Forecast, by End User 2019 & 2032
- Table 60: Global Induced Pluripotent Stem Cell Therapy Industry Volume K unit Forecast, by End User 2019 & 2032
- Table 61: Global Induced Pluripotent Stem Cell Therapy Industry Revenue Million Forecast, by Country 2019 & 2032
- Table 62: Global Induced Pluripotent Stem Cell Therapy Industry Volume K unit Forecast, by Country 2019 & 2032
- Table 63: China Induced Pluripotent Stem Cell Therapy Industry Revenue (Million) Forecast, by Application 2019 & 2032
- Table 64: China Induced Pluripotent Stem Cell Therapy Industry Volume (K unit) Forecast, by Application 2019 & 2032
- Table 65: Japan Induced Pluripotent Stem Cell Therapy Industry Revenue (Million) Forecast, by Application 2019 & 2032
- Table 66: Japan Induced Pluripotent Stem Cell Therapy Industry Volume (K unit) Forecast, by Application 2019 & 2032
- Table 67: India Induced Pluripotent Stem Cell Therapy Industry Revenue (Million) Forecast, by Application 2019 & 2032
- Table 68: India Induced Pluripotent Stem Cell Therapy Industry Volume (K unit) Forecast, by Application 2019 & 2032
- Table 69: Australia Induced Pluripotent Stem Cell Therapy Industry Revenue (Million) Forecast, by Application 2019 & 2032
- Table 70: Australia Induced Pluripotent Stem Cell Therapy Industry Volume (K unit) Forecast, by Application 2019 & 2032
- Table 71: South Korea Induced Pluripotent Stem Cell Therapy Industry Revenue (Million) Forecast, by Application 2019 & 2032
- Table 72: South Korea Induced Pluripotent Stem Cell Therapy Industry Volume (K unit) Forecast, by Application 2019 & 2032
- Table 73: Rest of Asia Pacific Induced Pluripotent Stem Cell Therapy Industry Revenue (Million) Forecast, by Application 2019 & 2032
- Table 74: Rest of Asia Pacific Induced Pluripotent Stem Cell Therapy Industry Volume (K unit) Forecast, by Application 2019 & 2032
- Table 75: Global Induced Pluripotent Stem Cell Therapy Industry Revenue Million Forecast, by Derived Cell Type 2019 & 2032
- Table 76: Global Induced Pluripotent Stem Cell Therapy Industry Volume K unit Forecast, by Derived Cell Type 2019 & 2032
- Table 77: Global Induced Pluripotent Stem Cell Therapy Industry Revenue Million Forecast, by Application 2019 & 2032
- Table 78: Global Induced Pluripotent Stem Cell Therapy Industry Volume K unit Forecast, by Application 2019 & 2032
- Table 79: Global Induced Pluripotent Stem Cell Therapy Industry Revenue Million Forecast, by End User 2019 & 2032
- Table 80: Global Induced Pluripotent Stem Cell Therapy Industry Volume K unit Forecast, by End User 2019 & 2032
- Table 81: Global Induced Pluripotent Stem Cell Therapy Industry Revenue Million Forecast, by Country 2019 & 2032
- Table 82: Global Induced Pluripotent Stem Cell Therapy Industry Volume K unit Forecast, by Country 2019 & 2032
- Table 83: GCC Induced Pluripotent Stem Cell Therapy Industry Revenue (Million) Forecast, by Application 2019 & 2032
- Table 84: GCC Induced Pluripotent Stem Cell Therapy Industry Volume (K unit) Forecast, by Application 2019 & 2032
- Table 85: South Africa Induced Pluripotent Stem Cell Therapy Industry Revenue (Million) Forecast, by Application 2019 & 2032
- Table 86: South Africa Induced Pluripotent Stem Cell Therapy Industry Volume (K unit) Forecast, by Application 2019 & 2032
- Table 87: Rest of Middle East and Africa Induced Pluripotent Stem Cell Therapy Industry Revenue (Million) Forecast, by Application 2019 & 2032
- Table 88: Rest of Middle East and Africa Induced Pluripotent Stem Cell Therapy Industry Volume (K unit) Forecast, by Application 2019 & 2032
- Table 89: Global Induced Pluripotent Stem Cell Therapy Industry Revenue Million Forecast, by Derived Cell Type 2019 & 2032
- Table 90: Global Induced Pluripotent Stem Cell Therapy Industry Volume K unit Forecast, by Derived Cell Type 2019 & 2032
- Table 91: Global Induced Pluripotent Stem Cell Therapy Industry Revenue Million Forecast, by Application 2019 & 2032
- Table 92: Global Induced Pluripotent Stem Cell Therapy Industry Volume K unit Forecast, by Application 2019 & 2032
- Table 93: Global Induced Pluripotent Stem Cell Therapy Industry Revenue Million Forecast, by End User 2019 & 2032
- Table 94: Global Induced Pluripotent Stem Cell Therapy Industry Volume K unit Forecast, by End User 2019 & 2032
- Table 95: Global Induced Pluripotent Stem Cell Therapy Industry Revenue Million Forecast, by Country 2019 & 2032
- Table 96: Global Induced Pluripotent Stem Cell Therapy Industry Volume K unit Forecast, by Country 2019 & 2032
- Table 97: Brazil Induced Pluripotent Stem Cell Therapy Industry Revenue (Million) Forecast, by Application 2019 & 2032
- Table 98: Brazil Induced Pluripotent Stem Cell Therapy Industry Volume (K unit) Forecast, by Application 2019 & 2032
- Table 99: Argentina Induced Pluripotent Stem Cell Therapy Industry Revenue (Million) Forecast, by Application 2019 & 2032
- Table 100: Argentina Induced Pluripotent Stem Cell Therapy Industry Volume (K unit) Forecast, by Application 2019 & 2032
- Table 101: Rest of South America Induced Pluripotent Stem Cell Therapy Industry Revenue (Million) Forecast, by Application 2019 & 2032
- Table 102: Rest of South America Induced Pluripotent Stem Cell Therapy Industry Volume (K unit) Forecast, by Application 2019 & 2032
Frequently Asked Questions
1. What is the projected Compound Annual Growth Rate (CAGR) of the Induced Pluripotent Stem Cell Therapy Industry?
The projected CAGR is approximately 10.10%.
2. Which companies are prominent players in the Induced Pluripotent Stem Cell Therapy Industry?
Key companies in the market include Cynata Therapeutics Limited, FUJIFILM Cellular Dynamics Inc, Axol Bioscience Ltd, Thermo Fisher Scientific Inc, Takara Bio Inc, REPROCELL USA Inc, LizarBio Therapeutics (Pluricell Biotech), Fate Therapeutics Inc, Sumitomo Dainippon Pharma Co Ltd, Ncardia, ViaCyte Inc , Evotec SE.
3. What are the main segments of the Induced Pluripotent Stem Cell Therapy Industry?
The market segments include Derived Cell Type, Application, End User.
4. Can you provide details about the market size?
The market size is estimated to be USD 1.35 Million as of 2022.
5. What are some drivers contributing to market growth?
Increase in Research and Development Activities in Stem Cells Therapies; Surge in Adoption of Personalized Medicine.
6. What are the notable trends driving market growth?
Regenerative Medicine Segment is Expected to Witness Significant Growth Over the Forecast Period.
7. Are there any restraints impacting market growth?
Lack of Awareness Regarding Stem Cell Therapies and High Cost of Treatment.
8. Can you provide examples of recent developments in the market?
In November 2022, Prepaire Labs signed a 5-year agreement with Ncardia to accelerate drug discovery and development including target discovery, lead optimization, toxicity assessment, and trial design. The new initiative assists in the development of iPSCs by reprogramming adult cells (such as skin and blood cells) into an embryonic stem cell-like state, which can differentiate into any type of human body cell.
9. What pricing options are available for accessing the report?
Pricing options include single-user, multi-user, and enterprise licenses priced at USD 4750, USD 5250, and USD 8750 respectively.
10. Is the market size provided in terms of value or volume?
The market size is provided in terms of value, measured in Million and volume, measured in K unit.
11. Are there any specific market keywords associated with the report?
Yes, the market keyword associated with the report is "Induced Pluripotent Stem Cell Therapy Industry," which aids in identifying and referencing the specific market segment covered.
12. How do I determine which pricing option suits my needs best?
The pricing options vary based on user requirements and access needs. Individual users may opt for single-user licenses, while businesses requiring broader access may choose multi-user or enterprise licenses for cost-effective access to the report.
13. Are there any additional resources or data provided in the Induced Pluripotent Stem Cell Therapy Industry report?
While the report offers comprehensive insights, it's advisable to review the specific contents or supplementary materials provided to ascertain if additional resources or data are available.
14. How can I stay updated on further developments or reports in the Induced Pluripotent Stem Cell Therapy Industry?
To stay informed about further developments, trends, and reports in the Induced Pluripotent Stem Cell Therapy Industry, consider subscribing to industry newsletters, following relevant companies and organizations, or regularly checking reputable industry news sources and publications.
Methodology
Step 1 - Identification of Relevant Samples Size from Population Database


Step 2 - Approaches for Defining Global Market Size (Value, Volume* & Price*)

Note*: In applicable scenarios
Step 3 - Data Sources
Primary Research
- Web Analytics
- Survey Reports
- Research Institute
- Latest Research Reports
- Opinion Leaders
Secondary Research
- Annual Reports
- White Paper
- Latest Press Release
- Industry Association
- Paid Database
- Investor Presentations

Step 4 - Data Triangulation
Involves using different sources of information in order to increase the validity of a study
These sources are likely to be stakeholders in a program - participants, other researchers, program staff, other community members, and so on.
Then we put all data in single framework & apply various statistical tools to find out the dynamic on the market.
During the analysis stage, feedback from the stakeholder groups would be compared to determine areas of agreement as well as areas of divergence


