
Key Insights
The HLA Typing market, valued at approximately $XX million in 2025, is projected to experience robust growth, exhibiting a Compound Annual Growth Rate (CAGR) of 6.30% from 2025 to 2033. This expansion is fueled by several key drivers. The increasing prevalence of autoimmune diseases and organ transplantation procedures necessitates accurate and efficient HLA typing for successful transplantation and disease management. Advancements in technology, particularly in next-generation sequencing (NGS) and high-resolution typing methods, are significantly improving the speed, accuracy, and cost-effectiveness of HLA typing, driving market growth. Furthermore, the growing demand for personalized medicine and pharmacogenomics, which utilize HLA typing to tailor treatment strategies, contributes to market expansion. The rising investments in research and development within the biotechnology and pharmaceutical industries further bolster the market. However, the high cost associated with sophisticated HLA typing technologies and the complexity of interpreting results may pose certain restraints.
Segment-wise, the reagents and consumables segment currently holds the largest market share, driven by the high volume consumption of these products in various HLA typing techniques. The software and services segment is anticipated to show considerable growth due to the increasing adoption of sophisticated data analysis tools and bioinformatics solutions. Geographically, North America currently dominates the market, owing to advanced healthcare infrastructure, high adoption rates of new technologies, and robust research activities. However, the Asia-Pacific region is expected to witness the fastest growth rate during the forecast period, driven by rising healthcare expenditure, growing awareness of HLA typing’s significance, and increasing prevalence of chronic diseases. Major players like Illumina, Thermo Fisher Scientific, and Qiagen are strategically investing in R&D and collaborations to consolidate their market presence and capitalize on emerging opportunities within this dynamic landscape.
HLA Typing Industry: A Comprehensive Market Report (2019-2033)
This comprehensive report provides a detailed analysis of the HLA Typing industry, encompassing market size, growth projections, competitive landscape, and key technological advancements. The study period spans from 2019 to 2033, with 2025 serving as the base and estimated year. The forecast period covers 2025-2033, while the historical period encompasses 2019-2024. The report is invaluable for stakeholders seeking actionable insights into this dynamic sector. The market is estimated to be worth $XX Million in 2025 and projected to reach $XX Million by 2033, exhibiting a CAGR of XX%.
HLA Typing Industry Market Structure & Competitive Dynamics
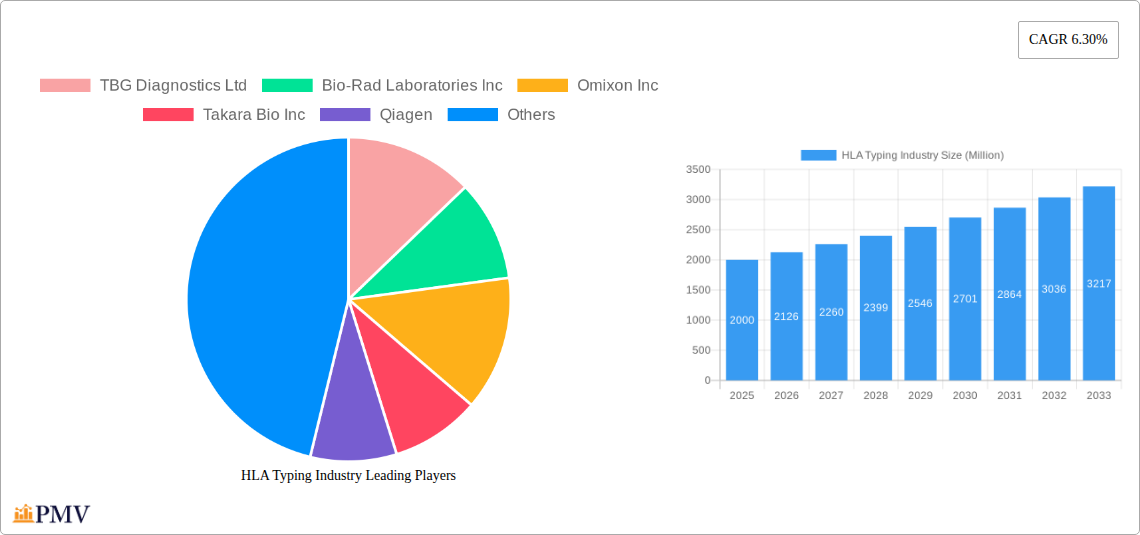
The HLA Typing industry exhibits a moderately concentrated market structure, with several key players commanding significant market share. The leading companies, including TBG Diagnostics Ltd, Bio-Rad Laboratories Inc, Omixon Inc, Takara Bio Inc, Qiagen, Beckton Dickinson and Company, CareDx, Illumina Inc, Thermofisher Scientific Inc, F Hoffman-La Roche Limited, Biofortuna, GenDx, and others, continuously engage in innovation and strategic partnerships to maintain their competitive edge. Market share distribution varies across segments (detailed in later sections) but is generally characterized by a few dominant players and numerous smaller, niche players.
- Market Concentration: The Herfindahl-Hirschman Index (HHI) is estimated at XX, indicating a moderately concentrated market.
- Innovation Ecosystems: Significant investments in R&D drive continuous product improvement, with a focus on next-generation sequencing (NGS) technologies and automated solutions.
- Regulatory Frameworks: Stringent regulatory approvals (e.g., FDA, CE marking) influence market entry and product adoption. These regulations vary across geographical regions, adding complexity.
- Product Substitutes: While limited direct substitutes exist, alternative diagnostic methods and evolving technologies constantly pose competitive threats.
- End-User Trends: The increasing prevalence of autoimmune diseases and organ transplantation fuels demand for HLA typing services. Growing adoption of personalized medicine further drives market growth.
- M&A Activities: The industry has witnessed several mergers and acquisitions in recent years, with deal values averaging $XX Million. These activities aim to expand product portfolios, enhance technological capabilities, and increase market reach. Examples include [mention specific M&A examples if data is available, otherwise omit this point].
HLA Typing Industry Industry Trends & Insights
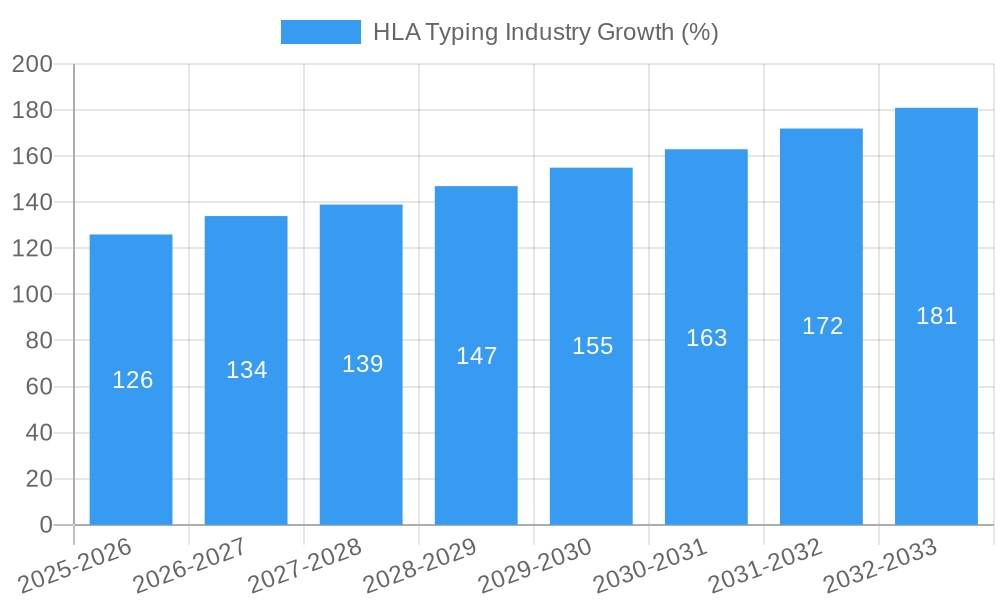
The HLA Typing industry is experiencing robust growth, driven by several key factors. The increasing prevalence of autoimmune diseases like Ankylosing Spondylitis, rising demand for organ transplantation, and advancements in NGS technology are major catalysts. Technological disruptions, particularly the introduction of high-throughput sequencing platforms and automated systems, have significantly improved the efficiency and accuracy of HLA typing. The market is also influenced by evolving consumer preferences toward faster, more accurate, and cost-effective diagnostic solutions. The competitive landscape remains dynamic, with ongoing innovation and strategic collaborations shaping market dynamics. The market's CAGR during the forecast period (2025-2033) is estimated at XX%, signifying substantial growth potential. Market penetration in developed countries is relatively high, while emerging markets present significant growth opportunities. Factors influencing market growth include increasing healthcare expenditure, rising awareness of HLA typing's importance, and the expanding adoption of personalized medicine strategies in various healthcare settings. Specific technologies driving market growth include high-throughput NGS, real-time PCR, and microarray-based techniques. The increasing availability of advanced software and data analytics platforms contribute to improved data management and interpretation, further boosting market growth. The emergence of point-of-care testing (POCT) solutions is another trend expected to influence the market in the years to come.
Dominant Markets & Segments in HLA Typing Industry
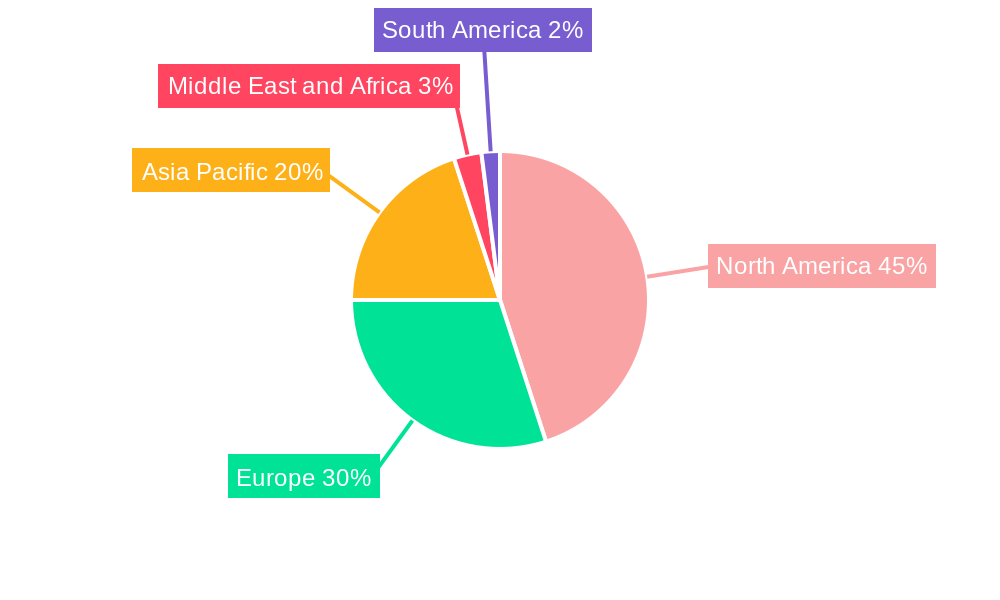
The HLA Typing market is geographically diverse, with significant presence in North America, Europe, and Asia-Pacific. However, North America currently holds the largest market share due to higher healthcare expenditure, advanced infrastructure, and increased adoption of advanced technologies. Within the segments:
- By Product and Service: Reagents and consumables constitute the largest segment, driven by high demand for testing kits and related materials. Instruments represent a significant market segment, with a growing demand for sophisticated and automated platforms. Software and services are also significant, driven by the need for data analysis and interpretation tools.
- By Application: The diagnostic application segment dominates the market owing to the crucial role of HLA typing in disease diagnosis and treatment. The research segment is also substantial, given the increasing use of HLA typing in scientific studies and drug development.
- By End User: Hospitals and research laboratories represent the largest end-user segments, collectively accounting for over XX% of the market. Other end-users, such as blood banks and pharmaceutical companies, also contribute significantly to overall market growth.
Key Drivers for Dominance:
- North America: High healthcare expenditure, well-established healthcare infrastructure, increased prevalence of autoimmune diseases, and strong regulatory support.
- Reagents and Consumables: High volume usage, relative cost-effectiveness compared to instruments, and continuous demand for consumables.
- Diagnostic Applications: Essential role in disease diagnosis and treatment, strong clinical need, and widespread adoption.
- Hospitals and Research Laboratories: High testing volumes, advanced technology adoption, and dedicated budgetary allocations.
HLA Typing Industry Product Innovations
Recent advancements in HLA typing have focused on developing faster, more accurate, and cost-effective technologies. Next-generation sequencing (NGS) is revolutionizing HLA typing, enabling high-resolution typing and facilitating the detection of rare alleles. Microarray-based technologies offer a cost-effective and high-throughput solution for large-scale HLA typing. Software advancements provide improved data analysis and interpretation capabilities, while automated systems enhance efficiency and reduce manual error. These innovations are enhancing diagnostic capabilities and improving the overall workflow in clinical and research settings. The market is also witnessing the emergence of point-of-care testing (POCT) devices, promising faster results and improved accessibility.
Report Segmentation & Scope
This report segments the HLA Typing industry across various parameters:
By Product and Service: Instruments (growth projection: XX%, market size in 2025: $XX Million); Reagents and Consumables (growth projection: XX%, market size in 2025: $XX Million); Software and Services (growth projection: XX%, market size in 2025: $XX Million). Competitive dynamics vary significantly across these segments, with different players dominating each area.
By Application: Diagnosis (growth projection: XX%, market size in 2025: $XX Million); Research (growth projection: XX%, market size in 2025: $XX Million). The diagnostic segment is characterized by stringent regulatory requirements, while the research segment exhibits higher flexibility and innovation.
By End User: Hospitals (growth projection: XX%, market size in 2025: $XX Million); Research Laboratories (growth projection: XX%, market size in 2025: $XX Million); Other End Users (growth projection: XX%, market size in 2025: $XX Million). Hospitals focus on rapid turnaround times and accuracy, while research laboratories prioritize high throughput and comprehensive data.
Key Drivers of HLA Typing Industry Growth
Several factors contribute to the growth of the HLA Typing industry:
- Technological Advancements: The development of NGS and other high-throughput technologies is enhancing speed, accuracy, and cost-effectiveness.
- Increased Prevalence of Diseases: The rising incidence of autoimmune diseases and organ transplantation fuels demand for HLA typing.
- Government Initiatives: Government funding for research and development in personalized medicine supports the growth of the market.
Challenges in the HLA Typing Industry Sector
The HLA Typing industry faces several challenges:
- Regulatory Hurdles: Strict regulatory requirements for diagnostic products can hinder market entry and product approval processes.
- High Costs: The high cost of equipment and reagents can limit accessibility, particularly in resource-constrained settings.
- Competitive Pressure: Intense competition among existing players and the emergence of new technologies pose challenges for market dominance.
Leading Players in the HLA Typing Industry Market
- TBG Diagnostics Ltd
- Bio-Rad Laboratories Inc
- Omixon Inc
- Takara Bio Inc
- Qiagen
- Beckton Dickinson and Company
- CareDx
- Illumina Inc
- Thermofisher Scientific Inc
- F Hoffman-La Roche Limited
- Biofortuna
- GenDx
Key Developments in HLA Typing Industry Sector
- May 2022: Mylab Discovery Solutions launched DiscoverSeries HLAB*27 detection kit for Ankylosing Spondylitis (AS). This expands the available diagnostic options for this specific condition.
- April 2022: Genome Diagnostics (GenDx) received Canadian regulatory approval for its NGSgo-MX11-3 human leukocyte antigen genotyping test. This broadens the reach of their NGS-based HLA typing solution.
Strategic HLA Typing Industry Market Outlook
The HLA Typing industry is poised for continued growth, driven by technological advancements, the rising prevalence of autoimmune disorders, and increasing demand for organ transplantation. Strategic opportunities lie in developing innovative products and services tailored to specific needs and geographical regions. Expansion into emerging markets and strategic partnerships offer significant potential for growth and market share expansion. Continuous innovation in NGS, automation, and data analytics will further shape the future of the industry, creating opportunities for players that can adapt and adopt these advancements.
HLA Typing Industry Segmentation
-
1. Product and Service
- 1.1. Instruments
- 1.2. Reagents and Consumables
- 1.3. Softwares and Services
-
2. Application
- 2.1. Diagnosis
- 2.2. Research
-
3. End User
- 3.1. Hospitals
- 3.2. Research Laboratories
- 3.3. Other End Users
HLA Typing Industry Segmentation By Geography
-
1. North America
- 1.1. United States
- 1.2. Canada
- 1.3. Mexico
-
2. Europe
- 2.1. Germany
- 2.2. United Kingdom
- 2.3. France
- 2.4. Italy
- 2.5. Spain
- 2.6. Rest of Europe
-
3. Asia Pacific
- 3.1. China
- 3.2. Japan
- 3.3. India
- 3.4. Australia
- 3.5. South Korea
- 3.6. Rest of Asia Pacific
-
4. Middle East and Africa
- 4.1. GCC
- 4.2. South Africa
- 4.3. Rest of Middle East and Africa
-
5. South America
- 5.1. Brazil
- 5.2. Argentina
- 5.3. Rest of South America
HLA Typing Industry REPORT HIGHLIGHTS
| Aspects | Details |
|---|---|
| Study Period | 2019-2033 |
| Base Year | 2024 |
| Estimated Year | 2025 |
| Forecast Period | 2025-2033 |
| Historical Period | 2019-2024 |
| Growth Rate | CAGR of 6.30% from 2019-2033 |
| Segmentation |
|
Table of Contents
- 1. Introduction
- 1.1. Research Scope
- 1.2. Market Segmentation
- 1.3. Research Methodology
- 1.4. Definitions and Assumptions
- 2. Executive Summary
- 2.1. Introduction
- 3. Market Dynamics
- 3.1. Introduction
- 3.2. Market Drivers
- 3.2.1. Growing Burden of Genetic Diseases; Increasing Number of Organ Transplantation; Rising Government Initiatives Related to Advanced Diagnostics
- 3.3. Market Restrains
- 3.3.1. Small Size of Study Population and Ethical Concern; Stringent Regulatory Framework
- 3.4. Market Trends
- 3.4.1. Hospital Segment is Expected to Exhibhit a Significant Market Growth in the HLA Typing Market
- 4. Market Factor Analysis
- 4.1. Porters Five Forces
- 4.2. Supply/Value Chain
- 4.3. PESTEL analysis
- 4.4. Market Entropy
- 4.5. Patent/Trademark Analysis
- 5. Global HLA Typing Industry Analysis, Insights and Forecast, 2019-2031
- 5.1. Market Analysis, Insights and Forecast - by Product and Service
- 5.1.1. Instruments
- 5.1.2. Reagents and Consumables
- 5.1.3. Softwares and Services
- 5.2. Market Analysis, Insights and Forecast - by Application
- 5.2.1. Diagnosis
- 5.2.2. Research
- 5.3. Market Analysis, Insights and Forecast - by End User
- 5.3.1. Hospitals
- 5.3.2. Research Laboratories
- 5.3.3. Other End Users
- 5.4. Market Analysis, Insights and Forecast - by Region
- 5.4.1. North America
- 5.4.2. Europe
- 5.4.3. Asia Pacific
- 5.4.4. Middle East and Africa
- 5.4.5. South America
- 5.1. Market Analysis, Insights and Forecast - by Product and Service
- 6. North America HLA Typing Industry Analysis, Insights and Forecast, 2019-2031
- 6.1. Market Analysis, Insights and Forecast - by Product and Service
- 6.1.1. Instruments
- 6.1.2. Reagents and Consumables
- 6.1.3. Softwares and Services
- 6.2. Market Analysis, Insights and Forecast - by Application
- 6.2.1. Diagnosis
- 6.2.2. Research
- 6.3. Market Analysis, Insights and Forecast - by End User
- 6.3.1. Hospitals
- 6.3.2. Research Laboratories
- 6.3.3. Other End Users
- 6.1. Market Analysis, Insights and Forecast - by Product and Service
- 7. Europe HLA Typing Industry Analysis, Insights and Forecast, 2019-2031
- 7.1. Market Analysis, Insights and Forecast - by Product and Service
- 7.1.1. Instruments
- 7.1.2. Reagents and Consumables
- 7.1.3. Softwares and Services
- 7.2. Market Analysis, Insights and Forecast - by Application
- 7.2.1. Diagnosis
- 7.2.2. Research
- 7.3. Market Analysis, Insights and Forecast - by End User
- 7.3.1. Hospitals
- 7.3.2. Research Laboratories
- 7.3.3. Other End Users
- 7.1. Market Analysis, Insights and Forecast - by Product and Service
- 8. Asia Pacific HLA Typing Industry Analysis, Insights and Forecast, 2019-2031
- 8.1. Market Analysis, Insights and Forecast - by Product and Service
- 8.1.1. Instruments
- 8.1.2. Reagents and Consumables
- 8.1.3. Softwares and Services
- 8.2. Market Analysis, Insights and Forecast - by Application
- 8.2.1. Diagnosis
- 8.2.2. Research
- 8.3. Market Analysis, Insights and Forecast - by End User
- 8.3.1. Hospitals
- 8.3.2. Research Laboratories
- 8.3.3. Other End Users
- 8.1. Market Analysis, Insights and Forecast - by Product and Service
- 9. Middle East and Africa HLA Typing Industry Analysis, Insights and Forecast, 2019-2031
- 9.1. Market Analysis, Insights and Forecast - by Product and Service
- 9.1.1. Instruments
- 9.1.2. Reagents and Consumables
- 9.1.3. Softwares and Services
- 9.2. Market Analysis, Insights and Forecast - by Application
- 9.2.1. Diagnosis
- 9.2.2. Research
- 9.3. Market Analysis, Insights and Forecast - by End User
- 9.3.1. Hospitals
- 9.3.2. Research Laboratories
- 9.3.3. Other End Users
- 9.1. Market Analysis, Insights and Forecast - by Product and Service
- 10. South America HLA Typing Industry Analysis, Insights and Forecast, 2019-2031
- 10.1. Market Analysis, Insights and Forecast - by Product and Service
- 10.1.1. Instruments
- 10.1.2. Reagents and Consumables
- 10.1.3. Softwares and Services
- 10.2. Market Analysis, Insights and Forecast - by Application
- 10.2.1. Diagnosis
- 10.2.2. Research
- 10.3. Market Analysis, Insights and Forecast - by End User
- 10.3.1. Hospitals
- 10.3.2. Research Laboratories
- 10.3.3. Other End Users
- 10.1. Market Analysis, Insights and Forecast - by Product and Service
- 11. North America HLA Typing Industry Analysis, Insights and Forecast, 2019-2031
- 11.1. Market Analysis, Insights and Forecast - By Country/Sub-region
- 11.1.1 United States
- 11.1.2 Canada
- 11.1.3 Mexico
- 12. Europe HLA Typing Industry Analysis, Insights and Forecast, 2019-2031
- 12.1. Market Analysis, Insights and Forecast - By Country/Sub-region
- 12.1.1 Germany
- 12.1.2 United Kingdom
- 12.1.3 France
- 12.1.4 Italy
- 12.1.5 Spain
- 12.1.6 Rest of Europe
- 13. Asia Pacific HLA Typing Industry Analysis, Insights and Forecast, 2019-2031
- 13.1. Market Analysis, Insights and Forecast - By Country/Sub-region
- 13.1.1 China
- 13.1.2 Japan
- 13.1.3 India
- 13.1.4 Australia
- 13.1.5 South Korea
- 13.1.6 Rest of Asia Pacific
- 14. Middle East and Africa HLA Typing Industry Analysis, Insights and Forecast, 2019-2031
- 14.1. Market Analysis, Insights and Forecast - By Country/Sub-region
- 14.1.1 GCC
- 14.1.2 South Africa
- 14.1.3 Rest of Middle East and Africa
- 15. South America HLA Typing Industry Analysis, Insights and Forecast, 2019-2031
- 15.1. Market Analysis, Insights and Forecast - By Country/Sub-region
- 15.1.1 Brazil
- 15.1.2 Argentina
- 15.1.3 Rest of South America
- 16. Competitive Analysis
- 16.1. Global Market Share Analysis 2024
- 16.2. Company Profiles
- 16.2.1 TBG Diagnostics Ltd
- 16.2.1.1. Overview
- 16.2.1.2. Products
- 16.2.1.3. SWOT Analysis
- 16.2.1.4. Recent Developments
- 16.2.1.5. Financials (Based on Availability)
- 16.2.2 Bio-Rad Laboratories Inc
- 16.2.2.1. Overview
- 16.2.2.2. Products
- 16.2.2.3. SWOT Analysis
- 16.2.2.4. Recent Developments
- 16.2.2.5. Financials (Based on Availability)
- 16.2.3 Omixon Inc
- 16.2.3.1. Overview
- 16.2.3.2. Products
- 16.2.3.3. SWOT Analysis
- 16.2.3.4. Recent Developments
- 16.2.3.5. Financials (Based on Availability)
- 16.2.4 Takara Bio Inc
- 16.2.4.1. Overview
- 16.2.4.2. Products
- 16.2.4.3. SWOT Analysis
- 16.2.4.4. Recent Developments
- 16.2.4.5. Financials (Based on Availability)
- 16.2.5 Qiagen
- 16.2.5.1. Overview
- 16.2.5.2. Products
- 16.2.5.3. SWOT Analysis
- 16.2.5.4. Recent Developments
- 16.2.5.5. Financials (Based on Availability)
- 16.2.6 Beckton Dickinson and Company
- 16.2.6.1. Overview
- 16.2.6.2. Products
- 16.2.6.3. SWOT Analysis
- 16.2.6.4. Recent Developments
- 16.2.6.5. Financials (Based on Availability)
- 16.2.7 CareDx
- 16.2.7.1. Overview
- 16.2.7.2. Products
- 16.2.7.3. SWOT Analysis
- 16.2.7.4. Recent Developments
- 16.2.7.5. Financials (Based on Availability)
- 16.2.8 Illumina Inc
- 16.2.8.1. Overview
- 16.2.8.2. Products
- 16.2.8.3. SWOT Analysis
- 16.2.8.4. Recent Developments
- 16.2.8.5. Financials (Based on Availability)
- 16.2.9 Thermofisher Scientific Inc
- 16.2.9.1. Overview
- 16.2.9.2. Products
- 16.2.9.3. SWOT Analysis
- 16.2.9.4. Recent Developments
- 16.2.9.5. Financials (Based on Availability)
- 16.2.10 F Hoffman-La Roche Limited
- 16.2.10.1. Overview
- 16.2.10.2. Products
- 16.2.10.3. SWOT Analysis
- 16.2.10.4. Recent Developments
- 16.2.10.5. Financials (Based on Availability)
- 16.2.11 Biofortuna*List Not Exhaustive
- 16.2.11.1. Overview
- 16.2.11.2. Products
- 16.2.11.3. SWOT Analysis
- 16.2.11.4. Recent Developments
- 16.2.11.5. Financials (Based on Availability)
- 16.2.12 GenDX
- 16.2.12.1. Overview
- 16.2.12.2. Products
- 16.2.12.3. SWOT Analysis
- 16.2.12.4. Recent Developments
- 16.2.12.5. Financials (Based on Availability)
- 16.2.1 TBG Diagnostics Ltd
List of Figures
- Figure 1: Global HLA Typing Industry Revenue Breakdown (Million, %) by Region 2024 & 2032
- Figure 2: North America HLA Typing Industry Revenue (Million), by Country 2024 & 2032
- Figure 3: North America HLA Typing Industry Revenue Share (%), by Country 2024 & 2032
- Figure 4: Europe HLA Typing Industry Revenue (Million), by Country 2024 & 2032
- Figure 5: Europe HLA Typing Industry Revenue Share (%), by Country 2024 & 2032
- Figure 6: Asia Pacific HLA Typing Industry Revenue (Million), by Country 2024 & 2032
- Figure 7: Asia Pacific HLA Typing Industry Revenue Share (%), by Country 2024 & 2032
- Figure 8: Middle East and Africa HLA Typing Industry Revenue (Million), by Country 2024 & 2032
- Figure 9: Middle East and Africa HLA Typing Industry Revenue Share (%), by Country 2024 & 2032
- Figure 10: South America HLA Typing Industry Revenue (Million), by Country 2024 & 2032
- Figure 11: South America HLA Typing Industry Revenue Share (%), by Country 2024 & 2032
- Figure 12: North America HLA Typing Industry Revenue (Million), by Product and Service 2024 & 2032
- Figure 13: North America HLA Typing Industry Revenue Share (%), by Product and Service 2024 & 2032
- Figure 14: North America HLA Typing Industry Revenue (Million), by Application 2024 & 2032
- Figure 15: North America HLA Typing Industry Revenue Share (%), by Application 2024 & 2032
- Figure 16: North America HLA Typing Industry Revenue (Million), by End User 2024 & 2032
- Figure 17: North America HLA Typing Industry Revenue Share (%), by End User 2024 & 2032
- Figure 18: North America HLA Typing Industry Revenue (Million), by Country 2024 & 2032
- Figure 19: North America HLA Typing Industry Revenue Share (%), by Country 2024 & 2032
- Figure 20: Europe HLA Typing Industry Revenue (Million), by Product and Service 2024 & 2032
- Figure 21: Europe HLA Typing Industry Revenue Share (%), by Product and Service 2024 & 2032
- Figure 22: Europe HLA Typing Industry Revenue (Million), by Application 2024 & 2032
- Figure 23: Europe HLA Typing Industry Revenue Share (%), by Application 2024 & 2032
- Figure 24: Europe HLA Typing Industry Revenue (Million), by End User 2024 & 2032
- Figure 25: Europe HLA Typing Industry Revenue Share (%), by End User 2024 & 2032
- Figure 26: Europe HLA Typing Industry Revenue (Million), by Country 2024 & 2032
- Figure 27: Europe HLA Typing Industry Revenue Share (%), by Country 2024 & 2032
- Figure 28: Asia Pacific HLA Typing Industry Revenue (Million), by Product and Service 2024 & 2032
- Figure 29: Asia Pacific HLA Typing Industry Revenue Share (%), by Product and Service 2024 & 2032
- Figure 30: Asia Pacific HLA Typing Industry Revenue (Million), by Application 2024 & 2032
- Figure 31: Asia Pacific HLA Typing Industry Revenue Share (%), by Application 2024 & 2032
- Figure 32: Asia Pacific HLA Typing Industry Revenue (Million), by End User 2024 & 2032
- Figure 33: Asia Pacific HLA Typing Industry Revenue Share (%), by End User 2024 & 2032
- Figure 34: Asia Pacific HLA Typing Industry Revenue (Million), by Country 2024 & 2032
- Figure 35: Asia Pacific HLA Typing Industry Revenue Share (%), by Country 2024 & 2032
- Figure 36: Middle East and Africa HLA Typing Industry Revenue (Million), by Product and Service 2024 & 2032
- Figure 37: Middle East and Africa HLA Typing Industry Revenue Share (%), by Product and Service 2024 & 2032
- Figure 38: Middle East and Africa HLA Typing Industry Revenue (Million), by Application 2024 & 2032
- Figure 39: Middle East and Africa HLA Typing Industry Revenue Share (%), by Application 2024 & 2032
- Figure 40: Middle East and Africa HLA Typing Industry Revenue (Million), by End User 2024 & 2032
- Figure 41: Middle East and Africa HLA Typing Industry Revenue Share (%), by End User 2024 & 2032
- Figure 42: Middle East and Africa HLA Typing Industry Revenue (Million), by Country 2024 & 2032
- Figure 43: Middle East and Africa HLA Typing Industry Revenue Share (%), by Country 2024 & 2032
- Figure 44: South America HLA Typing Industry Revenue (Million), by Product and Service 2024 & 2032
- Figure 45: South America HLA Typing Industry Revenue Share (%), by Product and Service 2024 & 2032
- Figure 46: South America HLA Typing Industry Revenue (Million), by Application 2024 & 2032
- Figure 47: South America HLA Typing Industry Revenue Share (%), by Application 2024 & 2032
- Figure 48: South America HLA Typing Industry Revenue (Million), by End User 2024 & 2032
- Figure 49: South America HLA Typing Industry Revenue Share (%), by End User 2024 & 2032
- Figure 50: South America HLA Typing Industry Revenue (Million), by Country 2024 & 2032
- Figure 51: South America HLA Typing Industry Revenue Share (%), by Country 2024 & 2032
List of Tables
- Table 1: Global HLA Typing Industry Revenue Million Forecast, by Region 2019 & 2032
- Table 2: Global HLA Typing Industry Revenue Million Forecast, by Product and Service 2019 & 2032
- Table 3: Global HLA Typing Industry Revenue Million Forecast, by Application 2019 & 2032
- Table 4: Global HLA Typing Industry Revenue Million Forecast, by End User 2019 & 2032
- Table 5: Global HLA Typing Industry Revenue Million Forecast, by Region 2019 & 2032
- Table 6: Global HLA Typing Industry Revenue Million Forecast, by Country 2019 & 2032
- Table 7: United States HLA Typing Industry Revenue (Million) Forecast, by Application 2019 & 2032
- Table 8: Canada HLA Typing Industry Revenue (Million) Forecast, by Application 2019 & 2032
- Table 9: Mexico HLA Typing Industry Revenue (Million) Forecast, by Application 2019 & 2032
- Table 10: Global HLA Typing Industry Revenue Million Forecast, by Country 2019 & 2032
- Table 11: Germany HLA Typing Industry Revenue (Million) Forecast, by Application 2019 & 2032
- Table 12: United Kingdom HLA Typing Industry Revenue (Million) Forecast, by Application 2019 & 2032
- Table 13: France HLA Typing Industry Revenue (Million) Forecast, by Application 2019 & 2032
- Table 14: Italy HLA Typing Industry Revenue (Million) Forecast, by Application 2019 & 2032
- Table 15: Spain HLA Typing Industry Revenue (Million) Forecast, by Application 2019 & 2032
- Table 16: Rest of Europe HLA Typing Industry Revenue (Million) Forecast, by Application 2019 & 2032
- Table 17: Global HLA Typing Industry Revenue Million Forecast, by Country 2019 & 2032
- Table 18: China HLA Typing Industry Revenue (Million) Forecast, by Application 2019 & 2032
- Table 19: Japan HLA Typing Industry Revenue (Million) Forecast, by Application 2019 & 2032
- Table 20: India HLA Typing Industry Revenue (Million) Forecast, by Application 2019 & 2032
- Table 21: Australia HLA Typing Industry Revenue (Million) Forecast, by Application 2019 & 2032
- Table 22: South Korea HLA Typing Industry Revenue (Million) Forecast, by Application 2019 & 2032
- Table 23: Rest of Asia Pacific HLA Typing Industry Revenue (Million) Forecast, by Application 2019 & 2032
- Table 24: Global HLA Typing Industry Revenue Million Forecast, by Country 2019 & 2032
- Table 25: GCC HLA Typing Industry Revenue (Million) Forecast, by Application 2019 & 2032
- Table 26: South Africa HLA Typing Industry Revenue (Million) Forecast, by Application 2019 & 2032
- Table 27: Rest of Middle East and Africa HLA Typing Industry Revenue (Million) Forecast, by Application 2019 & 2032
- Table 28: Global HLA Typing Industry Revenue Million Forecast, by Country 2019 & 2032
- Table 29: Brazil HLA Typing Industry Revenue (Million) Forecast, by Application 2019 & 2032
- Table 30: Argentina HLA Typing Industry Revenue (Million) Forecast, by Application 2019 & 2032
- Table 31: Rest of South America HLA Typing Industry Revenue (Million) Forecast, by Application 2019 & 2032
- Table 32: Global HLA Typing Industry Revenue Million Forecast, by Product and Service 2019 & 2032
- Table 33: Global HLA Typing Industry Revenue Million Forecast, by Application 2019 & 2032
- Table 34: Global HLA Typing Industry Revenue Million Forecast, by End User 2019 & 2032
- Table 35: Global HLA Typing Industry Revenue Million Forecast, by Country 2019 & 2032
- Table 36: United States HLA Typing Industry Revenue (Million) Forecast, by Application 2019 & 2032
- Table 37: Canada HLA Typing Industry Revenue (Million) Forecast, by Application 2019 & 2032
- Table 38: Mexico HLA Typing Industry Revenue (Million) Forecast, by Application 2019 & 2032
- Table 39: Global HLA Typing Industry Revenue Million Forecast, by Product and Service 2019 & 2032
- Table 40: Global HLA Typing Industry Revenue Million Forecast, by Application 2019 & 2032
- Table 41: Global HLA Typing Industry Revenue Million Forecast, by End User 2019 & 2032
- Table 42: Global HLA Typing Industry Revenue Million Forecast, by Country 2019 & 2032
- Table 43: Germany HLA Typing Industry Revenue (Million) Forecast, by Application 2019 & 2032
- Table 44: United Kingdom HLA Typing Industry Revenue (Million) Forecast, by Application 2019 & 2032
- Table 45: France HLA Typing Industry Revenue (Million) Forecast, by Application 2019 & 2032
- Table 46: Italy HLA Typing Industry Revenue (Million) Forecast, by Application 2019 & 2032
- Table 47: Spain HLA Typing Industry Revenue (Million) Forecast, by Application 2019 & 2032
- Table 48: Rest of Europe HLA Typing Industry Revenue (Million) Forecast, by Application 2019 & 2032
- Table 49: Global HLA Typing Industry Revenue Million Forecast, by Product and Service 2019 & 2032
- Table 50: Global HLA Typing Industry Revenue Million Forecast, by Application 2019 & 2032
- Table 51: Global HLA Typing Industry Revenue Million Forecast, by End User 2019 & 2032
- Table 52: Global HLA Typing Industry Revenue Million Forecast, by Country 2019 & 2032
- Table 53: China HLA Typing Industry Revenue (Million) Forecast, by Application 2019 & 2032
- Table 54: Japan HLA Typing Industry Revenue (Million) Forecast, by Application 2019 & 2032
- Table 55: India HLA Typing Industry Revenue (Million) Forecast, by Application 2019 & 2032
- Table 56: Australia HLA Typing Industry Revenue (Million) Forecast, by Application 2019 & 2032
- Table 57: South Korea HLA Typing Industry Revenue (Million) Forecast, by Application 2019 & 2032
- Table 58: Rest of Asia Pacific HLA Typing Industry Revenue (Million) Forecast, by Application 2019 & 2032
- Table 59: Global HLA Typing Industry Revenue Million Forecast, by Product and Service 2019 & 2032
- Table 60: Global HLA Typing Industry Revenue Million Forecast, by Application 2019 & 2032
- Table 61: Global HLA Typing Industry Revenue Million Forecast, by End User 2019 & 2032
- Table 62: Global HLA Typing Industry Revenue Million Forecast, by Country 2019 & 2032
- Table 63: GCC HLA Typing Industry Revenue (Million) Forecast, by Application 2019 & 2032
- Table 64: South Africa HLA Typing Industry Revenue (Million) Forecast, by Application 2019 & 2032
- Table 65: Rest of Middle East and Africa HLA Typing Industry Revenue (Million) Forecast, by Application 2019 & 2032
- Table 66: Global HLA Typing Industry Revenue Million Forecast, by Product and Service 2019 & 2032
- Table 67: Global HLA Typing Industry Revenue Million Forecast, by Application 2019 & 2032
- Table 68: Global HLA Typing Industry Revenue Million Forecast, by End User 2019 & 2032
- Table 69: Global HLA Typing Industry Revenue Million Forecast, by Country 2019 & 2032
- Table 70: Brazil HLA Typing Industry Revenue (Million) Forecast, by Application 2019 & 2032
- Table 71: Argentina HLA Typing Industry Revenue (Million) Forecast, by Application 2019 & 2032
- Table 72: Rest of South America HLA Typing Industry Revenue (Million) Forecast, by Application 2019 & 2032
Frequently Asked Questions
1. What is the projected Compound Annual Growth Rate (CAGR) of the HLA Typing Industry?
The projected CAGR is approximately 6.30%.
2. Which companies are prominent players in the HLA Typing Industry?
Key companies in the market include TBG Diagnostics Ltd, Bio-Rad Laboratories Inc, Omixon Inc, Takara Bio Inc, Qiagen, Beckton Dickinson and Company, CareDx, Illumina Inc, Thermofisher Scientific Inc, F Hoffman-La Roche Limited, Biofortuna*List Not Exhaustive, GenDX.
3. What are the main segments of the HLA Typing Industry?
The market segments include Product and Service, Application, End User.
4. Can you provide details about the market size?
The market size is estimated to be USD XX Million as of 2022.
5. What are some drivers contributing to market growth?
Growing Burden of Genetic Diseases; Increasing Number of Organ Transplantation; Rising Government Initiatives Related to Advanced Diagnostics.
6. What are the notable trends driving market growth?
Hospital Segment is Expected to Exhibhit a Significant Market Growth in the HLA Typing Market.
7. Are there any restraints impacting market growth?
Small Size of Study Population and Ethical Concern; Stringent Regulatory Framework.
8. Can you provide examples of recent developments in the market?
In May 2022, Mylab Discovery Solutions launched DiscoverSeries HLAB*27 detection kit, an in-vitro diagnostic test for Ankylosing Spondylitis (AS).
9. What pricing options are available for accessing the report?
Pricing options include single-user, multi-user, and enterprise licenses priced at USD 4750, USD 5250, and USD 8750 respectively.
10. Is the market size provided in terms of value or volume?
The market size is provided in terms of value, measured in Million.
11. Are there any specific market keywords associated with the report?
Yes, the market keyword associated with the report is "HLA Typing Industry," which aids in identifying and referencing the specific market segment covered.
12. How do I determine which pricing option suits my needs best?
The pricing options vary based on user requirements and access needs. Individual users may opt for single-user licenses, while businesses requiring broader access may choose multi-user or enterprise licenses for cost-effective access to the report.
13. Are there any additional resources or data provided in the HLA Typing Industry report?
While the report offers comprehensive insights, it's advisable to review the specific contents or supplementary materials provided to ascertain if additional resources or data are available.
14. How can I stay updated on further developments or reports in the HLA Typing Industry?
To stay informed about further developments, trends, and reports in the HLA Typing Industry, consider subscribing to industry newsletters, following relevant companies and organizations, or regularly checking reputable industry news sources and publications.
Methodology
Step 1 - Identification of Relevant Samples Size from Population Database


Step 2 - Approaches for Defining Global Market Size (Value, Volume* & Price*)

Note*: In applicable scenarios
Step 3 - Data Sources
Primary Research
- Web Analytics
- Survey Reports
- Research Institute
- Latest Research Reports
- Opinion Leaders
Secondary Research
- Annual Reports
- White Paper
- Latest Press Release
- Industry Association
- Paid Database
- Investor Presentations

Step 4 - Data Triangulation
Involves using different sources of information in order to increase the validity of a study
These sources are likely to be stakeholders in a program - participants, other researchers, program staff, other community members, and so on.
Then we put all data in single framework & apply various statistical tools to find out the dynamic on the market.
During the analysis stage, feedback from the stakeholder groups would be compared to determine areas of agreement as well as areas of divergence


