
Key Insights
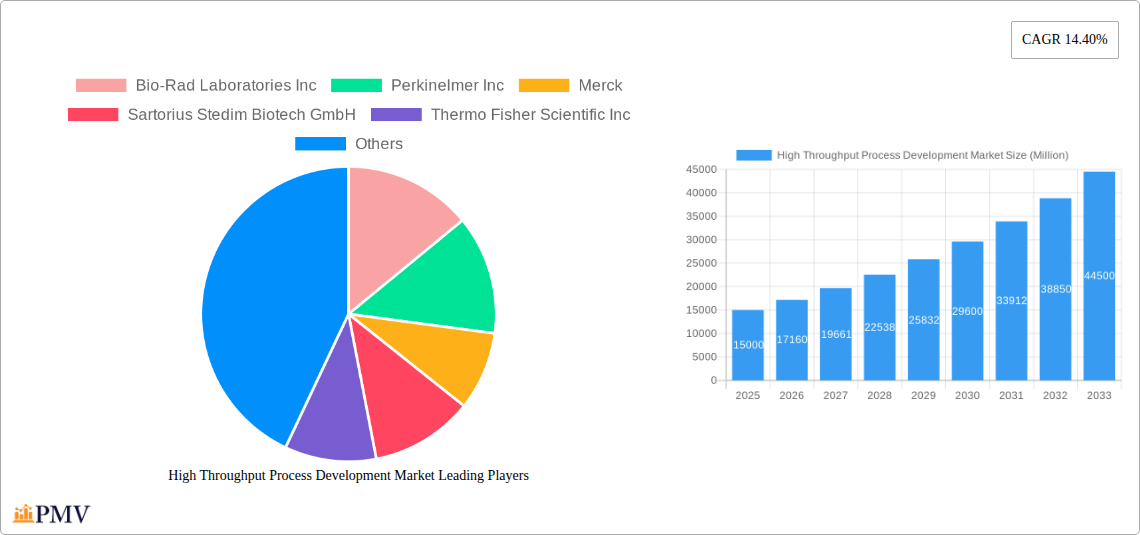
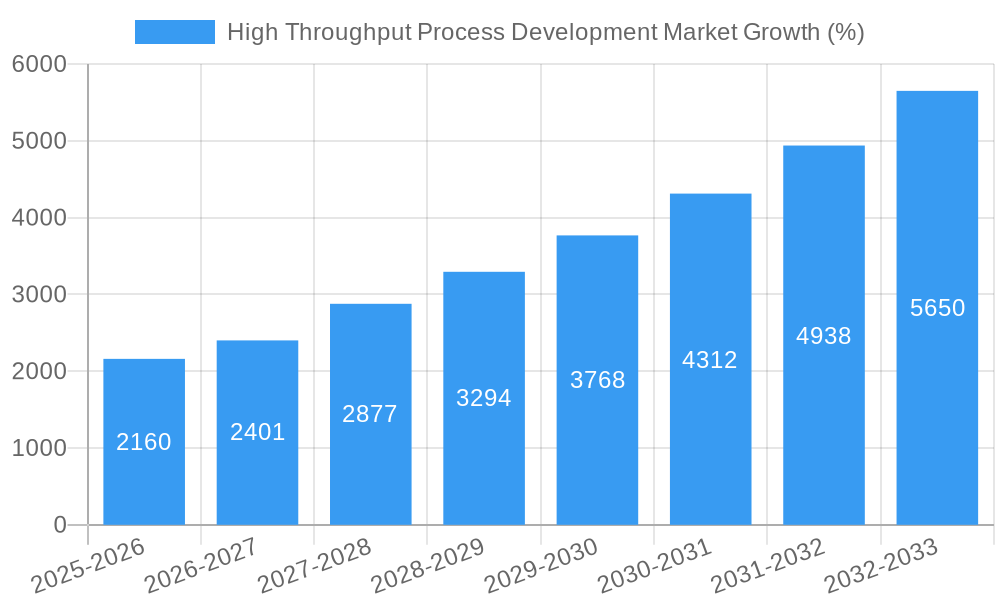
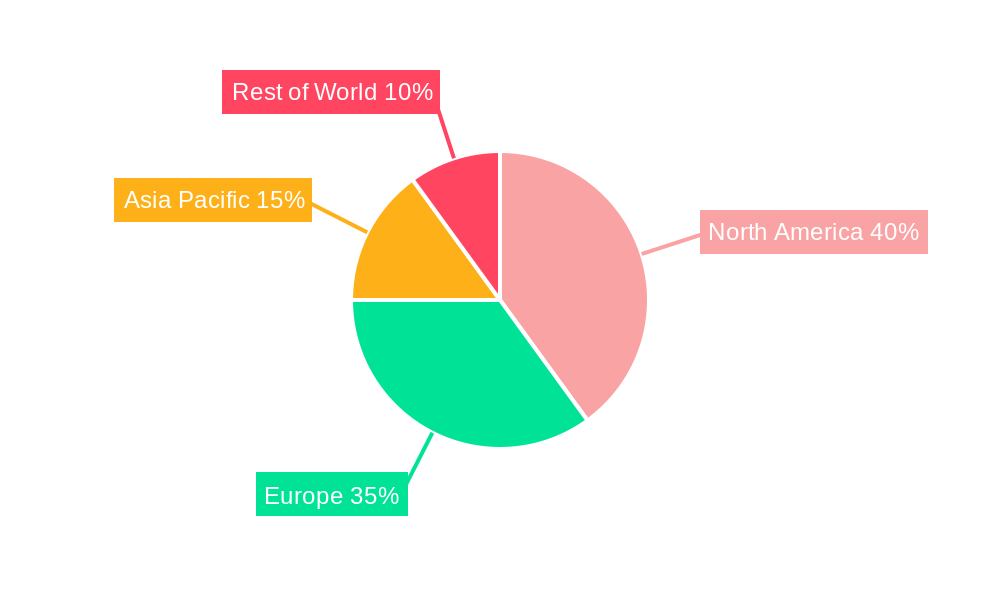
The High Throughput Process Development (HTPD) market is experiencing robust growth, driven by the increasing demand for faster and more efficient drug discovery and development processes within the biopharmaceutical and biotechnology sectors. The market's Compound Annual Growth Rate (CAGR) of 14.40% from 2019 to 2024 suggests a significant expansion, projected to continue throughout the forecast period (2025-2033). This growth is fueled by several key factors, including the rising prevalence of chronic diseases necessitating innovative therapies, the increasing adoption of automation and advanced analytics in drug development, and the growing need for personalized medicine. Technological advancements, particularly in chromatography, UV-Vis spectroscopy, and other emerging technologies, are also contributing significantly to market expansion. The biopharmaceutical and biotechnology companies segment is the largest end-user, followed by contract research organizations (CROs), reflecting the industry's reliance on efficient process development for streamlining research and development activities. Geographic distribution shows a strong presence in North America and Europe, with Asia Pacific emerging as a rapidly growing market due to increasing investments in research infrastructure and expanding pharmaceutical industries in countries like China and India. Competition is intense, with established players like Bio-Rad Laboratories, PerkinElmer, Merck, and Thermo Fisher Scientific dominating the market, along with other significant contributors like Sartorius Stedim Biotech, Tecan Group, Eppendorf, Danaher, Agilent Technologies, and GE Healthcare.
Despite the promising growth outlook, the HTPD market faces certain challenges. High initial investment costs associated with advanced technologies and skilled personnel are barriers to entry for smaller companies. Regulatory hurdles and stringent guidelines for drug approval also impact market growth. However, the long-term prospects for the HTPD market remain positive, driven by continuous innovation in technology and the unrelenting demand for faster and more cost-effective drug development processes. The market's segmentation by product type (consumables, instruments, services, software) and technology offers diverse opportunities for market participants. Furthermore, the increasing collaborations between pharmaceutical companies, CROs, and technology providers are expected to accelerate the adoption of HTPD technologies and further drive market expansion in the coming years. The significant market size and consistent growth trajectory make HTPD a highly attractive sector for investment and future development.
High Throughput Process Development Market: A Comprehensive Report (2019-2033)
This detailed report provides a comprehensive analysis of the High Throughput Process Development market, encompassing market size, segmentation, competitive landscape, growth drivers, and future outlook. The study period covers 2019-2033, with 2025 as the base and estimated year, and a forecast period of 2025-2033. The report is essential for businesses, investors, and researchers seeking actionable insights into this dynamic market.
High Throughput Process Development Market Market Structure & Competitive Dynamics
The High Throughput Process Development market exhibits a moderately concentrated structure, with several key players holding significant market share. The market is characterized by a robust innovation ecosystem, driven by continuous advancements in technologies like chromatography and spectroscopy. Stringent regulatory frameworks, particularly in the biopharmaceutical sector, influence market dynamics. Product substitutes, although limited, exist within specific application niches. End-user trends, particularly towards automation and increased efficiency, are shaping market demand. Mergers and acquisitions (M&A) activity has been significant, with deal values reaching xx Million in the past five years, primarily driven by consolidation among leading players to expand market share and technological capabilities. Key players like Thermo Fisher Scientific, Danaher Corporation, and Merck are driving this consolidation. The market share distribution is as follows (2024 estimates):
- Thermo Fisher Scientific: xx%
- Danaher Corporation: xx%
- Merck: xx%
- Others: xx%
High Throughput Process Development Market Industry Trends & Insights
The High Throughput Process Development market is experiencing robust growth, driven primarily by the increasing demand for faster and more efficient drug discovery and development processes. The rising prevalence of chronic diseases globally fuels this demand, coupled with the growing adoption of advanced technologies like artificial intelligence (AI) and machine learning (ML) to optimize drug development workflows. Technological advancements, particularly in automation and miniaturization, are enhancing throughput and reducing costs. Consumer preference for personalized medicine and targeted therapies further fuels market growth. Competitive dynamics are shaped by continuous innovation, strategic alliances, and the integration of cutting-edge technologies. The market is expected to register a CAGR of xx% during the forecast period (2025-2033), with market penetration steadily increasing across various end-user segments. This growth is further influenced by factors like government funding for research and development initiatives, and the increasing investments from both private and public sectors to accelerate the drug discovery and development process.
Dominant Markets & Segments in High Throughput Process Development Market
The North American region currently dominates the High Throughput Process Development market, driven by factors like robust R&D investments, a large biopharmaceutical industry presence, and advanced technological infrastructure.
- By Product and Services Type: The Instruments segment holds the largest market share, followed by Consumables and Services. Growth is primarily driven by the increasing demand for sophisticated instrumentation capable of high-throughput analysis and automation.
- By Technology: Chromatography currently dominates the technology segment due to its established efficacy and wide-ranging applicability. However, UV-Vis Spectroscopy is also experiencing significant growth, spurred by its ease of use and cost-effectiveness.
- By End-user: Biopharmaceutical and Biotechnology Companies represent the largest end-user segment, accounting for xx% of the market, followed by Contract Research Organizations (CROs). This dominance is driven by their continuous need for high-throughput technologies to streamline their processes and accelerate product development cycles. Key drivers for dominance include:
- Strong government support for pharmaceutical research.
- High investments by Biopharmaceutical and Biotechnology Companies in R&D.
- Availability of skilled workforce and technological infrastructure.
High Throughput Process Development Market Product Innovations
Recent innovations in High Throughput Process Development focus on miniaturization, automation, and integration of advanced analytical techniques. This includes the development of microfluidic devices, automated liquid handling systems, and sophisticated software for data analysis and process optimization. These advancements contribute to improved efficiency, reduced costs, and faster drug development timelines, making them highly attractive to market players. The focus is on creating systems that are more user-friendly, require less hands-on expertise, and are readily integrable with existing workflows.
Report Segmentation & Scope
This report segments the High Throughput Process Development market across three key categories:
- By Product and Services Type: Consumables, Instruments, Services, and Software. Each segment exhibits varying growth trajectories and competitive dynamics. Instruments are predicted to grow at xx% CAGR, while software is projected at xx%.
- By Technology: Chromatography, Ultraviolet-visible Spectroscopy, and Other Technologies. The dominance of chromatography is expected to continue, however other technologies, notably automation driven solutions, will see strong growth in the coming years.
- By End-user: Biopharmaceutical and Biotechnology Companies, Contract Research Organizations (CROs), and Other End-users. The Biopharmaceutical and Biotechnology segment commands a substantial share, while the CRO segment is anticipated to show accelerated growth.
Key Drivers of High Throughput Process Development Market Growth
The High Throughput Process Development market is fueled by several key factors: the increasing demand for faster drug discovery and development, the rising prevalence of chronic diseases, significant investments in R&D by pharmaceutical and biotechnology companies, and technological advancements such as automation and AI-driven analytics. Government initiatives promoting pharmaceutical innovation further contribute to market growth. Stringent regulations demanding greater efficiency and reduced time-to-market also drive adoption of high-throughput technologies.
Challenges in the High Throughput Process Development Market Sector
The High Throughput Process Development market faces challenges including high upfront investment costs for advanced technologies, the complexity of integrating new systems into existing workflows, and the need for highly skilled personnel to operate and maintain sophisticated equipment. Regulatory hurdles and supply chain disruptions also pose significant challenges, potentially leading to delays and increased costs. The competitive landscape, with a number of established players, adds to market challenges. This results in a xx% reduction in market growth projections.
Leading Players in the High Throughput Process Development Market Market
- Bio-Rad Laboratories Inc
- Perkinelmer Inc
- Merck
- Sartorius Stedim Biotech GmbH
- Thermo Fisher Scientific Inc
- Tecan Group AG
- Eppendorf SE
- Danaher Corporation
- Agilent Technologies Inc
- General Electric Company (GE Healthcare)
Key Developments in High Throughput Process Development Market Sector
- October 2022: Ginkgo Bioworks collaborated with Merck to leverage Ginkgo's expertise in high-throughput screening and process development for biocatalyst optimization. This significantly impacted the market by boosting the use of automated high-throughput systems for biocatalysis.
- September 2022: Fujifilm Diosynth Biotechnologies expanded its high-throughput process development facility in Billingham, UK, increasing the large-scale microbial manufacturing capacity and strengthening its position in the market.
Strategic High Throughput Process Development Market Market Outlook
The High Throughput Process Development market exhibits significant growth potential, driven by ongoing technological advancements, increasing R&D investments, and the growing demand for efficient drug development. Strategic opportunities exist in developing innovative technologies, expanding into emerging markets, and establishing strategic partnerships to broaden market reach and enhance technological capabilities. The focus on personalized medicine and advanced therapies will further accelerate market growth in the coming years. Companies that can effectively integrate AI and ML into their high-throughput processes will gain a competitive edge and drive future market development.
High Throughput Process Development Market Segmentation
-
1. Product and Services Type
- 1.1. Consumables
- 1.2. Instruments
- 1.3. Software
-
2. Technology
- 2.1. Chromatography
- 2.2. Ultraviolet-visible Spectroscopy
- 2.3. Other Technologies
-
3. End-user
- 3.1. Biopharmaceutical and Biotechnology Companies
- 3.2. Contract Research Organizations
- 3.3. Other End-users
High Throughput Process Development Market Segmentation By Geography
-
1. North America
- 1.1. United States
- 1.2. Canada
- 1.3. Mexico
-
2. Europe
- 2.1. Germany
- 2.2. United Kingdom
- 2.3. France
- 2.4. Italy
- 2.5. Spain
- 2.6. Rest of Europe
-
3. Asia Pacific
- 3.1. China
- 3.2. Japan
- 3.3. India
- 3.4. Australia
- 3.5. South Korea
- 3.6. Rest of Asia Pacific
-
4. Middle East and Africa
- 4.1. GCC
- 4.2. South Africa
- 4.3. Rest of Middle East and Africa
-
5. South America
- 5.1. Brazil
- 5.2. Argentina
- 5.3. Rest of South America
High Throughput Process Development Market REPORT HIGHLIGHTS
| Aspects | Details |
|---|---|
| Study Period | 2019-2033 |
| Base Year | 2024 |
| Estimated Year | 2025 |
| Forecast Period | 2025-2033 |
| Historical Period | 2019-2024 |
| Growth Rate | CAGR of 14.40% from 2019-2033 |
| Segmentation |
|
Table of Contents
- 1. Introduction
- 1.1. Research Scope
- 1.2. Market Segmentation
- 1.3. Research Methodology
- 1.4. Definitions and Assumptions
- 2. Executive Summary
- 2.1. Introduction
- 3. Market Dynamics
- 3.1. Introduction
- 3.2. Market Drivers
- 3.2.1. Surge in Research and Development Activities for Newer Drug Targets; Growth in Pressure to Lower the Manufacturing Costs in Biopharmaceutical and Biotechnology Companies
- 3.3. Market Restrains
- 3.3.1. High Cost of Advanced Technologies and Lack of Adequate Infrastructure
- 3.4. Market Trends
- 3.4.1. Biopharmaceutical & Biotechnology Companies Segment Expected to Witness Significant Growth
- 4. Market Factor Analysis
- 4.1. Porters Five Forces
- 4.2. Supply/Value Chain
- 4.3. PESTEL analysis
- 4.4. Market Entropy
- 4.5. Patent/Trademark Analysis
- 5. Global High Throughput Process Development Market Analysis, Insights and Forecast, 2019-2031
- 5.1. Market Analysis, Insights and Forecast - by Product and Services Type
- 5.1.1. Consumables
- 5.1.2. Instruments
- 5.1.3. Software
- 5.2. Market Analysis, Insights and Forecast - by Technology
- 5.2.1. Chromatography
- 5.2.2. Ultraviolet-visible Spectroscopy
- 5.2.3. Other Technologies
- 5.3. Market Analysis, Insights and Forecast - by End-user
- 5.3.1. Biopharmaceutical and Biotechnology Companies
- 5.3.2. Contract Research Organizations
- 5.3.3. Other End-users
- 5.4. Market Analysis, Insights and Forecast - by Region
- 5.4.1. North America
- 5.4.2. Europe
- 5.4.3. Asia Pacific
- 5.4.4. Middle East and Africa
- 5.4.5. South America
- 5.1. Market Analysis, Insights and Forecast - by Product and Services Type
- 6. North America High Throughput Process Development Market Analysis, Insights and Forecast, 2019-2031
- 6.1. Market Analysis, Insights and Forecast - by Product and Services Type
- 6.1.1. Consumables
- 6.1.2. Instruments
- 6.1.3. Software
- 6.2. Market Analysis, Insights and Forecast - by Technology
- 6.2.1. Chromatography
- 6.2.2. Ultraviolet-visible Spectroscopy
- 6.2.3. Other Technologies
- 6.3. Market Analysis, Insights and Forecast - by End-user
- 6.3.1. Biopharmaceutical and Biotechnology Companies
- 6.3.2. Contract Research Organizations
- 6.3.3. Other End-users
- 6.1. Market Analysis, Insights and Forecast - by Product and Services Type
- 7. Europe High Throughput Process Development Market Analysis, Insights and Forecast, 2019-2031
- 7.1. Market Analysis, Insights and Forecast - by Product and Services Type
- 7.1.1. Consumables
- 7.1.2. Instruments
- 7.1.3. Software
- 7.2. Market Analysis, Insights and Forecast - by Technology
- 7.2.1. Chromatography
- 7.2.2. Ultraviolet-visible Spectroscopy
- 7.2.3. Other Technologies
- 7.3. Market Analysis, Insights and Forecast - by End-user
- 7.3.1. Biopharmaceutical and Biotechnology Companies
- 7.3.2. Contract Research Organizations
- 7.3.3. Other End-users
- 7.1. Market Analysis, Insights and Forecast - by Product and Services Type
- 8. Asia Pacific High Throughput Process Development Market Analysis, Insights and Forecast, 2019-2031
- 8.1. Market Analysis, Insights and Forecast - by Product and Services Type
- 8.1.1. Consumables
- 8.1.2. Instruments
- 8.1.3. Software
- 8.2. Market Analysis, Insights and Forecast - by Technology
- 8.2.1. Chromatography
- 8.2.2. Ultraviolet-visible Spectroscopy
- 8.2.3. Other Technologies
- 8.3. Market Analysis, Insights and Forecast - by End-user
- 8.3.1. Biopharmaceutical and Biotechnology Companies
- 8.3.2. Contract Research Organizations
- 8.3.3. Other End-users
- 8.1. Market Analysis, Insights and Forecast - by Product and Services Type
- 9. Middle East and Africa High Throughput Process Development Market Analysis, Insights and Forecast, 2019-2031
- 9.1. Market Analysis, Insights and Forecast - by Product and Services Type
- 9.1.1. Consumables
- 9.1.2. Instruments
- 9.1.3. Software
- 9.2. Market Analysis, Insights and Forecast - by Technology
- 9.2.1. Chromatography
- 9.2.2. Ultraviolet-visible Spectroscopy
- 9.2.3. Other Technologies
- 9.3. Market Analysis, Insights and Forecast - by End-user
- 9.3.1. Biopharmaceutical and Biotechnology Companies
- 9.3.2. Contract Research Organizations
- 9.3.3. Other End-users
- 9.1. Market Analysis, Insights and Forecast - by Product and Services Type
- 10. South America High Throughput Process Development Market Analysis, Insights and Forecast, 2019-2031
- 10.1. Market Analysis, Insights and Forecast - by Product and Services Type
- 10.1.1. Consumables
- 10.1.2. Instruments
- 10.1.3. Software
- 10.2. Market Analysis, Insights and Forecast - by Technology
- 10.2.1. Chromatography
- 10.2.2. Ultraviolet-visible Spectroscopy
- 10.2.3. Other Technologies
- 10.3. Market Analysis, Insights and Forecast - by End-user
- 10.3.1. Biopharmaceutical and Biotechnology Companies
- 10.3.2. Contract Research Organizations
- 10.3.3. Other End-users
- 10.1. Market Analysis, Insights and Forecast - by Product and Services Type
- 11. North America High Throughput Process Development Market Analysis, Insights and Forecast, 2019-2031
- 11.1. Market Analysis, Insights and Forecast - By Country/Sub-region
- 11.1.1 United States
- 11.1.2 Canada
- 11.1.3 Mexico
- 12. Europe High Throughput Process Development Market Analysis, Insights and Forecast, 2019-2031
- 12.1. Market Analysis, Insights and Forecast - By Country/Sub-region
- 12.1.1 Germany
- 12.1.2 United Kingdom
- 12.1.3 France
- 12.1.4 Italy
- 12.1.5 Spain
- 12.1.6 Rest of Europe
- 13. Asia Pacific High Throughput Process Development Market Analysis, Insights and Forecast, 2019-2031
- 13.1. Market Analysis, Insights and Forecast - By Country/Sub-region
- 13.1.1 China
- 13.1.2 Japan
- 13.1.3 India
- 13.1.4 Australia
- 13.1.5 South Korea
- 13.1.6 Rest of Asia Pacific
- 14. Middle East and Africa High Throughput Process Development Market Analysis, Insights and Forecast, 2019-2031
- 14.1. Market Analysis, Insights and Forecast - By Country/Sub-region
- 14.1.1 GCC
- 14.1.2 South Africa
- 14.1.3 Rest of Middle East and Africa
- 15. South America High Throughput Process Development Market Analysis, Insights and Forecast, 2019-2031
- 15.1. Market Analysis, Insights and Forecast - By Country/Sub-region
- 15.1.1 Brazil
- 15.1.2 Argentina
- 15.1.3 Rest of South America
- 16. Competitive Analysis
- 16.1. Global Market Share Analysis 2024
- 16.2. Company Profiles
- 16.2.1 Bio-Rad Laboratories Inc
- 16.2.1.1. Overview
- 16.2.1.2. Products
- 16.2.1.3. SWOT Analysis
- 16.2.1.4. Recent Developments
- 16.2.1.5. Financials (Based on Availability)
- 16.2.2 Perkinelmer Inc
- 16.2.2.1. Overview
- 16.2.2.2. Products
- 16.2.2.3. SWOT Analysis
- 16.2.2.4. Recent Developments
- 16.2.2.5. Financials (Based on Availability)
- 16.2.3 Merck
- 16.2.3.1. Overview
- 16.2.3.2. Products
- 16.2.3.3. SWOT Analysis
- 16.2.3.4. Recent Developments
- 16.2.3.5. Financials (Based on Availability)
- 16.2.4 Sartorius Stedim Biotech GmbH
- 16.2.4.1. Overview
- 16.2.4.2. Products
- 16.2.4.3. SWOT Analysis
- 16.2.4.4. Recent Developments
- 16.2.4.5. Financials (Based on Availability)
- 16.2.5 Thermo Fisher Scientific Inc
- 16.2.5.1. Overview
- 16.2.5.2. Products
- 16.2.5.3. SWOT Analysis
- 16.2.5.4. Recent Developments
- 16.2.5.5. Financials (Based on Availability)
- 16.2.6 Tecan Group AG*List Not Exhaustive
- 16.2.6.1. Overview
- 16.2.6.2. Products
- 16.2.6.3. SWOT Analysis
- 16.2.6.4. Recent Developments
- 16.2.6.5. Financials (Based on Availability)
- 16.2.7 Eppendorf SE
- 16.2.7.1. Overview
- 16.2.7.2. Products
- 16.2.7.3. SWOT Analysis
- 16.2.7.4. Recent Developments
- 16.2.7.5. Financials (Based on Availability)
- 16.2.8 Danaher Corporation
- 16.2.8.1. Overview
- 16.2.8.2. Products
- 16.2.8.3. SWOT Analysis
- 16.2.8.4. Recent Developments
- 16.2.8.5. Financials (Based on Availability)
- 16.2.9 Agilent Technologies Inc
- 16.2.9.1. Overview
- 16.2.9.2. Products
- 16.2.9.3. SWOT Analysis
- 16.2.9.4. Recent Developments
- 16.2.9.5. Financials (Based on Availability)
- 16.2.10 General Electric Company (GE Healthcare)
- 16.2.10.1. Overview
- 16.2.10.2. Products
- 16.2.10.3. SWOT Analysis
- 16.2.10.4. Recent Developments
- 16.2.10.5. Financials (Based on Availability)
- 16.2.1 Bio-Rad Laboratories Inc
List of Figures
- Figure 1: Global High Throughput Process Development Market Revenue Breakdown (Million, %) by Region 2024 & 2032
- Figure 2: North America High Throughput Process Development Market Revenue (Million), by Country 2024 & 2032
- Figure 3: North America High Throughput Process Development Market Revenue Share (%), by Country 2024 & 2032
- Figure 4: Europe High Throughput Process Development Market Revenue (Million), by Country 2024 & 2032
- Figure 5: Europe High Throughput Process Development Market Revenue Share (%), by Country 2024 & 2032
- Figure 6: Asia Pacific High Throughput Process Development Market Revenue (Million), by Country 2024 & 2032
- Figure 7: Asia Pacific High Throughput Process Development Market Revenue Share (%), by Country 2024 & 2032
- Figure 8: Middle East and Africa High Throughput Process Development Market Revenue (Million), by Country 2024 & 2032
- Figure 9: Middle East and Africa High Throughput Process Development Market Revenue Share (%), by Country 2024 & 2032
- Figure 10: South America High Throughput Process Development Market Revenue (Million), by Country 2024 & 2032
- Figure 11: South America High Throughput Process Development Market Revenue Share (%), by Country 2024 & 2032
- Figure 12: North America High Throughput Process Development Market Revenue (Million), by Product and Services Type 2024 & 2032
- Figure 13: North America High Throughput Process Development Market Revenue Share (%), by Product and Services Type 2024 & 2032
- Figure 14: North America High Throughput Process Development Market Revenue (Million), by Technology 2024 & 2032
- Figure 15: North America High Throughput Process Development Market Revenue Share (%), by Technology 2024 & 2032
- Figure 16: North America High Throughput Process Development Market Revenue (Million), by End-user 2024 & 2032
- Figure 17: North America High Throughput Process Development Market Revenue Share (%), by End-user 2024 & 2032
- Figure 18: North America High Throughput Process Development Market Revenue (Million), by Country 2024 & 2032
- Figure 19: North America High Throughput Process Development Market Revenue Share (%), by Country 2024 & 2032
- Figure 20: Europe High Throughput Process Development Market Revenue (Million), by Product and Services Type 2024 & 2032
- Figure 21: Europe High Throughput Process Development Market Revenue Share (%), by Product and Services Type 2024 & 2032
- Figure 22: Europe High Throughput Process Development Market Revenue (Million), by Technology 2024 & 2032
- Figure 23: Europe High Throughput Process Development Market Revenue Share (%), by Technology 2024 & 2032
- Figure 24: Europe High Throughput Process Development Market Revenue (Million), by End-user 2024 & 2032
- Figure 25: Europe High Throughput Process Development Market Revenue Share (%), by End-user 2024 & 2032
- Figure 26: Europe High Throughput Process Development Market Revenue (Million), by Country 2024 & 2032
- Figure 27: Europe High Throughput Process Development Market Revenue Share (%), by Country 2024 & 2032
- Figure 28: Asia Pacific High Throughput Process Development Market Revenue (Million), by Product and Services Type 2024 & 2032
- Figure 29: Asia Pacific High Throughput Process Development Market Revenue Share (%), by Product and Services Type 2024 & 2032
- Figure 30: Asia Pacific High Throughput Process Development Market Revenue (Million), by Technology 2024 & 2032
- Figure 31: Asia Pacific High Throughput Process Development Market Revenue Share (%), by Technology 2024 & 2032
- Figure 32: Asia Pacific High Throughput Process Development Market Revenue (Million), by End-user 2024 & 2032
- Figure 33: Asia Pacific High Throughput Process Development Market Revenue Share (%), by End-user 2024 & 2032
- Figure 34: Asia Pacific High Throughput Process Development Market Revenue (Million), by Country 2024 & 2032
- Figure 35: Asia Pacific High Throughput Process Development Market Revenue Share (%), by Country 2024 & 2032
- Figure 36: Middle East and Africa High Throughput Process Development Market Revenue (Million), by Product and Services Type 2024 & 2032
- Figure 37: Middle East and Africa High Throughput Process Development Market Revenue Share (%), by Product and Services Type 2024 & 2032
- Figure 38: Middle East and Africa High Throughput Process Development Market Revenue (Million), by Technology 2024 & 2032
- Figure 39: Middle East and Africa High Throughput Process Development Market Revenue Share (%), by Technology 2024 & 2032
- Figure 40: Middle East and Africa High Throughput Process Development Market Revenue (Million), by End-user 2024 & 2032
- Figure 41: Middle East and Africa High Throughput Process Development Market Revenue Share (%), by End-user 2024 & 2032
- Figure 42: Middle East and Africa High Throughput Process Development Market Revenue (Million), by Country 2024 & 2032
- Figure 43: Middle East and Africa High Throughput Process Development Market Revenue Share (%), by Country 2024 & 2032
- Figure 44: South America High Throughput Process Development Market Revenue (Million), by Product and Services Type 2024 & 2032
- Figure 45: South America High Throughput Process Development Market Revenue Share (%), by Product and Services Type 2024 & 2032
- Figure 46: South America High Throughput Process Development Market Revenue (Million), by Technology 2024 & 2032
- Figure 47: South America High Throughput Process Development Market Revenue Share (%), by Technology 2024 & 2032
- Figure 48: South America High Throughput Process Development Market Revenue (Million), by End-user 2024 & 2032
- Figure 49: South America High Throughput Process Development Market Revenue Share (%), by End-user 2024 & 2032
- Figure 50: South America High Throughput Process Development Market Revenue (Million), by Country 2024 & 2032
- Figure 51: South America High Throughput Process Development Market Revenue Share (%), by Country 2024 & 2032
List of Tables
- Table 1: Global High Throughput Process Development Market Revenue Million Forecast, by Region 2019 & 2032
- Table 2: Global High Throughput Process Development Market Revenue Million Forecast, by Product and Services Type 2019 & 2032
- Table 3: Global High Throughput Process Development Market Revenue Million Forecast, by Technology 2019 & 2032
- Table 4: Global High Throughput Process Development Market Revenue Million Forecast, by End-user 2019 & 2032
- Table 5: Global High Throughput Process Development Market Revenue Million Forecast, by Region 2019 & 2032
- Table 6: Global High Throughput Process Development Market Revenue Million Forecast, by Country 2019 & 2032
- Table 7: United States High Throughput Process Development Market Revenue (Million) Forecast, by Application 2019 & 2032
- Table 8: Canada High Throughput Process Development Market Revenue (Million) Forecast, by Application 2019 & 2032
- Table 9: Mexico High Throughput Process Development Market Revenue (Million) Forecast, by Application 2019 & 2032
- Table 10: Global High Throughput Process Development Market Revenue Million Forecast, by Country 2019 & 2032
- Table 11: Germany High Throughput Process Development Market Revenue (Million) Forecast, by Application 2019 & 2032
- Table 12: United Kingdom High Throughput Process Development Market Revenue (Million) Forecast, by Application 2019 & 2032
- Table 13: France High Throughput Process Development Market Revenue (Million) Forecast, by Application 2019 & 2032
- Table 14: Italy High Throughput Process Development Market Revenue (Million) Forecast, by Application 2019 & 2032
- Table 15: Spain High Throughput Process Development Market Revenue (Million) Forecast, by Application 2019 & 2032
- Table 16: Rest of Europe High Throughput Process Development Market Revenue (Million) Forecast, by Application 2019 & 2032
- Table 17: Global High Throughput Process Development Market Revenue Million Forecast, by Country 2019 & 2032
- Table 18: China High Throughput Process Development Market Revenue (Million) Forecast, by Application 2019 & 2032
- Table 19: Japan High Throughput Process Development Market Revenue (Million) Forecast, by Application 2019 & 2032
- Table 20: India High Throughput Process Development Market Revenue (Million) Forecast, by Application 2019 & 2032
- Table 21: Australia High Throughput Process Development Market Revenue (Million) Forecast, by Application 2019 & 2032
- Table 22: South Korea High Throughput Process Development Market Revenue (Million) Forecast, by Application 2019 & 2032
- Table 23: Rest of Asia Pacific High Throughput Process Development Market Revenue (Million) Forecast, by Application 2019 & 2032
- Table 24: Global High Throughput Process Development Market Revenue Million Forecast, by Country 2019 & 2032
- Table 25: GCC High Throughput Process Development Market Revenue (Million) Forecast, by Application 2019 & 2032
- Table 26: South Africa High Throughput Process Development Market Revenue (Million) Forecast, by Application 2019 & 2032
- Table 27: Rest of Middle East and Africa High Throughput Process Development Market Revenue (Million) Forecast, by Application 2019 & 2032
- Table 28: Global High Throughput Process Development Market Revenue Million Forecast, by Country 2019 & 2032
- Table 29: Brazil High Throughput Process Development Market Revenue (Million) Forecast, by Application 2019 & 2032
- Table 30: Argentina High Throughput Process Development Market Revenue (Million) Forecast, by Application 2019 & 2032
- Table 31: Rest of South America High Throughput Process Development Market Revenue (Million) Forecast, by Application 2019 & 2032
- Table 32: Global High Throughput Process Development Market Revenue Million Forecast, by Product and Services Type 2019 & 2032
- Table 33: Global High Throughput Process Development Market Revenue Million Forecast, by Technology 2019 & 2032
- Table 34: Global High Throughput Process Development Market Revenue Million Forecast, by End-user 2019 & 2032
- Table 35: Global High Throughput Process Development Market Revenue Million Forecast, by Country 2019 & 2032
- Table 36: United States High Throughput Process Development Market Revenue (Million) Forecast, by Application 2019 & 2032
- Table 37: Canada High Throughput Process Development Market Revenue (Million) Forecast, by Application 2019 & 2032
- Table 38: Mexico High Throughput Process Development Market Revenue (Million) Forecast, by Application 2019 & 2032
- Table 39: Global High Throughput Process Development Market Revenue Million Forecast, by Product and Services Type 2019 & 2032
- Table 40: Global High Throughput Process Development Market Revenue Million Forecast, by Technology 2019 & 2032
- Table 41: Global High Throughput Process Development Market Revenue Million Forecast, by End-user 2019 & 2032
- Table 42: Global High Throughput Process Development Market Revenue Million Forecast, by Country 2019 & 2032
- Table 43: Germany High Throughput Process Development Market Revenue (Million) Forecast, by Application 2019 & 2032
- Table 44: United Kingdom High Throughput Process Development Market Revenue (Million) Forecast, by Application 2019 & 2032
- Table 45: France High Throughput Process Development Market Revenue (Million) Forecast, by Application 2019 & 2032
- Table 46: Italy High Throughput Process Development Market Revenue (Million) Forecast, by Application 2019 & 2032
- Table 47: Spain High Throughput Process Development Market Revenue (Million) Forecast, by Application 2019 & 2032
- Table 48: Rest of Europe High Throughput Process Development Market Revenue (Million) Forecast, by Application 2019 & 2032
- Table 49: Global High Throughput Process Development Market Revenue Million Forecast, by Product and Services Type 2019 & 2032
- Table 50: Global High Throughput Process Development Market Revenue Million Forecast, by Technology 2019 & 2032
- Table 51: Global High Throughput Process Development Market Revenue Million Forecast, by End-user 2019 & 2032
- Table 52: Global High Throughput Process Development Market Revenue Million Forecast, by Country 2019 & 2032
- Table 53: China High Throughput Process Development Market Revenue (Million) Forecast, by Application 2019 & 2032
- Table 54: Japan High Throughput Process Development Market Revenue (Million) Forecast, by Application 2019 & 2032
- Table 55: India High Throughput Process Development Market Revenue (Million) Forecast, by Application 2019 & 2032
- Table 56: Australia High Throughput Process Development Market Revenue (Million) Forecast, by Application 2019 & 2032
- Table 57: South Korea High Throughput Process Development Market Revenue (Million) Forecast, by Application 2019 & 2032
- Table 58: Rest of Asia Pacific High Throughput Process Development Market Revenue (Million) Forecast, by Application 2019 & 2032
- Table 59: Global High Throughput Process Development Market Revenue Million Forecast, by Product and Services Type 2019 & 2032
- Table 60: Global High Throughput Process Development Market Revenue Million Forecast, by Technology 2019 & 2032
- Table 61: Global High Throughput Process Development Market Revenue Million Forecast, by End-user 2019 & 2032
- Table 62: Global High Throughput Process Development Market Revenue Million Forecast, by Country 2019 & 2032
- Table 63: GCC High Throughput Process Development Market Revenue (Million) Forecast, by Application 2019 & 2032
- Table 64: South Africa High Throughput Process Development Market Revenue (Million) Forecast, by Application 2019 & 2032
- Table 65: Rest of Middle East and Africa High Throughput Process Development Market Revenue (Million) Forecast, by Application 2019 & 2032
- Table 66: Global High Throughput Process Development Market Revenue Million Forecast, by Product and Services Type 2019 & 2032
- Table 67: Global High Throughput Process Development Market Revenue Million Forecast, by Technology 2019 & 2032
- Table 68: Global High Throughput Process Development Market Revenue Million Forecast, by End-user 2019 & 2032
- Table 69: Global High Throughput Process Development Market Revenue Million Forecast, by Country 2019 & 2032
- Table 70: Brazil High Throughput Process Development Market Revenue (Million) Forecast, by Application 2019 & 2032
- Table 71: Argentina High Throughput Process Development Market Revenue (Million) Forecast, by Application 2019 & 2032
- Table 72: Rest of South America High Throughput Process Development Market Revenue (Million) Forecast, by Application 2019 & 2032
Frequently Asked Questions
1. What is the projected Compound Annual Growth Rate (CAGR) of the High Throughput Process Development Market?
The projected CAGR is approximately 14.40%.
2. Which companies are prominent players in the High Throughput Process Development Market?
Key companies in the market include Bio-Rad Laboratories Inc, Perkinelmer Inc, Merck, Sartorius Stedim Biotech GmbH, Thermo Fisher Scientific Inc, Tecan Group AG*List Not Exhaustive, Eppendorf SE, Danaher Corporation, Agilent Technologies Inc, General Electric Company (GE Healthcare).
3. What are the main segments of the High Throughput Process Development Market?
The market segments include Product and Services Type, Technology, End-user.
4. Can you provide details about the market size?
The market size is estimated to be USD XX Million as of 2022.
5. What are some drivers contributing to market growth?
Surge in Research and Development Activities for Newer Drug Targets; Growth in Pressure to Lower the Manufacturing Costs in Biopharmaceutical and Biotechnology Companies.
6. What are the notable trends driving market growth?
Biopharmaceutical & Biotechnology Companies Segment Expected to Witness Significant Growth.
7. Are there any restraints impacting market growth?
High Cost of Advanced Technologies and Lack of Adequate Infrastructure.
8. Can you provide examples of recent developments in the market?
October 2022: Ginkgo Bioworks collaborated with Merck. This collaboration leveraged Ginkgo's extensive experience in cell engineering and enzyme design and its capabilities in automated high-throughput screening, manufacturing process development/optimization, bioinformatics, and analytics to deliver optimal strains for the expression of targeted biocatalysts.
9. What pricing options are available for accessing the report?
Pricing options include single-user, multi-user, and enterprise licenses priced at USD 4750, USD 5250, and USD 8750 respectively.
10. Is the market size provided in terms of value or volume?
The market size is provided in terms of value, measured in Million.
11. Are there any specific market keywords associated with the report?
Yes, the market keyword associated with the report is "High Throughput Process Development Market," which aids in identifying and referencing the specific market segment covered.
12. How do I determine which pricing option suits my needs best?
The pricing options vary based on user requirements and access needs. Individual users may opt for single-user licenses, while businesses requiring broader access may choose multi-user or enterprise licenses for cost-effective access to the report.
13. Are there any additional resources or data provided in the High Throughput Process Development Market report?
While the report offers comprehensive insights, it's advisable to review the specific contents or supplementary materials provided to ascertain if additional resources or data are available.
14. How can I stay updated on further developments or reports in the High Throughput Process Development Market?
To stay informed about further developments, trends, and reports in the High Throughput Process Development Market, consider subscribing to industry newsletters, following relevant companies and organizations, or regularly checking reputable industry news sources and publications.
Methodology
Step 1 - Identification of Relevant Samples Size from Population Database


Step 2 - Approaches for Defining Global Market Size (Value, Volume* & Price*)

Note*: In applicable scenarios
Step 3 - Data Sources
Primary Research
- Web Analytics
- Survey Reports
- Research Institute
- Latest Research Reports
- Opinion Leaders
Secondary Research
- Annual Reports
- White Paper
- Latest Press Release
- Industry Association
- Paid Database
- Investor Presentations

Step 4 - Data Triangulation
Involves using different sources of information in order to increase the validity of a study
These sources are likely to be stakeholders in a program - participants, other researchers, program staff, other community members, and so on.
Then we put all data in single framework & apply various statistical tools to find out the dynamic on the market.
During the analysis stage, feedback from the stakeholder groups would be compared to determine areas of agreement as well as areas of divergence


