
Key Insights
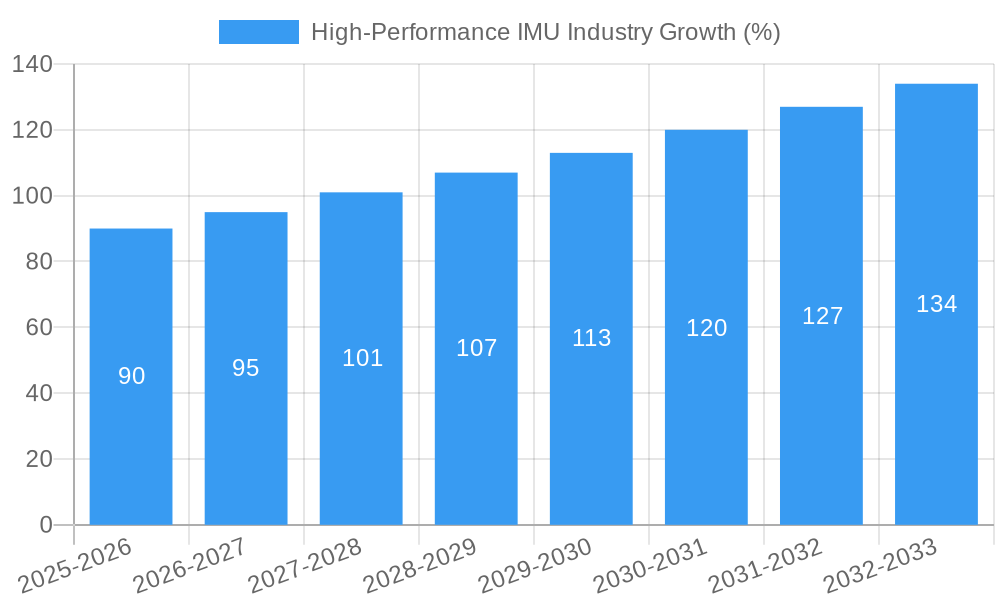
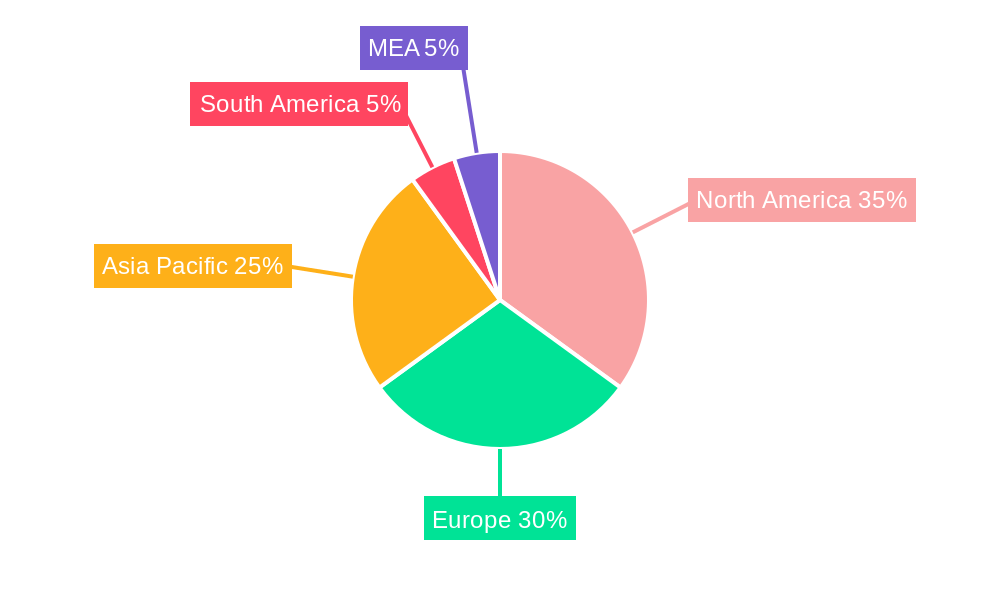
The high-performance inertial measurement unit (IMU) market is experiencing robust growth, driven by increasing demand across diverse sectors. A compound annual growth rate (CAGR) of 6.00% from 2019 to 2024 suggests a significant expansion, and this momentum is expected to continue through 2033. Key drivers include the proliferation of autonomous vehicles, the burgeoning aerospace and defense industries demanding precise navigation and guidance systems, and the growing adoption of robotics across industrial automation. Advancements in sensor technology, miniaturization, and improved accuracy are further fueling market expansion. The industrial sector, encompassing applications in manufacturing, logistics, and construction, represents a significant market segment due to the rising need for precise positioning and motion tracking in automated systems. The aerospace and defense sector is a crucial contributor due to its dependence on highly accurate navigation for various platforms, including drones and missiles. The automotive industry's shift towards advanced driver-assistance systems (ADAS) and autonomous driving technologies is driving strong demand for high-performance IMUs. Competitive landscape analysis reveals key players like Honeywell, Thales, and Bosch Sensortec leading the market with their extensive product portfolios and strong technological capabilities. However, emerging players are also making strides, introducing innovative products and solutions. Geographical distribution shows North America and Europe as leading markets currently, while the Asia-Pacific region is anticipated to witness the fastest growth due to increasing investments in infrastructure and technological advancements.
Challenges for market participants include managing supply chain complexities, maintaining high levels of product accuracy and reliability, and meeting the rigorous safety and certification standards in various applications. The overall market is characterized by continuous innovation, with companies focused on integrating IMUs with other sensor technologies to improve performance and functionality. Future growth will likely be influenced by breakthroughs in artificial intelligence (AI) and machine learning (ML) that enhance IMU data processing and interpretation, opening up new applications across several sectors. Furthermore, the increasing adoption of Internet of Things (IoT) devices presents significant growth opportunities for high-performance IMUs, as these devices require accurate positioning and motion tracking for efficient data collection and analysis. The market’s continued expansion indicates strong potential for both established and emerging players, demanding consistent innovation to meet the ever-evolving demands of diverse end-user applications.
High-Performance IMU Industry Market Report: 2019-2033 Forecast
This comprehensive report provides an in-depth analysis of the High-Performance IMU industry, offering invaluable insights for stakeholders seeking to navigate this dynamic market. The report covers the period 2019-2033, with a focus on the forecast period 2025-2033 and a base year of 2025. The study meticulously examines market structure, competitive dynamics, leading players, technological advancements, and key growth drivers, enabling informed decision-making and strategic planning. The global market size is projected to reach xx Million by 2033.
High-Performance IMU Industry Market Structure & Competitive Dynamics
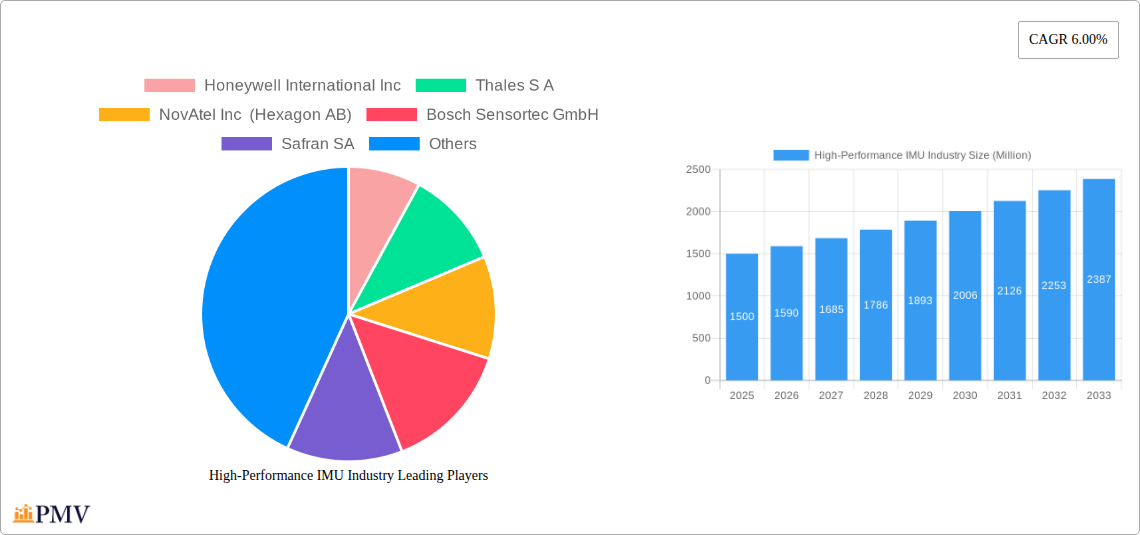
The High-Performance IMU market exhibits a moderately concentrated structure, with key players like Honeywell International Inc, Thales S A, and NovAtel Inc (Hexagon AB) holding significant market share. The industry is characterized by intense competition driven by technological innovation and continuous product improvements. Market share fluctuations are common due to M&A activity and the introduction of disruptive technologies. Regulatory frameworks, particularly within the aerospace and defense sectors, play a significant role in shaping market dynamics. Product substitutes, such as alternative navigation systems, pose a competitive threat, although the accuracy and reliability of IMUs often secure their dominance in many applications. End-user trends, particularly the rising adoption of autonomous systems in various sectors, are a key growth driver. The total value of M&A deals in the High-Performance IMU industry during the historical period (2019-2024) is estimated at xx Million. Specific deal sizes are not publicly disclosed for all transactions, hampering a precise breakdown of market share. However, the report provides an estimated market share distribution based on available data and industry analysis.
- Market Concentration: Moderately Concentrated
- Innovation Ecosystems: Highly Active
- Regulatory Frameworks: Stringent, especially in Aerospace & Defense
- M&A Activity: Significant, driving consolidation
- End-User Trends: Shift towards automation and autonomous systems
High-Performance IMU Industry Industry Trends & Insights
The High-Performance IMU market is experiencing robust growth, driven by increasing demand across diverse end-user applications. The Compound Annual Growth Rate (CAGR) is projected at xx% during the forecast period (2025-2033). This growth is fueled by advancements in MEMS technology, leading to smaller, lighter, and more cost-effective IMUs. The market penetration of High-Performance IMUs in autonomous vehicles, drones, and robotics is rapidly increasing. Technological disruptions, such as the integration of AI and machine learning algorithms, are enhancing the capabilities of IMUs and expanding their applications. Consumer preferences are shifting towards higher accuracy, reliability, and miniaturization. The competitive landscape remains intense, with companies focusing on product differentiation, strategic partnerships, and technological innovation to secure market share.
Dominant Markets & Segments in High-Performance IMU Industry
The Aerospace and Defense segment currently dominates the High-Performance IMU market, accounting for the largest market share. This dominance is driven by the critical role of IMUs in navigation and guidance systems for aircraft, missiles, and other defense applications. The Automotive segment is experiencing rapid growth due to the increasing adoption of Advanced Driver-Assistance Systems (ADAS) and autonomous driving technologies.
- Aerospace & Defense: High demand for precision navigation and guidance systems. Key drivers include military modernization programs and increasing investments in defense technologies.
- Automotive: Rapid adoption of ADAS and autonomous vehicles is a major growth driver. Stringent safety regulations and consumer demand for advanced safety features are fuelling market expansion.
- Industrial: Growing adoption of robotics, automation, and industrial IoT (IIoT) solutions drives demand.
- Marine (Civil, Naval and Offshore): Demand for navigation and positioning systems in ships and offshore platforms, driven by stricter safety regulations and increasing maritime activities.
- Other End-user Industry: Emerging applications in areas like healthcare, consumer electronics and surveying contribute to moderate growth.
The North American region currently holds a leading position, followed by Europe and Asia Pacific. The growth in these regions is influenced by factors such as technological advancements, government support for R&D, and increasing industrialization.
High-Performance IMU Industry Product Innovations
Recent advancements in High-Performance IMUs include the integration of advanced sensor fusion algorithms, improved accuracy and reliability, and miniaturization. These innovations are expanding the applications of IMUs into new areas like augmented reality, virtual reality, and wearable technology. The development of low-power, low-cost IMUs is broadening market accessibility. Competitive advantages are primarily achieved through superior accuracy, performance, size, power consumption, and integration capabilities.
Report Segmentation & Scope
This report segments the High-Performance IMU market by end-user application: Industrial, Aerospace and Defense, Automotive, Marine (Civil, Naval and Offshore), and Other End-user Industry. Each segment's growth projections, market sizes, and competitive dynamics are thoroughly analyzed. The forecast period spans from 2025 to 2033.
Key Drivers of High-Performance IMU Industry Growth
The High-Performance IMU market's growth is fueled by several key drivers. These include technological advancements in MEMS technology, increasing demand for autonomous systems in various industries (automotive, aerospace, robotics), rising investments in R&D, and favorable government policies promoting technological innovation. Stringent safety regulations in sectors like aviation and automotive also contribute to the demand for reliable and accurate IMUs.
Challenges in the High-Performance IMU Industry Sector
The High-Performance IMU industry faces challenges such as stringent regulatory compliance requirements, especially in the aerospace and defense sectors. Supply chain disruptions and the intense competition from established players and new entrants pose significant hurdles. Achieving high accuracy and reliability at a reduced cost remains a key technical challenge. Furthermore, price pressures and the potential for technology obsolescence could affect profit margins.
Leading Players in the High-Performance IMU Industry Market
- Honeywell International Inc
- Thales S A
- NovAtel Inc (Hexagon AB)
- Bosch Sensortec GmbH
- Safran SA
- Moog Inc
- STMicroelectronics N V
- Seiko Epson Corporation
- VectorNav Technologies LLC
- TDK Corporation
- Analog Devices Inc
- Sensonor Technologies AS
- Northrop Grumman Corporation
- Collins Aerospace
Key Developments in High-Performance IMU Industry Sector
- 2022 Q4: Honeywell launched a new high-precision IMU with improved accuracy and reduced power consumption.
- 2023 Q1: Thales announced a strategic partnership with a leading AI company to enhance IMU capabilities.
- 2023 Q2: Bosch Sensortec released a new miniaturized IMU for wearable applications.
- (Further key developments will be detailed within the full report)
Strategic High-Performance IMU Industry Market Outlook
The High-Performance IMU market is poised for continued expansion, driven by the growing adoption of autonomous systems, technological advancements, and increased investments in R&D. Strategic opportunities exist for companies focused on developing innovative solutions, expanding into emerging markets, and forging strategic partnerships. The focus on miniaturization, improved accuracy, and reduced power consumption will shape future market trends. Companies focusing on specific niche applications and demonstrating strong technological leadership will gain a competitive advantage.
High-Performance IMU Industry Segmentation
-
1. End-user Application
- 1.1. Industrial
- 1.2. Aerospace and Defense
- 1.3. Automotive
- 1.4. Marine (Civil, Naval and Offshore)
- 1.5. Other End-user Industry
High-Performance IMU Industry Segmentation By Geography
- 1. North America
- 2. Europe
- 3. Asia Pacific
- 4. Latin America
- 5. Middle East and Africa
High-Performance IMU Industry REPORT HIGHLIGHTS
| Aspects | Details |
|---|---|
| Study Period | 2019-2033 |
| Base Year | 2024 |
| Estimated Year | 2025 |
| Forecast Period | 2025-2033 |
| Historical Period | 2019-2024 |
| Growth Rate | CAGR of 6.00% from 2019-2033 |
| Segmentation |
|
Table of Contents
- 1. Introduction
- 1.1. Research Scope
- 1.2. Market Segmentation
- 1.3. Research Methodology
- 1.4. Definitions and Assumptions
- 2. Executive Summary
- 2.1. Introduction
- 3. Market Dynamics
- 3.1. Introduction
- 3.2. Market Drivers
- 3.2.1. ; Growing Demand of IMU in Aerospace and Defense Sector; Technological Improvement in Core Component Products
- 3.3. Market Restrains
- 3.3.1. ; Complex Manufacturing Processes
- 3.4. Market Trends
- 3.4.1. Industrial Sector is Expected to Witness Significant Growth Rate
- 4. Market Factor Analysis
- 4.1. Porters Five Forces
- 4.2. Supply/Value Chain
- 4.3. PESTEL analysis
- 4.4. Market Entropy
- 4.5. Patent/Trademark Analysis
- 5. Global High-Performance IMU Industry Analysis, Insights and Forecast, 2019-2031
- 5.1. Market Analysis, Insights and Forecast - by End-user Application
- 5.1.1. Industrial
- 5.1.2. Aerospace and Defense
- 5.1.3. Automotive
- 5.1.4. Marine (Civil, Naval and Offshore)
- 5.1.5. Other End-user Industry
- 5.2. Market Analysis, Insights and Forecast - by Region
- 5.2.1. North America
- 5.2.2. Europe
- 5.2.3. Asia Pacific
- 5.2.4. Latin America
- 5.2.5. Middle East and Africa
- 5.1. Market Analysis, Insights and Forecast - by End-user Application
- 6. North America High-Performance IMU Industry Analysis, Insights and Forecast, 2019-2031
- 6.1. Market Analysis, Insights and Forecast - by End-user Application
- 6.1.1. Industrial
- 6.1.2. Aerospace and Defense
- 6.1.3. Automotive
- 6.1.4. Marine (Civil, Naval and Offshore)
- 6.1.5. Other End-user Industry
- 6.1. Market Analysis, Insights and Forecast - by End-user Application
- 7. Europe High-Performance IMU Industry Analysis, Insights and Forecast, 2019-2031
- 7.1. Market Analysis, Insights and Forecast - by End-user Application
- 7.1.1. Industrial
- 7.1.2. Aerospace and Defense
- 7.1.3. Automotive
- 7.1.4. Marine (Civil, Naval and Offshore)
- 7.1.5. Other End-user Industry
- 7.1. Market Analysis, Insights and Forecast - by End-user Application
- 8. Asia Pacific High-Performance IMU Industry Analysis, Insights and Forecast, 2019-2031
- 8.1. Market Analysis, Insights and Forecast - by End-user Application
- 8.1.1. Industrial
- 8.1.2. Aerospace and Defense
- 8.1.3. Automotive
- 8.1.4. Marine (Civil, Naval and Offshore)
- 8.1.5. Other End-user Industry
- 8.1. Market Analysis, Insights and Forecast - by End-user Application
- 9. Latin America High-Performance IMU Industry Analysis, Insights and Forecast, 2019-2031
- 9.1. Market Analysis, Insights and Forecast - by End-user Application
- 9.1.1. Industrial
- 9.1.2. Aerospace and Defense
- 9.1.3. Automotive
- 9.1.4. Marine (Civil, Naval and Offshore)
- 9.1.5. Other End-user Industry
- 9.1. Market Analysis, Insights and Forecast - by End-user Application
- 10. Middle East and Africa High-Performance IMU Industry Analysis, Insights and Forecast, 2019-2031
- 10.1. Market Analysis, Insights and Forecast - by End-user Application
- 10.1.1. Industrial
- 10.1.2. Aerospace and Defense
- 10.1.3. Automotive
- 10.1.4. Marine (Civil, Naval and Offshore)
- 10.1.5. Other End-user Industry
- 10.1. Market Analysis, Insights and Forecast - by End-user Application
- 11. North America High-Performance IMU Industry Analysis, Insights and Forecast, 2019-2031
- 11.1. Market Analysis, Insights and Forecast - By Country/Sub-region
- 11.1.1 United States
- 11.1.2 Canada
- 11.1.3 Mexico
- 12. Europe High-Performance IMU Industry Analysis, Insights and Forecast, 2019-2031
- 12.1. Market Analysis, Insights and Forecast - By Country/Sub-region
- 12.1.1 Germany
- 12.1.2 United Kingdom
- 12.1.3 France
- 12.1.4 Spain
- 12.1.5 Italy
- 12.1.6 Spain
- 12.1.7 Belgium
- 12.1.8 Netherland
- 12.1.9 Nordics
- 12.1.10 Rest of Europe
- 13. Asia Pacific High-Performance IMU Industry Analysis, Insights and Forecast, 2019-2031
- 13.1. Market Analysis, Insights and Forecast - By Country/Sub-region
- 13.1.1 China
- 13.1.2 Japan
- 13.1.3 India
- 13.1.4 South Korea
- 13.1.5 Southeast Asia
- 13.1.6 Australia
- 13.1.7 Indonesia
- 13.1.8 Phillipes
- 13.1.9 Singapore
- 13.1.10 Thailandc
- 13.1.11 Rest of Asia Pacific
- 14. South America High-Performance IMU Industry Analysis, Insights and Forecast, 2019-2031
- 14.1. Market Analysis, Insights and Forecast - By Country/Sub-region
- 14.1.1 Brazil
- 14.1.2 Argentina
- 14.1.3 Peru
- 14.1.4 Chile
- 14.1.5 Colombia
- 14.1.6 Ecuador
- 14.1.7 Venezuela
- 14.1.8 Rest of South America
- 15. North America High-Performance IMU Industry Analysis, Insights and Forecast, 2019-2031
- 15.1. Market Analysis, Insights and Forecast - By Country/Sub-region
- 15.1.1 United States
- 15.1.2 Canada
- 15.1.3 Mexico
- 16. MEA High-Performance IMU Industry Analysis, Insights and Forecast, 2019-2031
- 16.1. Market Analysis, Insights and Forecast - By Country/Sub-region
- 16.1.1 United Arab Emirates
- 16.1.2 Saudi Arabia
- 16.1.3 South Africa
- 16.1.4 Rest of Middle East and Africa
- 17. Competitive Analysis
- 17.1. Global Market Share Analysis 2024
- 17.2. Company Profiles
- 17.2.1 Honeywell International Inc
- 17.2.1.1. Overview
- 17.2.1.2. Products
- 17.2.1.3. SWOT Analysis
- 17.2.1.4. Recent Developments
- 17.2.1.5. Financials (Based on Availability)
- 17.2.2 Thales S A
- 17.2.2.1. Overview
- 17.2.2.2. Products
- 17.2.2.3. SWOT Analysis
- 17.2.2.4. Recent Developments
- 17.2.2.5. Financials (Based on Availability)
- 17.2.3 NovAtel Inc (Hexagon AB)
- 17.2.3.1. Overview
- 17.2.3.2. Products
- 17.2.3.3. SWOT Analysis
- 17.2.3.4. Recent Developments
- 17.2.3.5. Financials (Based on Availability)
- 17.2.4 Bosch Sensortec GmbH
- 17.2.4.1. Overview
- 17.2.4.2. Products
- 17.2.4.3. SWOT Analysis
- 17.2.4.4. Recent Developments
- 17.2.4.5. Financials (Based on Availability)
- 17.2.5 Safran SA
- 17.2.5.1. Overview
- 17.2.5.2. Products
- 17.2.5.3. SWOT Analysis
- 17.2.5.4. Recent Developments
- 17.2.5.5. Financials (Based on Availability)
- 17.2.6 Moog Inc
- 17.2.6.1. Overview
- 17.2.6.2. Products
- 17.2.6.3. SWOT Analysis
- 17.2.6.4. Recent Developments
- 17.2.6.5. Financials (Based on Availability)
- 17.2.7 STMicroelectronics N V
- 17.2.7.1. Overview
- 17.2.7.2. Products
- 17.2.7.3. SWOT Analysis
- 17.2.7.4. Recent Developments
- 17.2.7.5. Financials (Based on Availability)
- 17.2.8 Seiko Epson Corporation
- 17.2.8.1. Overview
- 17.2.8.2. Products
- 17.2.8.3. SWOT Analysis
- 17.2.8.4. Recent Developments
- 17.2.8.5. Financials (Based on Availability)
- 17.2.9 VectorNav Technologies LLC
- 17.2.9.1. Overview
- 17.2.9.2. Products
- 17.2.9.3. SWOT Analysis
- 17.2.9.4. Recent Developments
- 17.2.9.5. Financials (Based on Availability)
- 17.2.10 TDK Corporation
- 17.2.10.1. Overview
- 17.2.10.2. Products
- 17.2.10.3. SWOT Analysis
- 17.2.10.4. Recent Developments
- 17.2.10.5. Financials (Based on Availability)
- 17.2.11 Analog Devices Inc
- 17.2.11.1. Overview
- 17.2.11.2. Products
- 17.2.11.3. SWOT Analysis
- 17.2.11.4. Recent Developments
- 17.2.11.5. Financials (Based on Availability)
- 17.2.12 Sensonor Technologies AS
- 17.2.12.1. Overview
- 17.2.12.2. Products
- 17.2.12.3. SWOT Analysis
- 17.2.12.4. Recent Developments
- 17.2.12.5. Financials (Based on Availability)
- 17.2.13 Northrop Grumman Corporation
- 17.2.13.1. Overview
- 17.2.13.2. Products
- 17.2.13.3. SWOT Analysis
- 17.2.13.4. Recent Developments
- 17.2.13.5. Financials (Based on Availability)
- 17.2.14 Collins Aerospace
- 17.2.14.1. Overview
- 17.2.14.2. Products
- 17.2.14.3. SWOT Analysis
- 17.2.14.4. Recent Developments
- 17.2.14.5. Financials (Based on Availability)
- 17.2.1 Honeywell International Inc
List of Figures
- Figure 1: Global High-Performance IMU Industry Revenue Breakdown (Million, %) by Region 2024 & 2032
- Figure 2: North America High-Performance IMU Industry Revenue (Million), by Country 2024 & 2032
- Figure 3: North America High-Performance IMU Industry Revenue Share (%), by Country 2024 & 2032
- Figure 4: Europe High-Performance IMU Industry Revenue (Million), by Country 2024 & 2032
- Figure 5: Europe High-Performance IMU Industry Revenue Share (%), by Country 2024 & 2032
- Figure 6: Asia Pacific High-Performance IMU Industry Revenue (Million), by Country 2024 & 2032
- Figure 7: Asia Pacific High-Performance IMU Industry Revenue Share (%), by Country 2024 & 2032
- Figure 8: South America High-Performance IMU Industry Revenue (Million), by Country 2024 & 2032
- Figure 9: South America High-Performance IMU Industry Revenue Share (%), by Country 2024 & 2032
- Figure 10: North America High-Performance IMU Industry Revenue (Million), by Country 2024 & 2032
- Figure 11: North America High-Performance IMU Industry Revenue Share (%), by Country 2024 & 2032
- Figure 12: MEA High-Performance IMU Industry Revenue (Million), by Country 2024 & 2032
- Figure 13: MEA High-Performance IMU Industry Revenue Share (%), by Country 2024 & 2032
- Figure 14: North America High-Performance IMU Industry Revenue (Million), by End-user Application 2024 & 2032
- Figure 15: North America High-Performance IMU Industry Revenue Share (%), by End-user Application 2024 & 2032
- Figure 16: North America High-Performance IMU Industry Revenue (Million), by Country 2024 & 2032
- Figure 17: North America High-Performance IMU Industry Revenue Share (%), by Country 2024 & 2032
- Figure 18: Europe High-Performance IMU Industry Revenue (Million), by End-user Application 2024 & 2032
- Figure 19: Europe High-Performance IMU Industry Revenue Share (%), by End-user Application 2024 & 2032
- Figure 20: Europe High-Performance IMU Industry Revenue (Million), by Country 2024 & 2032
- Figure 21: Europe High-Performance IMU Industry Revenue Share (%), by Country 2024 & 2032
- Figure 22: Asia Pacific High-Performance IMU Industry Revenue (Million), by End-user Application 2024 & 2032
- Figure 23: Asia Pacific High-Performance IMU Industry Revenue Share (%), by End-user Application 2024 & 2032
- Figure 24: Asia Pacific High-Performance IMU Industry Revenue (Million), by Country 2024 & 2032
- Figure 25: Asia Pacific High-Performance IMU Industry Revenue Share (%), by Country 2024 & 2032
- Figure 26: Latin America High-Performance IMU Industry Revenue (Million), by End-user Application 2024 & 2032
- Figure 27: Latin America High-Performance IMU Industry Revenue Share (%), by End-user Application 2024 & 2032
- Figure 28: Latin America High-Performance IMU Industry Revenue (Million), by Country 2024 & 2032
- Figure 29: Latin America High-Performance IMU Industry Revenue Share (%), by Country 2024 & 2032
- Figure 30: Middle East and Africa High-Performance IMU Industry Revenue (Million), by End-user Application 2024 & 2032
- Figure 31: Middle East and Africa High-Performance IMU Industry Revenue Share (%), by End-user Application 2024 & 2032
- Figure 32: Middle East and Africa High-Performance IMU Industry Revenue (Million), by Country 2024 & 2032
- Figure 33: Middle East and Africa High-Performance IMU Industry Revenue Share (%), by Country 2024 & 2032
List of Tables
- Table 1: Global High-Performance IMU Industry Revenue Million Forecast, by Region 2019 & 2032
- Table 2: Global High-Performance IMU Industry Revenue Million Forecast, by End-user Application 2019 & 2032
- Table 3: Global High-Performance IMU Industry Revenue Million Forecast, by Region 2019 & 2032
- Table 4: Global High-Performance IMU Industry Revenue Million Forecast, by Country 2019 & 2032
- Table 5: United States High-Performance IMU Industry Revenue (Million) Forecast, by Application 2019 & 2032
- Table 6: Canada High-Performance IMU Industry Revenue (Million) Forecast, by Application 2019 & 2032
- Table 7: Mexico High-Performance IMU Industry Revenue (Million) Forecast, by Application 2019 & 2032
- Table 8: Global High-Performance IMU Industry Revenue Million Forecast, by Country 2019 & 2032
- Table 9: Germany High-Performance IMU Industry Revenue (Million) Forecast, by Application 2019 & 2032
- Table 10: United Kingdom High-Performance IMU Industry Revenue (Million) Forecast, by Application 2019 & 2032
- Table 11: France High-Performance IMU Industry Revenue (Million) Forecast, by Application 2019 & 2032
- Table 12: Spain High-Performance IMU Industry Revenue (Million) Forecast, by Application 2019 & 2032
- Table 13: Italy High-Performance IMU Industry Revenue (Million) Forecast, by Application 2019 & 2032
- Table 14: Spain High-Performance IMU Industry Revenue (Million) Forecast, by Application 2019 & 2032
- Table 15: Belgium High-Performance IMU Industry Revenue (Million) Forecast, by Application 2019 & 2032
- Table 16: Netherland High-Performance IMU Industry Revenue (Million) Forecast, by Application 2019 & 2032
- Table 17: Nordics High-Performance IMU Industry Revenue (Million) Forecast, by Application 2019 & 2032
- Table 18: Rest of Europe High-Performance IMU Industry Revenue (Million) Forecast, by Application 2019 & 2032
- Table 19: Global High-Performance IMU Industry Revenue Million Forecast, by Country 2019 & 2032
- Table 20: China High-Performance IMU Industry Revenue (Million) Forecast, by Application 2019 & 2032
- Table 21: Japan High-Performance IMU Industry Revenue (Million) Forecast, by Application 2019 & 2032
- Table 22: India High-Performance IMU Industry Revenue (Million) Forecast, by Application 2019 & 2032
- Table 23: South Korea High-Performance IMU Industry Revenue (Million) Forecast, by Application 2019 & 2032
- Table 24: Southeast Asia High-Performance IMU Industry Revenue (Million) Forecast, by Application 2019 & 2032
- Table 25: Australia High-Performance IMU Industry Revenue (Million) Forecast, by Application 2019 & 2032
- Table 26: Indonesia High-Performance IMU Industry Revenue (Million) Forecast, by Application 2019 & 2032
- Table 27: Phillipes High-Performance IMU Industry Revenue (Million) Forecast, by Application 2019 & 2032
- Table 28: Singapore High-Performance IMU Industry Revenue (Million) Forecast, by Application 2019 & 2032
- Table 29: Thailandc High-Performance IMU Industry Revenue (Million) Forecast, by Application 2019 & 2032
- Table 30: Rest of Asia Pacific High-Performance IMU Industry Revenue (Million) Forecast, by Application 2019 & 2032
- Table 31: Global High-Performance IMU Industry Revenue Million Forecast, by Country 2019 & 2032
- Table 32: Brazil High-Performance IMU Industry Revenue (Million) Forecast, by Application 2019 & 2032
- Table 33: Argentina High-Performance IMU Industry Revenue (Million) Forecast, by Application 2019 & 2032
- Table 34: Peru High-Performance IMU Industry Revenue (Million) Forecast, by Application 2019 & 2032
- Table 35: Chile High-Performance IMU Industry Revenue (Million) Forecast, by Application 2019 & 2032
- Table 36: Colombia High-Performance IMU Industry Revenue (Million) Forecast, by Application 2019 & 2032
- Table 37: Ecuador High-Performance IMU Industry Revenue (Million) Forecast, by Application 2019 & 2032
- Table 38: Venezuela High-Performance IMU Industry Revenue (Million) Forecast, by Application 2019 & 2032
- Table 39: Rest of South America High-Performance IMU Industry Revenue (Million) Forecast, by Application 2019 & 2032
- Table 40: Global High-Performance IMU Industry Revenue Million Forecast, by Country 2019 & 2032
- Table 41: United States High-Performance IMU Industry Revenue (Million) Forecast, by Application 2019 & 2032
- Table 42: Canada High-Performance IMU Industry Revenue (Million) Forecast, by Application 2019 & 2032
- Table 43: Mexico High-Performance IMU Industry Revenue (Million) Forecast, by Application 2019 & 2032
- Table 44: Global High-Performance IMU Industry Revenue Million Forecast, by Country 2019 & 2032
- Table 45: United Arab Emirates High-Performance IMU Industry Revenue (Million) Forecast, by Application 2019 & 2032
- Table 46: Saudi Arabia High-Performance IMU Industry Revenue (Million) Forecast, by Application 2019 & 2032
- Table 47: South Africa High-Performance IMU Industry Revenue (Million) Forecast, by Application 2019 & 2032
- Table 48: Rest of Middle East and Africa High-Performance IMU Industry Revenue (Million) Forecast, by Application 2019 & 2032
- Table 49: Global High-Performance IMU Industry Revenue Million Forecast, by End-user Application 2019 & 2032
- Table 50: Global High-Performance IMU Industry Revenue Million Forecast, by Country 2019 & 2032
- Table 51: Global High-Performance IMU Industry Revenue Million Forecast, by End-user Application 2019 & 2032
- Table 52: Global High-Performance IMU Industry Revenue Million Forecast, by Country 2019 & 2032
- Table 53: Global High-Performance IMU Industry Revenue Million Forecast, by End-user Application 2019 & 2032
- Table 54: Global High-Performance IMU Industry Revenue Million Forecast, by Country 2019 & 2032
- Table 55: Global High-Performance IMU Industry Revenue Million Forecast, by End-user Application 2019 & 2032
- Table 56: Global High-Performance IMU Industry Revenue Million Forecast, by Country 2019 & 2032
- Table 57: Global High-Performance IMU Industry Revenue Million Forecast, by End-user Application 2019 & 2032
- Table 58: Global High-Performance IMU Industry Revenue Million Forecast, by Country 2019 & 2032
Frequently Asked Questions
1. What is the projected Compound Annual Growth Rate (CAGR) of the High-Performance IMU Industry?
The projected CAGR is approximately 6.00%.
2. Which companies are prominent players in the High-Performance IMU Industry?
Key companies in the market include Honeywell International Inc, Thales S A, NovAtel Inc (Hexagon AB), Bosch Sensortec GmbH, Safran SA, Moog Inc, STMicroelectronics N V, Seiko Epson Corporation, VectorNav Technologies LLC, TDK Corporation, Analog Devices Inc, Sensonor Technologies AS, Northrop Grumman Corporation, Collins Aerospace.
3. What are the main segments of the High-Performance IMU Industry?
The market segments include End-user Application.
4. Can you provide details about the market size?
The market size is estimated to be USD XX Million as of 2022.
5. What are some drivers contributing to market growth?
; Growing Demand of IMU in Aerospace and Defense Sector; Technological Improvement in Core Component Products.
6. What are the notable trends driving market growth?
Industrial Sector is Expected to Witness Significant Growth Rate.
7. Are there any restraints impacting market growth?
; Complex Manufacturing Processes.
8. Can you provide examples of recent developments in the market?
N/A
9. What pricing options are available for accessing the report?
Pricing options include single-user, multi-user, and enterprise licenses priced at USD 4750, USD 5250, and USD 8750 respectively.
10. Is the market size provided in terms of value or volume?
The market size is provided in terms of value, measured in Million.
11. Are there any specific market keywords associated with the report?
Yes, the market keyword associated with the report is "High-Performance IMU Industry," which aids in identifying and referencing the specific market segment covered.
12. How do I determine which pricing option suits my needs best?
The pricing options vary based on user requirements and access needs. Individual users may opt for single-user licenses, while businesses requiring broader access may choose multi-user or enterprise licenses for cost-effective access to the report.
13. Are there any additional resources or data provided in the High-Performance IMU Industry report?
While the report offers comprehensive insights, it's advisable to review the specific contents or supplementary materials provided to ascertain if additional resources or data are available.
14. How can I stay updated on further developments or reports in the High-Performance IMU Industry?
To stay informed about further developments, trends, and reports in the High-Performance IMU Industry, consider subscribing to industry newsletters, following relevant companies and organizations, or regularly checking reputable industry news sources and publications.
Methodology
Step 1 - Identification of Relevant Samples Size from Population Database


Step 2 - Approaches for Defining Global Market Size (Value, Volume* & Price*)

Note*: In applicable scenarios
Step 3 - Data Sources
Primary Research
- Web Analytics
- Survey Reports
- Research Institute
- Latest Research Reports
- Opinion Leaders
Secondary Research
- Annual Reports
- White Paper
- Latest Press Release
- Industry Association
- Paid Database
- Investor Presentations

Step 4 - Data Triangulation
Involves using different sources of information in order to increase the validity of a study
These sources are likely to be stakeholders in a program - participants, other researchers, program staff, other community members, and so on.
Then we put all data in single framework & apply various statistical tools to find out the dynamic on the market.
During the analysis stage, feedback from the stakeholder groups would be compared to determine areas of agreement as well as areas of divergence


