
Key Insights
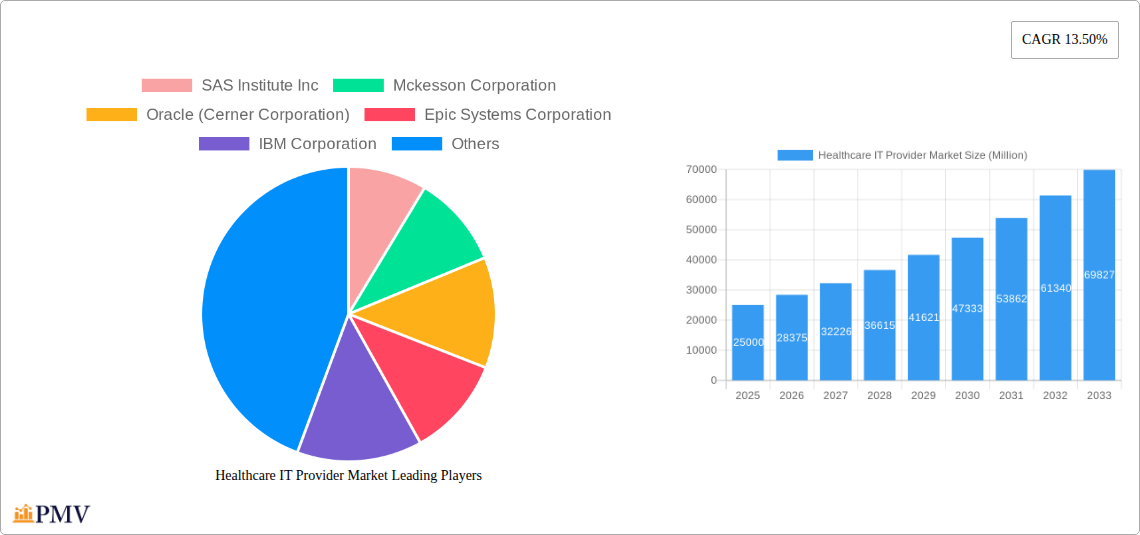
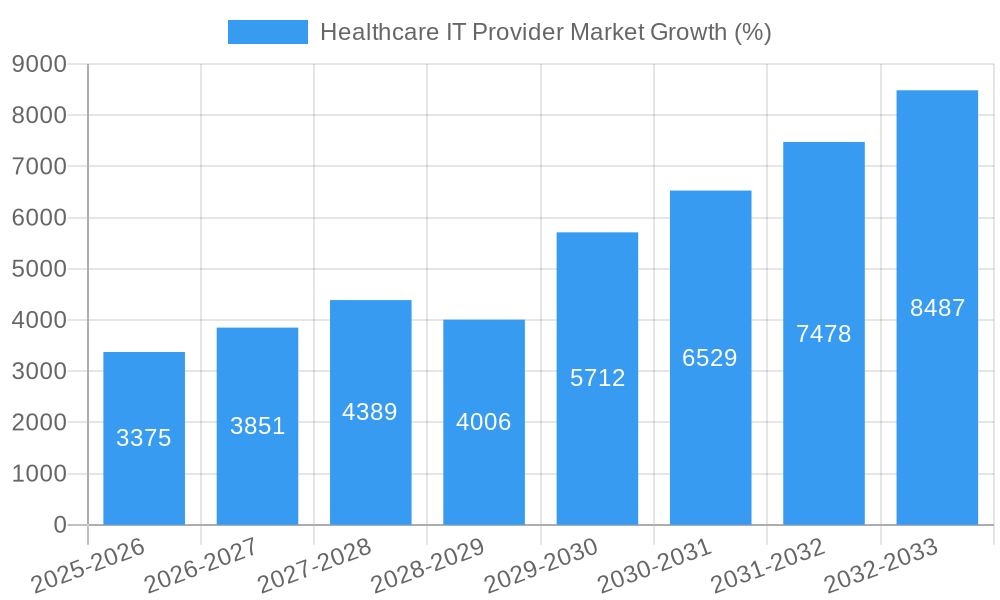
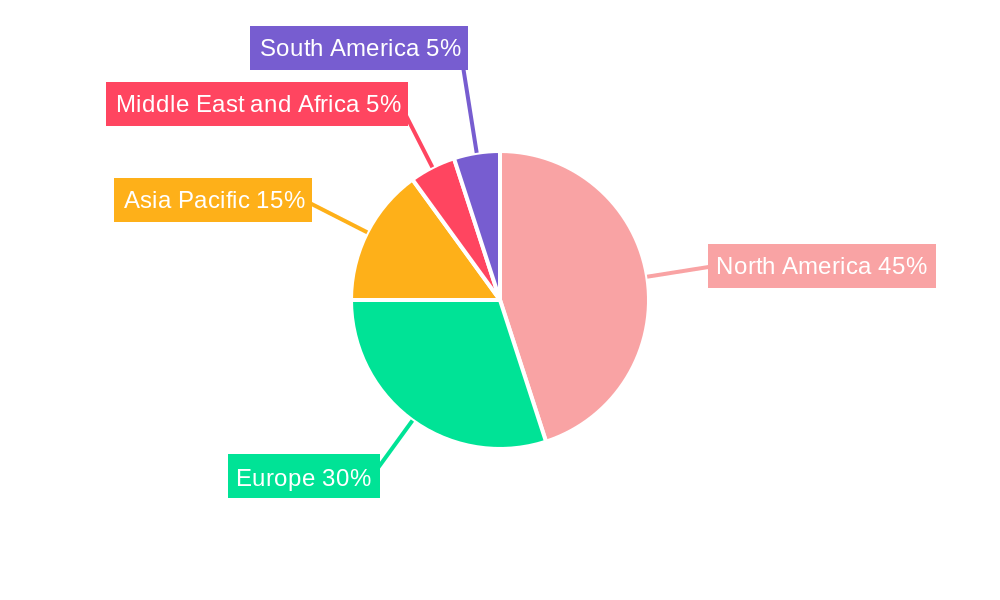
The Healthcare IT Provider market is experiencing robust growth, driven by increasing adoption of electronic health records (EHRs), the expanding telehealth sector, and a growing need for efficient clinical decision support systems (CDSS). A compound annual growth rate (CAGR) of 13.50% from 2019 to 2024 suggests a significant market expansion, projected to continue into the forecast period (2025-2033). The market's segmentation reveals strong demand across various segments, including Laboratory Information Systems (LIS), Radiology Information Systems (RIS), and Cardiovascular Information Systems (CVIS). Cloud-based delivery models are gaining traction, offering scalability and cost-effectiveness compared to on-premise solutions. Key players such as Epic Systems, Cerner, and McKesson are leading the market, leveraging their established infrastructure and technological expertise. The North American market currently holds a substantial share, fueled by advanced healthcare infrastructure and high technological adoption rates. However, Asia Pacific is poised for significant growth, driven by increasing healthcare expenditure and government initiatives to improve healthcare infrastructure and digitalization. Competition is intense, with established players facing challenges from emerging technology providers offering specialized and innovative solutions. The market's growth is, however, subject to certain restraints, such as data security concerns, regulatory compliance requirements, and the high cost of implementation and maintenance for some systems.
The continued expansion of the Healthcare IT Provider market is underpinned by several factors including the increasing prevalence of chronic diseases demanding better data management, the rising demand for improved patient care through data-driven insights, and the global push toward value-based care models requiring robust IT infrastructure. The market's diverse product portfolio (software, hardware, and services) and varied deployment models cater to the specific needs of various healthcare providers, fostering further expansion. Future growth will likely be influenced by the successful integration of artificial intelligence (AI) and machine learning (ML) into healthcare IT solutions, further enhancing diagnostic accuracy, treatment planning, and operational efficiency. Furthermore, the ongoing development and adoption of interoperable healthcare IT systems will play a crucial role in improving data exchange and coordination across the healthcare ecosystem, driving further market growth in the coming years.
Healthcare IT Provider Market: A Comprehensive Report (2019-2033)
This detailed report provides a comprehensive analysis of the Healthcare IT Provider Market, offering actionable insights for stakeholders across the industry. The study period covers 2019-2033, with 2025 serving as the base and estimated year. The forecast period extends from 2025-2033, and the historical period encompasses 2019-2024. The report segments the market by business segment, component, and delivery mode, offering a granular understanding of market dynamics and growth opportunities. The total market size in 2025 is estimated at xx Million.
Healthcare IT Provider Market Market Structure & Competitive Dynamics
The Healthcare IT Provider market is characterized by a moderately concentrated structure, with several large players holding significant market share. Key players like SAS Institute Inc, McKesson Corporation, Oracle (Cerner Corporation), Epic Systems Corporation, IBM Corporation, Siemens Healthineers, 3M, Wipro, General Electric Company (GE Healthcare), Koninklijke Philips NV, Optum Inc, and Allscripts Healthcare Solutions Inc. compete intensely, driving innovation and shaping market dynamics. Market share in 2025 is estimated as follows: Epic Systems Corporation (xx%), Oracle (Cerner Corporation) (xx%), McKesson Corporation (xx%), and others (xx%). The remaining share is distributed across other significant players and smaller niche players.
The market exhibits a robust innovation ecosystem, with continuous advancements in software, hardware, and services. Regulatory frameworks, including HIPAA and GDPR, significantly impact market operations and data security practices. The rise of cloud-based solutions and the increasing adoption of telehealth are transforming the competitive landscape. Product substitutes, such as legacy systems and manual processes, are gradually being replaced by more efficient and integrated healthcare IT solutions. End-user trends, including the preference for user-friendly interfaces and interoperability, are driving demand for sophisticated and adaptable solutions. M&A activity has been relatively high in recent years, with deal values exceeding xx Million in the past five years, as companies consolidate to expand their reach and service offerings. Examples include recent strategic acquisitions aimed at strengthening EHR capabilities and expanding into emerging areas such as AI-powered diagnostics.
Healthcare IT Provider Market Industry Trends & Insights
The global Healthcare IT Provider market is experiencing robust growth, driven by several key factors. The increasing adoption of Electronic Health Records (EHRs) to enhance patient care and improve operational efficiency is a primary growth driver. The rising prevalence of chronic diseases, aging populations, and the growing need for efficient healthcare delivery are contributing to market expansion. Technological advancements, such as Artificial Intelligence (AI) and Machine Learning (ML), are revolutionizing healthcare data analysis and decision-making, further boosting market growth. The rising demand for interoperable systems and improved data security are also pushing the adoption of advanced healthcare IT solutions. The market is witnessing a significant shift towards cloud-based solutions, offering scalability, cost-effectiveness, and enhanced accessibility.
Consumer preferences are evolving, with increased demand for personalized healthcare experiences and seamless access to medical information. Competitive dynamics are intensifying, with companies investing heavily in R&D to develop innovative solutions and gain a competitive edge. The market is projected to witness a Compound Annual Growth Rate (CAGR) of xx% during the forecast period (2025-2033), with market penetration expected to reach xx% by 2033. The growth is particularly pronounced in developing economies due to increased government investments in healthcare infrastructure and rising healthcare expenditure.
Dominant Markets & Segments in Healthcare IT Provider Market
Leading Regions/Countries: North America currently dominates the market due to high healthcare expenditure, advanced healthcare infrastructure, and early adoption of advanced technologies. However, the Asia-Pacific region is projected to experience the fastest growth during the forecast period driven by increasing healthcare investments and rising digital health adoption.
Dominant Segments:
- Business Segment: Electronic Health Records (EHR) holds the largest market share, followed by Radiology Information Systems (RIS) and Laboratory Information Systems (LIS). The growth of EHR is driven by government mandates for EHR adoption and increasing focus on improving healthcare quality. Telemedicine is experiencing rapid growth due to increasing demand for remote healthcare access.
- Component: The software segment dominates the market due to increasing demand for sophisticated healthcare IT software solutions. The services segment is also experiencing significant growth due to the rising demand for customized healthcare IT services.
- Delivery Mode: Cloud-based solutions are gaining popularity due to their scalability, cost-effectiveness, and accessibility. However, on-premise deployments remain significant, especially in sectors prioritizing data security and regulatory compliance.
Key Drivers for Dominance:
- North America: High healthcare expenditure, strong regulatory support, advanced technology adoption.
- Asia-Pacific: Rapid economic growth, rising healthcare investment, increasing smartphone penetration.
- EHR: Government mandates, focus on improved healthcare quality and efficiency.
- Cloud-based Delivery: Cost-effectiveness, scalability, enhanced accessibility.
Healthcare IT Provider Market Product Innovations
Recent advancements in healthcare IT include the integration of AI and ML for predictive analytics, improved diagnostics, and personalized treatment plans. The development of interoperable systems is enhancing data exchange and improving healthcare coordination. Cloud-based solutions offer enhanced scalability and accessibility, while advanced security features address data privacy concerns. These innovations are improving healthcare outcomes, reducing costs, and enhancing patient experiences, creating a strong market fit.
Report Segmentation & Scope
This report segments the Healthcare IT Provider market comprehensively by:
Business Segment: LIS, RIS, CVIS, EHR, Telemedicine, CDSS, PACS & VNA, Other Business Segments. Each segment's growth projection, market size (in Millions), and competitive dynamics are analyzed individually. EHR is projected to experience significant growth due to government regulations, while Telemedicine is expected to experience rapid growth driven by increasing patient demand.
Component: Software, Hardware, Services. Software commands the largest market share. Services are experiencing rapid growth due to increasing demand for customization and integration.
Delivery Mode: On-premise, Cloud-based. Cloud-based deployments are showing strong growth due to cost and scalability benefits.
Key Drivers of Healthcare IT Provider Market Growth
Technological advancements, such as AI, ML, and cloud computing, are revolutionizing healthcare IT, driving market growth. Government regulations mandating EHR adoption are fueling market expansion, especially in regions with high healthcare expenditure. The rising prevalence of chronic diseases and an aging global population are also contributing factors. Increasing investments in healthcare infrastructure and rising healthcare expenditure, especially in developing economies, are boosting market growth. The growing demand for personalized healthcare experiences and seamless access to medical information are further key drivers.
Challenges in the Healthcare IT Provider Market Sector
The Healthcare IT Provider market faces several challenges including high implementation costs, data security and privacy concerns, and interoperability issues between different systems. Regulatory compliance requirements and the need for skilled professionals to manage and maintain complex systems pose significant hurdles. Competition is intense, with established players and new entrants vying for market share. Supply chain disruptions can also impact the availability of hardware and software components. These factors can lead to delays in project implementation and increase the total cost of ownership.
Leading Players in the Healthcare IT Provider Market Market
- SAS Institute Inc
- McKesson Corporation
- Oracle (Cerner Corporation)
- Epic Systems Corporation
- IBM Corporation
- Siemens Healthineers
- 3M
- Wipro
- General Electric Company (GE Healthcare)
- Koninklijke Philips NV
- Optum Inc
- Allscripts Healthcare Solutions Inc
Key Developments in Healthcare IT Provider Market Sector
December 2022: Charles River Community Health (CRCH) transitioned to the Epic Electronic Health Records (EHR) system, demonstrating increased adoption of leading EHR solutions and highlighting the potential for improved patient care and online access.
November 2022: HCA Healthcare's large-scale deployment of MEDITECH Expanse clinical decision support tool signifies a major shift towards advanced clinical decision support systems and underscores the increasing importance of intuitive, mobile interfaces in enhancing healthcare delivery.
Strategic Healthcare IT Provider Market Market Outlook
The Healthcare IT Provider market presents significant growth potential, driven by technological innovation, rising healthcare expenditure, and the growing adoption of telehealth. Strategic opportunities exist in developing AI-powered diagnostic tools, enhancing data security measures, and creating interoperable systems. Focusing on personalized healthcare solutions and addressing the challenges related to data privacy and interoperability will be crucial for success in this dynamic market. Expansion into underserved regions and developing innovative solutions to meet the unique needs of these markets offer further opportunities for growth and market penetration.
Healthcare IT Provider Market Segmentation
-
1. Business Segment
- 1.1. Laboratory Information Systems (LIS)
- 1.2. Radiology Information Systems (RIS)
- 1.3. Cardiovascular Information System (CVIS)
- 1.4. Electronic Health Records (EHR)
- 1.5. Telemedicine
- 1.6. Clinical Decision Support System (CDSS)
- 1.7. Picture
- 1.8. Other Business Segments
-
2. Component
- 2.1. Software
- 2.2. Hardware
- 2.3. Services
-
3. Delivery Mode
- 3.1. On-premise
- 3.2. Cloud-based
Healthcare IT Provider Market Segmentation By Geography
-
1. North America
- 1.1. United States
- 1.2. Canada
- 1.3. Mexico
-
2. Europe
- 2.1. Germany
- 2.2. United Kingdom
- 2.3. France
- 2.4. Italy
- 2.5. Spain
- 2.6. Rest of Europe
-
3. Asia Pacific
- 3.1. China
- 3.2. Japan
- 3.3. India
- 3.4. Australia
- 3.5. South Korea
- 3.6. Rest of Asia Pacific
-
4. Middle East and Africa
- 4.1. GCC
- 4.2. South Africa
- 4.3. Rest of Middle East and Africa
-
5. South America
- 5.1. Brazil
- 5.2. Argentina
- 5.3. Rest of South America
Healthcare IT Provider Market REPORT HIGHLIGHTS
| Aspects | Details |
|---|---|
| Study Period | 2019-2033 |
| Base Year | 2024 |
| Estimated Year | 2025 |
| Forecast Period | 2025-2033 |
| Historical Period | 2019-2024 |
| Growth Rate | CAGR of 13.50% from 2019-2033 |
| Segmentation |
|
Table of Contents
- 1. Introduction
- 1.1. Research Scope
- 1.2. Market Segmentation
- 1.3. Research Methodology
- 1.4. Definitions and Assumptions
- 2. Executive Summary
- 2.1. Introduction
- 3. Market Dynamics
- 3.1. Introduction
- 3.2. Market Drivers
- 3.2.1. Rise in the Demand for Paper-less Technology; Emergence of Social Media and its Impact on the Healthcare IT Industry; Increased Government Funding on Healthcare Services and Infrastructure
- 3.3. Market Restrains
- 3.3.1. Lack of Skilled Labor; High Maintenance Costs
- 3.4. Market Trends
- 3.4.1. Clinical Decision Support System (CDSS) Segment Expected to Drive the Market
- 4. Market Factor Analysis
- 4.1. Porters Five Forces
- 4.2. Supply/Value Chain
- 4.3. PESTEL analysis
- 4.4. Market Entropy
- 4.5. Patent/Trademark Analysis
- 5. Global Healthcare IT Provider Market Analysis, Insights and Forecast, 2019-2031
- 5.1. Market Analysis, Insights and Forecast - by Business Segment
- 5.1.1. Laboratory Information Systems (LIS)
- 5.1.2. Radiology Information Systems (RIS)
- 5.1.3. Cardiovascular Information System (CVIS)
- 5.1.4. Electronic Health Records (EHR)
- 5.1.5. Telemedicine
- 5.1.6. Clinical Decision Support System (CDSS)
- 5.1.7. Picture
- 5.1.8. Other Business Segments
- 5.2. Market Analysis, Insights and Forecast - by Component
- 5.2.1. Software
- 5.2.2. Hardware
- 5.2.3. Services
- 5.3. Market Analysis, Insights and Forecast - by Delivery Mode
- 5.3.1. On-premise
- 5.3.2. Cloud-based
- 5.4. Market Analysis, Insights and Forecast - by Region
- 5.4.1. North America
- 5.4.2. Europe
- 5.4.3. Asia Pacific
- 5.4.4. Middle East and Africa
- 5.4.5. South America
- 5.1. Market Analysis, Insights and Forecast - by Business Segment
- 6. North America Healthcare IT Provider Market Analysis, Insights and Forecast, 2019-2031
- 6.1. Market Analysis, Insights and Forecast - by Business Segment
- 6.1.1. Laboratory Information Systems (LIS)
- 6.1.2. Radiology Information Systems (RIS)
- 6.1.3. Cardiovascular Information System (CVIS)
- 6.1.4. Electronic Health Records (EHR)
- 6.1.5. Telemedicine
- 6.1.6. Clinical Decision Support System (CDSS)
- 6.1.7. Picture
- 6.1.8. Other Business Segments
- 6.2. Market Analysis, Insights and Forecast - by Component
- 6.2.1. Software
- 6.2.2. Hardware
- 6.2.3. Services
- 6.3. Market Analysis, Insights and Forecast - by Delivery Mode
- 6.3.1. On-premise
- 6.3.2. Cloud-based
- 6.1. Market Analysis, Insights and Forecast - by Business Segment
- 7. Europe Healthcare IT Provider Market Analysis, Insights and Forecast, 2019-2031
- 7.1. Market Analysis, Insights and Forecast - by Business Segment
- 7.1.1. Laboratory Information Systems (LIS)
- 7.1.2. Radiology Information Systems (RIS)
- 7.1.3. Cardiovascular Information System (CVIS)
- 7.1.4. Electronic Health Records (EHR)
- 7.1.5. Telemedicine
- 7.1.6. Clinical Decision Support System (CDSS)
- 7.1.7. Picture
- 7.1.8. Other Business Segments
- 7.2. Market Analysis, Insights and Forecast - by Component
- 7.2.1. Software
- 7.2.2. Hardware
- 7.2.3. Services
- 7.3. Market Analysis, Insights and Forecast - by Delivery Mode
- 7.3.1. On-premise
- 7.3.2. Cloud-based
- 7.1. Market Analysis, Insights and Forecast - by Business Segment
- 8. Asia Pacific Healthcare IT Provider Market Analysis, Insights and Forecast, 2019-2031
- 8.1. Market Analysis, Insights and Forecast - by Business Segment
- 8.1.1. Laboratory Information Systems (LIS)
- 8.1.2. Radiology Information Systems (RIS)
- 8.1.3. Cardiovascular Information System (CVIS)
- 8.1.4. Electronic Health Records (EHR)
- 8.1.5. Telemedicine
- 8.1.6. Clinical Decision Support System (CDSS)
- 8.1.7. Picture
- 8.1.8. Other Business Segments
- 8.2. Market Analysis, Insights and Forecast - by Component
- 8.2.1. Software
- 8.2.2. Hardware
- 8.2.3. Services
- 8.3. Market Analysis, Insights and Forecast - by Delivery Mode
- 8.3.1. On-premise
- 8.3.2. Cloud-based
- 8.1. Market Analysis, Insights and Forecast - by Business Segment
- 9. Middle East and Africa Healthcare IT Provider Market Analysis, Insights and Forecast, 2019-2031
- 9.1. Market Analysis, Insights and Forecast - by Business Segment
- 9.1.1. Laboratory Information Systems (LIS)
- 9.1.2. Radiology Information Systems (RIS)
- 9.1.3. Cardiovascular Information System (CVIS)
- 9.1.4. Electronic Health Records (EHR)
- 9.1.5. Telemedicine
- 9.1.6. Clinical Decision Support System (CDSS)
- 9.1.7. Picture
- 9.1.8. Other Business Segments
- 9.2. Market Analysis, Insights and Forecast - by Component
- 9.2.1. Software
- 9.2.2. Hardware
- 9.2.3. Services
- 9.3. Market Analysis, Insights and Forecast - by Delivery Mode
- 9.3.1. On-premise
- 9.3.2. Cloud-based
- 9.1. Market Analysis, Insights and Forecast - by Business Segment
- 10. South America Healthcare IT Provider Market Analysis, Insights and Forecast, 2019-2031
- 10.1. Market Analysis, Insights and Forecast - by Business Segment
- 10.1.1. Laboratory Information Systems (LIS)
- 10.1.2. Radiology Information Systems (RIS)
- 10.1.3. Cardiovascular Information System (CVIS)
- 10.1.4. Electronic Health Records (EHR)
- 10.1.5. Telemedicine
- 10.1.6. Clinical Decision Support System (CDSS)
- 10.1.7. Picture
- 10.1.8. Other Business Segments
- 10.2. Market Analysis, Insights and Forecast - by Component
- 10.2.1. Software
- 10.2.2. Hardware
- 10.2.3. Services
- 10.3. Market Analysis, Insights and Forecast - by Delivery Mode
- 10.3.1. On-premise
- 10.3.2. Cloud-based
- 10.1. Market Analysis, Insights and Forecast - by Business Segment
- 11. North America Healthcare IT Provider Market Analysis, Insights and Forecast, 2019-2031
- 11.1. Market Analysis, Insights and Forecast - By Country/Sub-region
- 11.1.1 United States
- 11.1.2 Canada
- 11.1.3 Mexico
- 12. Europe Healthcare IT Provider Market Analysis, Insights and Forecast, 2019-2031
- 12.1. Market Analysis, Insights and Forecast - By Country/Sub-region
- 12.1.1 Germany
- 12.1.2 United Kingdom
- 12.1.3 France
- 12.1.4 Italy
- 12.1.5 Spain
- 12.1.6 Rest of Europe
- 13. Asia Pacific Healthcare IT Provider Market Analysis, Insights and Forecast, 2019-2031
- 13.1. Market Analysis, Insights and Forecast - By Country/Sub-region
- 13.1.1 China
- 13.1.2 Japan
- 13.1.3 India
- 13.1.4 Australia
- 13.1.5 South Korea
- 13.1.6 Rest of Asia Pacific
- 14. Middle East and Africa Healthcare IT Provider Market Analysis, Insights and Forecast, 2019-2031
- 14.1. Market Analysis, Insights and Forecast - By Country/Sub-region
- 14.1.1 GCC
- 14.1.2 South Africa
- 14.1.3 Rest of Middle East and Africa
- 15. South America Healthcare IT Provider Market Analysis, Insights and Forecast, 2019-2031
- 15.1. Market Analysis, Insights and Forecast - By Country/Sub-region
- 15.1.1 Brazil
- 15.1.2 Argentina
- 15.1.3 Rest of South America
- 16. Competitive Analysis
- 16.1. Global Market Share Analysis 2024
- 16.2. Company Profiles
- 16.2.1 SAS Institute Inc
- 16.2.1.1. Overview
- 16.2.1.2. Products
- 16.2.1.3. SWOT Analysis
- 16.2.1.4. Recent Developments
- 16.2.1.5. Financials (Based on Availability)
- 16.2.2 Mckesson Corporation
- 16.2.2.1. Overview
- 16.2.2.2. Products
- 16.2.2.3. SWOT Analysis
- 16.2.2.4. Recent Developments
- 16.2.2.5. Financials (Based on Availability)
- 16.2.3 Oracle (Cerner Corporation)
- 16.2.3.1. Overview
- 16.2.3.2. Products
- 16.2.3.3. SWOT Analysis
- 16.2.3.4. Recent Developments
- 16.2.3.5. Financials (Based on Availability)
- 16.2.4 Epic Systems Corporation
- 16.2.4.1. Overview
- 16.2.4.2. Products
- 16.2.4.3. SWOT Analysis
- 16.2.4.4. Recent Developments
- 16.2.4.5. Financials (Based on Availability)
- 16.2.5 IBM Corporation
- 16.2.5.1. Overview
- 16.2.5.2. Products
- 16.2.5.3. SWOT Analysis
- 16.2.5.4. Recent Developments
- 16.2.5.5. Financials (Based on Availability)
- 16.2.6 Siemens Healthineers
- 16.2.6.1. Overview
- 16.2.6.2. Products
- 16.2.6.3. SWOT Analysis
- 16.2.6.4. Recent Developments
- 16.2.6.5. Financials (Based on Availability)
- 16.2.7 3M
- 16.2.7.1. Overview
- 16.2.7.2. Products
- 16.2.7.3. SWOT Analysis
- 16.2.7.4. Recent Developments
- 16.2.7.5. Financials (Based on Availability)
- 16.2.8 Wipro
- 16.2.8.1. Overview
- 16.2.8.2. Products
- 16.2.8.3. SWOT Analysis
- 16.2.8.4. Recent Developments
- 16.2.8.5. Financials (Based on Availability)
- 16.2.9 General Electric Company (GE Healthcare)
- 16.2.9.1. Overview
- 16.2.9.2. Products
- 16.2.9.3. SWOT Analysis
- 16.2.9.4. Recent Developments
- 16.2.9.5. Financials (Based on Availability)
- 16.2.10 Koninklijke Philips NV
- 16.2.10.1. Overview
- 16.2.10.2. Products
- 16.2.10.3. SWOT Analysis
- 16.2.10.4. Recent Developments
- 16.2.10.5. Financials (Based on Availability)
- 16.2.11 Optum Inc
- 16.2.11.1. Overview
- 16.2.11.2. Products
- 16.2.11.3. SWOT Analysis
- 16.2.11.4. Recent Developments
- 16.2.11.5. Financials (Based on Availability)
- 16.2.12 Allscripts Healthcare Solutions Inc
- 16.2.12.1. Overview
- 16.2.12.2. Products
- 16.2.12.3. SWOT Analysis
- 16.2.12.4. Recent Developments
- 16.2.12.5. Financials (Based on Availability)
- 16.2.1 SAS Institute Inc
List of Figures
- Figure 1: Global Healthcare IT Provider Market Revenue Breakdown (Million, %) by Region 2024 & 2032
- Figure 2: Global Healthcare IT Provider Market Volume Breakdown (K Unit, %) by Region 2024 & 2032
- Figure 3: North America Healthcare IT Provider Market Revenue (Million), by Country 2024 & 2032
- Figure 4: North America Healthcare IT Provider Market Volume (K Unit), by Country 2024 & 2032
- Figure 5: North America Healthcare IT Provider Market Revenue Share (%), by Country 2024 & 2032
- Figure 6: North America Healthcare IT Provider Market Volume Share (%), by Country 2024 & 2032
- Figure 7: Europe Healthcare IT Provider Market Revenue (Million), by Country 2024 & 2032
- Figure 8: Europe Healthcare IT Provider Market Volume (K Unit), by Country 2024 & 2032
- Figure 9: Europe Healthcare IT Provider Market Revenue Share (%), by Country 2024 & 2032
- Figure 10: Europe Healthcare IT Provider Market Volume Share (%), by Country 2024 & 2032
- Figure 11: Asia Pacific Healthcare IT Provider Market Revenue (Million), by Country 2024 & 2032
- Figure 12: Asia Pacific Healthcare IT Provider Market Volume (K Unit), by Country 2024 & 2032
- Figure 13: Asia Pacific Healthcare IT Provider Market Revenue Share (%), by Country 2024 & 2032
- Figure 14: Asia Pacific Healthcare IT Provider Market Volume Share (%), by Country 2024 & 2032
- Figure 15: Middle East and Africa Healthcare IT Provider Market Revenue (Million), by Country 2024 & 2032
- Figure 16: Middle East and Africa Healthcare IT Provider Market Volume (K Unit), by Country 2024 & 2032
- Figure 17: Middle East and Africa Healthcare IT Provider Market Revenue Share (%), by Country 2024 & 2032
- Figure 18: Middle East and Africa Healthcare IT Provider Market Volume Share (%), by Country 2024 & 2032
- Figure 19: South America Healthcare IT Provider Market Revenue (Million), by Country 2024 & 2032
- Figure 20: South America Healthcare IT Provider Market Volume (K Unit), by Country 2024 & 2032
- Figure 21: South America Healthcare IT Provider Market Revenue Share (%), by Country 2024 & 2032
- Figure 22: South America Healthcare IT Provider Market Volume Share (%), by Country 2024 & 2032
- Figure 23: North America Healthcare IT Provider Market Revenue (Million), by Business Segment 2024 & 2032
- Figure 24: North America Healthcare IT Provider Market Volume (K Unit), by Business Segment 2024 & 2032
- Figure 25: North America Healthcare IT Provider Market Revenue Share (%), by Business Segment 2024 & 2032
- Figure 26: North America Healthcare IT Provider Market Volume Share (%), by Business Segment 2024 & 2032
- Figure 27: North America Healthcare IT Provider Market Revenue (Million), by Component 2024 & 2032
- Figure 28: North America Healthcare IT Provider Market Volume (K Unit), by Component 2024 & 2032
- Figure 29: North America Healthcare IT Provider Market Revenue Share (%), by Component 2024 & 2032
- Figure 30: North America Healthcare IT Provider Market Volume Share (%), by Component 2024 & 2032
- Figure 31: North America Healthcare IT Provider Market Revenue (Million), by Delivery Mode 2024 & 2032
- Figure 32: North America Healthcare IT Provider Market Volume (K Unit), by Delivery Mode 2024 & 2032
- Figure 33: North America Healthcare IT Provider Market Revenue Share (%), by Delivery Mode 2024 & 2032
- Figure 34: North America Healthcare IT Provider Market Volume Share (%), by Delivery Mode 2024 & 2032
- Figure 35: North America Healthcare IT Provider Market Revenue (Million), by Country 2024 & 2032
- Figure 36: North America Healthcare IT Provider Market Volume (K Unit), by Country 2024 & 2032
- Figure 37: North America Healthcare IT Provider Market Revenue Share (%), by Country 2024 & 2032
- Figure 38: North America Healthcare IT Provider Market Volume Share (%), by Country 2024 & 2032
- Figure 39: Europe Healthcare IT Provider Market Revenue (Million), by Business Segment 2024 & 2032
- Figure 40: Europe Healthcare IT Provider Market Volume (K Unit), by Business Segment 2024 & 2032
- Figure 41: Europe Healthcare IT Provider Market Revenue Share (%), by Business Segment 2024 & 2032
- Figure 42: Europe Healthcare IT Provider Market Volume Share (%), by Business Segment 2024 & 2032
- Figure 43: Europe Healthcare IT Provider Market Revenue (Million), by Component 2024 & 2032
- Figure 44: Europe Healthcare IT Provider Market Volume (K Unit), by Component 2024 & 2032
- Figure 45: Europe Healthcare IT Provider Market Revenue Share (%), by Component 2024 & 2032
- Figure 46: Europe Healthcare IT Provider Market Volume Share (%), by Component 2024 & 2032
- Figure 47: Europe Healthcare IT Provider Market Revenue (Million), by Delivery Mode 2024 & 2032
- Figure 48: Europe Healthcare IT Provider Market Volume (K Unit), by Delivery Mode 2024 & 2032
- Figure 49: Europe Healthcare IT Provider Market Revenue Share (%), by Delivery Mode 2024 & 2032
- Figure 50: Europe Healthcare IT Provider Market Volume Share (%), by Delivery Mode 2024 & 2032
- Figure 51: Europe Healthcare IT Provider Market Revenue (Million), by Country 2024 & 2032
- Figure 52: Europe Healthcare IT Provider Market Volume (K Unit), by Country 2024 & 2032
- Figure 53: Europe Healthcare IT Provider Market Revenue Share (%), by Country 2024 & 2032
- Figure 54: Europe Healthcare IT Provider Market Volume Share (%), by Country 2024 & 2032
- Figure 55: Asia Pacific Healthcare IT Provider Market Revenue (Million), by Business Segment 2024 & 2032
- Figure 56: Asia Pacific Healthcare IT Provider Market Volume (K Unit), by Business Segment 2024 & 2032
- Figure 57: Asia Pacific Healthcare IT Provider Market Revenue Share (%), by Business Segment 2024 & 2032
- Figure 58: Asia Pacific Healthcare IT Provider Market Volume Share (%), by Business Segment 2024 & 2032
- Figure 59: Asia Pacific Healthcare IT Provider Market Revenue (Million), by Component 2024 & 2032
- Figure 60: Asia Pacific Healthcare IT Provider Market Volume (K Unit), by Component 2024 & 2032
- Figure 61: Asia Pacific Healthcare IT Provider Market Revenue Share (%), by Component 2024 & 2032
- Figure 62: Asia Pacific Healthcare IT Provider Market Volume Share (%), by Component 2024 & 2032
- Figure 63: Asia Pacific Healthcare IT Provider Market Revenue (Million), by Delivery Mode 2024 & 2032
- Figure 64: Asia Pacific Healthcare IT Provider Market Volume (K Unit), by Delivery Mode 2024 & 2032
- Figure 65: Asia Pacific Healthcare IT Provider Market Revenue Share (%), by Delivery Mode 2024 & 2032
- Figure 66: Asia Pacific Healthcare IT Provider Market Volume Share (%), by Delivery Mode 2024 & 2032
- Figure 67: Asia Pacific Healthcare IT Provider Market Revenue (Million), by Country 2024 & 2032
- Figure 68: Asia Pacific Healthcare IT Provider Market Volume (K Unit), by Country 2024 & 2032
- Figure 69: Asia Pacific Healthcare IT Provider Market Revenue Share (%), by Country 2024 & 2032
- Figure 70: Asia Pacific Healthcare IT Provider Market Volume Share (%), by Country 2024 & 2032
- Figure 71: Middle East and Africa Healthcare IT Provider Market Revenue (Million), by Business Segment 2024 & 2032
- Figure 72: Middle East and Africa Healthcare IT Provider Market Volume (K Unit), by Business Segment 2024 & 2032
- Figure 73: Middle East and Africa Healthcare IT Provider Market Revenue Share (%), by Business Segment 2024 & 2032
- Figure 74: Middle East and Africa Healthcare IT Provider Market Volume Share (%), by Business Segment 2024 & 2032
- Figure 75: Middle East and Africa Healthcare IT Provider Market Revenue (Million), by Component 2024 & 2032
- Figure 76: Middle East and Africa Healthcare IT Provider Market Volume (K Unit), by Component 2024 & 2032
- Figure 77: Middle East and Africa Healthcare IT Provider Market Revenue Share (%), by Component 2024 & 2032
- Figure 78: Middle East and Africa Healthcare IT Provider Market Volume Share (%), by Component 2024 & 2032
- Figure 79: Middle East and Africa Healthcare IT Provider Market Revenue (Million), by Delivery Mode 2024 & 2032
- Figure 80: Middle East and Africa Healthcare IT Provider Market Volume (K Unit), by Delivery Mode 2024 & 2032
- Figure 81: Middle East and Africa Healthcare IT Provider Market Revenue Share (%), by Delivery Mode 2024 & 2032
- Figure 82: Middle East and Africa Healthcare IT Provider Market Volume Share (%), by Delivery Mode 2024 & 2032
- Figure 83: Middle East and Africa Healthcare IT Provider Market Revenue (Million), by Country 2024 & 2032
- Figure 84: Middle East and Africa Healthcare IT Provider Market Volume (K Unit), by Country 2024 & 2032
- Figure 85: Middle East and Africa Healthcare IT Provider Market Revenue Share (%), by Country 2024 & 2032
- Figure 86: Middle East and Africa Healthcare IT Provider Market Volume Share (%), by Country 2024 & 2032
- Figure 87: South America Healthcare IT Provider Market Revenue (Million), by Business Segment 2024 & 2032
- Figure 88: South America Healthcare IT Provider Market Volume (K Unit), by Business Segment 2024 & 2032
- Figure 89: South America Healthcare IT Provider Market Revenue Share (%), by Business Segment 2024 & 2032
- Figure 90: South America Healthcare IT Provider Market Volume Share (%), by Business Segment 2024 & 2032
- Figure 91: South America Healthcare IT Provider Market Revenue (Million), by Component 2024 & 2032
- Figure 92: South America Healthcare IT Provider Market Volume (K Unit), by Component 2024 & 2032
- Figure 93: South America Healthcare IT Provider Market Revenue Share (%), by Component 2024 & 2032
- Figure 94: South America Healthcare IT Provider Market Volume Share (%), by Component 2024 & 2032
- Figure 95: South America Healthcare IT Provider Market Revenue (Million), by Delivery Mode 2024 & 2032
- Figure 96: South America Healthcare IT Provider Market Volume (K Unit), by Delivery Mode 2024 & 2032
- Figure 97: South America Healthcare IT Provider Market Revenue Share (%), by Delivery Mode 2024 & 2032
- Figure 98: South America Healthcare IT Provider Market Volume Share (%), by Delivery Mode 2024 & 2032
- Figure 99: South America Healthcare IT Provider Market Revenue (Million), by Country 2024 & 2032
- Figure 100: South America Healthcare IT Provider Market Volume (K Unit), by Country 2024 & 2032
- Figure 101: South America Healthcare IT Provider Market Revenue Share (%), by Country 2024 & 2032
- Figure 102: South America Healthcare IT Provider Market Volume Share (%), by Country 2024 & 2032
List of Tables
- Table 1: Global Healthcare IT Provider Market Revenue Million Forecast, by Region 2019 & 2032
- Table 2: Global Healthcare IT Provider Market Volume K Unit Forecast, by Region 2019 & 2032
- Table 3: Global Healthcare IT Provider Market Revenue Million Forecast, by Business Segment 2019 & 2032
- Table 4: Global Healthcare IT Provider Market Volume K Unit Forecast, by Business Segment 2019 & 2032
- Table 5: Global Healthcare IT Provider Market Revenue Million Forecast, by Component 2019 & 2032
- Table 6: Global Healthcare IT Provider Market Volume K Unit Forecast, by Component 2019 & 2032
- Table 7: Global Healthcare IT Provider Market Revenue Million Forecast, by Delivery Mode 2019 & 2032
- Table 8: Global Healthcare IT Provider Market Volume K Unit Forecast, by Delivery Mode 2019 & 2032
- Table 9: Global Healthcare IT Provider Market Revenue Million Forecast, by Region 2019 & 2032
- Table 10: Global Healthcare IT Provider Market Volume K Unit Forecast, by Region 2019 & 2032
- Table 11: Global Healthcare IT Provider Market Revenue Million Forecast, by Country 2019 & 2032
- Table 12: Global Healthcare IT Provider Market Volume K Unit Forecast, by Country 2019 & 2032
- Table 13: United States Healthcare IT Provider Market Revenue (Million) Forecast, by Application 2019 & 2032
- Table 14: United States Healthcare IT Provider Market Volume (K Unit) Forecast, by Application 2019 & 2032
- Table 15: Canada Healthcare IT Provider Market Revenue (Million) Forecast, by Application 2019 & 2032
- Table 16: Canada Healthcare IT Provider Market Volume (K Unit) Forecast, by Application 2019 & 2032
- Table 17: Mexico Healthcare IT Provider Market Revenue (Million) Forecast, by Application 2019 & 2032
- Table 18: Mexico Healthcare IT Provider Market Volume (K Unit) Forecast, by Application 2019 & 2032
- Table 19: Global Healthcare IT Provider Market Revenue Million Forecast, by Country 2019 & 2032
- Table 20: Global Healthcare IT Provider Market Volume K Unit Forecast, by Country 2019 & 2032
- Table 21: Germany Healthcare IT Provider Market Revenue (Million) Forecast, by Application 2019 & 2032
- Table 22: Germany Healthcare IT Provider Market Volume (K Unit) Forecast, by Application 2019 & 2032
- Table 23: United Kingdom Healthcare IT Provider Market Revenue (Million) Forecast, by Application 2019 & 2032
- Table 24: United Kingdom Healthcare IT Provider Market Volume (K Unit) Forecast, by Application 2019 & 2032
- Table 25: France Healthcare IT Provider Market Revenue (Million) Forecast, by Application 2019 & 2032
- Table 26: France Healthcare IT Provider Market Volume (K Unit) Forecast, by Application 2019 & 2032
- Table 27: Italy Healthcare IT Provider Market Revenue (Million) Forecast, by Application 2019 & 2032
- Table 28: Italy Healthcare IT Provider Market Volume (K Unit) Forecast, by Application 2019 & 2032
- Table 29: Spain Healthcare IT Provider Market Revenue (Million) Forecast, by Application 2019 & 2032
- Table 30: Spain Healthcare IT Provider Market Volume (K Unit) Forecast, by Application 2019 & 2032
- Table 31: Rest of Europe Healthcare IT Provider Market Revenue (Million) Forecast, by Application 2019 & 2032
- Table 32: Rest of Europe Healthcare IT Provider Market Volume (K Unit) Forecast, by Application 2019 & 2032
- Table 33: Global Healthcare IT Provider Market Revenue Million Forecast, by Country 2019 & 2032
- Table 34: Global Healthcare IT Provider Market Volume K Unit Forecast, by Country 2019 & 2032
- Table 35: China Healthcare IT Provider Market Revenue (Million) Forecast, by Application 2019 & 2032
- Table 36: China Healthcare IT Provider Market Volume (K Unit) Forecast, by Application 2019 & 2032
- Table 37: Japan Healthcare IT Provider Market Revenue (Million) Forecast, by Application 2019 & 2032
- Table 38: Japan Healthcare IT Provider Market Volume (K Unit) Forecast, by Application 2019 & 2032
- Table 39: India Healthcare IT Provider Market Revenue (Million) Forecast, by Application 2019 & 2032
- Table 40: India Healthcare IT Provider Market Volume (K Unit) Forecast, by Application 2019 & 2032
- Table 41: Australia Healthcare IT Provider Market Revenue (Million) Forecast, by Application 2019 & 2032
- Table 42: Australia Healthcare IT Provider Market Volume (K Unit) Forecast, by Application 2019 & 2032
- Table 43: South Korea Healthcare IT Provider Market Revenue (Million) Forecast, by Application 2019 & 2032
- Table 44: South Korea Healthcare IT Provider Market Volume (K Unit) Forecast, by Application 2019 & 2032
- Table 45: Rest of Asia Pacific Healthcare IT Provider Market Revenue (Million) Forecast, by Application 2019 & 2032
- Table 46: Rest of Asia Pacific Healthcare IT Provider Market Volume (K Unit) Forecast, by Application 2019 & 2032
- Table 47: Global Healthcare IT Provider Market Revenue Million Forecast, by Country 2019 & 2032
- Table 48: Global Healthcare IT Provider Market Volume K Unit Forecast, by Country 2019 & 2032
- Table 49: GCC Healthcare IT Provider Market Revenue (Million) Forecast, by Application 2019 & 2032
- Table 50: GCC Healthcare IT Provider Market Volume (K Unit) Forecast, by Application 2019 & 2032
- Table 51: South Africa Healthcare IT Provider Market Revenue (Million) Forecast, by Application 2019 & 2032
- Table 52: South Africa Healthcare IT Provider Market Volume (K Unit) Forecast, by Application 2019 & 2032
- Table 53: Rest of Middle East and Africa Healthcare IT Provider Market Revenue (Million) Forecast, by Application 2019 & 2032
- Table 54: Rest of Middle East and Africa Healthcare IT Provider Market Volume (K Unit) Forecast, by Application 2019 & 2032
- Table 55: Global Healthcare IT Provider Market Revenue Million Forecast, by Country 2019 & 2032
- Table 56: Global Healthcare IT Provider Market Volume K Unit Forecast, by Country 2019 & 2032
- Table 57: Brazil Healthcare IT Provider Market Revenue (Million) Forecast, by Application 2019 & 2032
- Table 58: Brazil Healthcare IT Provider Market Volume (K Unit) Forecast, by Application 2019 & 2032
- Table 59: Argentina Healthcare IT Provider Market Revenue (Million) Forecast, by Application 2019 & 2032
- Table 60: Argentina Healthcare IT Provider Market Volume (K Unit) Forecast, by Application 2019 & 2032
- Table 61: Rest of South America Healthcare IT Provider Market Revenue (Million) Forecast, by Application 2019 & 2032
- Table 62: Rest of South America Healthcare IT Provider Market Volume (K Unit) Forecast, by Application 2019 & 2032
- Table 63: Global Healthcare IT Provider Market Revenue Million Forecast, by Business Segment 2019 & 2032
- Table 64: Global Healthcare IT Provider Market Volume K Unit Forecast, by Business Segment 2019 & 2032
- Table 65: Global Healthcare IT Provider Market Revenue Million Forecast, by Component 2019 & 2032
- Table 66: Global Healthcare IT Provider Market Volume K Unit Forecast, by Component 2019 & 2032
- Table 67: Global Healthcare IT Provider Market Revenue Million Forecast, by Delivery Mode 2019 & 2032
- Table 68: Global Healthcare IT Provider Market Volume K Unit Forecast, by Delivery Mode 2019 & 2032
- Table 69: Global Healthcare IT Provider Market Revenue Million Forecast, by Country 2019 & 2032
- Table 70: Global Healthcare IT Provider Market Volume K Unit Forecast, by Country 2019 & 2032
- Table 71: United States Healthcare IT Provider Market Revenue (Million) Forecast, by Application 2019 & 2032
- Table 72: United States Healthcare IT Provider Market Volume (K Unit) Forecast, by Application 2019 & 2032
- Table 73: Canada Healthcare IT Provider Market Revenue (Million) Forecast, by Application 2019 & 2032
- Table 74: Canada Healthcare IT Provider Market Volume (K Unit) Forecast, by Application 2019 & 2032
- Table 75: Mexico Healthcare IT Provider Market Revenue (Million) Forecast, by Application 2019 & 2032
- Table 76: Mexico Healthcare IT Provider Market Volume (K Unit) Forecast, by Application 2019 & 2032
- Table 77: Global Healthcare IT Provider Market Revenue Million Forecast, by Business Segment 2019 & 2032
- Table 78: Global Healthcare IT Provider Market Volume K Unit Forecast, by Business Segment 2019 & 2032
- Table 79: Global Healthcare IT Provider Market Revenue Million Forecast, by Component 2019 & 2032
- Table 80: Global Healthcare IT Provider Market Volume K Unit Forecast, by Component 2019 & 2032
- Table 81: Global Healthcare IT Provider Market Revenue Million Forecast, by Delivery Mode 2019 & 2032
- Table 82: Global Healthcare IT Provider Market Volume K Unit Forecast, by Delivery Mode 2019 & 2032
- Table 83: Global Healthcare IT Provider Market Revenue Million Forecast, by Country 2019 & 2032
- Table 84: Global Healthcare IT Provider Market Volume K Unit Forecast, by Country 2019 & 2032
- Table 85: Germany Healthcare IT Provider Market Revenue (Million) Forecast, by Application 2019 & 2032
- Table 86: Germany Healthcare IT Provider Market Volume (K Unit) Forecast, by Application 2019 & 2032
- Table 87: United Kingdom Healthcare IT Provider Market Revenue (Million) Forecast, by Application 2019 & 2032
- Table 88: United Kingdom Healthcare IT Provider Market Volume (K Unit) Forecast, by Application 2019 & 2032
- Table 89: France Healthcare IT Provider Market Revenue (Million) Forecast, by Application 2019 & 2032
- Table 90: France Healthcare IT Provider Market Volume (K Unit) Forecast, by Application 2019 & 2032
- Table 91: Italy Healthcare IT Provider Market Revenue (Million) Forecast, by Application 2019 & 2032
- Table 92: Italy Healthcare IT Provider Market Volume (K Unit) Forecast, by Application 2019 & 2032
- Table 93: Spain Healthcare IT Provider Market Revenue (Million) Forecast, by Application 2019 & 2032
- Table 94: Spain Healthcare IT Provider Market Volume (K Unit) Forecast, by Application 2019 & 2032
- Table 95: Rest of Europe Healthcare IT Provider Market Revenue (Million) Forecast, by Application 2019 & 2032
- Table 96: Rest of Europe Healthcare IT Provider Market Volume (K Unit) Forecast, by Application 2019 & 2032
- Table 97: Global Healthcare IT Provider Market Revenue Million Forecast, by Business Segment 2019 & 2032
- Table 98: Global Healthcare IT Provider Market Volume K Unit Forecast, by Business Segment 2019 & 2032
- Table 99: Global Healthcare IT Provider Market Revenue Million Forecast, by Component 2019 & 2032
- Table 100: Global Healthcare IT Provider Market Volume K Unit Forecast, by Component 2019 & 2032
- Table 101: Global Healthcare IT Provider Market Revenue Million Forecast, by Delivery Mode 2019 & 2032
- Table 102: Global Healthcare IT Provider Market Volume K Unit Forecast, by Delivery Mode 2019 & 2032
- Table 103: Global Healthcare IT Provider Market Revenue Million Forecast, by Country 2019 & 2032
- Table 104: Global Healthcare IT Provider Market Volume K Unit Forecast, by Country 2019 & 2032
- Table 105: China Healthcare IT Provider Market Revenue (Million) Forecast, by Application 2019 & 2032
- Table 106: China Healthcare IT Provider Market Volume (K Unit) Forecast, by Application 2019 & 2032
- Table 107: Japan Healthcare IT Provider Market Revenue (Million) Forecast, by Application 2019 & 2032
- Table 108: Japan Healthcare IT Provider Market Volume (K Unit) Forecast, by Application 2019 & 2032
- Table 109: India Healthcare IT Provider Market Revenue (Million) Forecast, by Application 2019 & 2032
- Table 110: India Healthcare IT Provider Market Volume (K Unit) Forecast, by Application 2019 & 2032
- Table 111: Australia Healthcare IT Provider Market Revenue (Million) Forecast, by Application 2019 & 2032
- Table 112: Australia Healthcare IT Provider Market Volume (K Unit) Forecast, by Application 2019 & 2032
- Table 113: South Korea Healthcare IT Provider Market Revenue (Million) Forecast, by Application 2019 & 2032
- Table 114: South Korea Healthcare IT Provider Market Volume (K Unit) Forecast, by Application 2019 & 2032
- Table 115: Rest of Asia Pacific Healthcare IT Provider Market Revenue (Million) Forecast, by Application 2019 & 2032
- Table 116: Rest of Asia Pacific Healthcare IT Provider Market Volume (K Unit) Forecast, by Application 2019 & 2032
- Table 117: Global Healthcare IT Provider Market Revenue Million Forecast, by Business Segment 2019 & 2032
- Table 118: Global Healthcare IT Provider Market Volume K Unit Forecast, by Business Segment 2019 & 2032
- Table 119: Global Healthcare IT Provider Market Revenue Million Forecast, by Component 2019 & 2032
- Table 120: Global Healthcare IT Provider Market Volume K Unit Forecast, by Component 2019 & 2032
- Table 121: Global Healthcare IT Provider Market Revenue Million Forecast, by Delivery Mode 2019 & 2032
- Table 122: Global Healthcare IT Provider Market Volume K Unit Forecast, by Delivery Mode 2019 & 2032
- Table 123: Global Healthcare IT Provider Market Revenue Million Forecast, by Country 2019 & 2032
- Table 124: Global Healthcare IT Provider Market Volume K Unit Forecast, by Country 2019 & 2032
- Table 125: GCC Healthcare IT Provider Market Revenue (Million) Forecast, by Application 2019 & 2032
- Table 126: GCC Healthcare IT Provider Market Volume (K Unit) Forecast, by Application 2019 & 2032
- Table 127: South Africa Healthcare IT Provider Market Revenue (Million) Forecast, by Application 2019 & 2032
- Table 128: South Africa Healthcare IT Provider Market Volume (K Unit) Forecast, by Application 2019 & 2032
- Table 129: Rest of Middle East and Africa Healthcare IT Provider Market Revenue (Million) Forecast, by Application 2019 & 2032
- Table 130: Rest of Middle East and Africa Healthcare IT Provider Market Volume (K Unit) Forecast, by Application 2019 & 2032
- Table 131: Global Healthcare IT Provider Market Revenue Million Forecast, by Business Segment 2019 & 2032
- Table 132: Global Healthcare IT Provider Market Volume K Unit Forecast, by Business Segment 2019 & 2032
- Table 133: Global Healthcare IT Provider Market Revenue Million Forecast, by Component 2019 & 2032
- Table 134: Global Healthcare IT Provider Market Volume K Unit Forecast, by Component 2019 & 2032
- Table 135: Global Healthcare IT Provider Market Revenue Million Forecast, by Delivery Mode 2019 & 2032
- Table 136: Global Healthcare IT Provider Market Volume K Unit Forecast, by Delivery Mode 2019 & 2032
- Table 137: Global Healthcare IT Provider Market Revenue Million Forecast, by Country 2019 & 2032
- Table 138: Global Healthcare IT Provider Market Volume K Unit Forecast, by Country 2019 & 2032
- Table 139: Brazil Healthcare IT Provider Market Revenue (Million) Forecast, by Application 2019 & 2032
- Table 140: Brazil Healthcare IT Provider Market Volume (K Unit) Forecast, by Application 2019 & 2032
- Table 141: Argentina Healthcare IT Provider Market Revenue (Million) Forecast, by Application 2019 & 2032
- Table 142: Argentina Healthcare IT Provider Market Volume (K Unit) Forecast, by Application 2019 & 2032
- Table 143: Rest of South America Healthcare IT Provider Market Revenue (Million) Forecast, by Application 2019 & 2032
- Table 144: Rest of South America Healthcare IT Provider Market Volume (K Unit) Forecast, by Application 2019 & 2032
Frequently Asked Questions
1. What is the projected Compound Annual Growth Rate (CAGR) of the Healthcare IT Provider Market?
The projected CAGR is approximately 13.50%.
2. Which companies are prominent players in the Healthcare IT Provider Market?
Key companies in the market include SAS Institute Inc, Mckesson Corporation, Oracle (Cerner Corporation), Epic Systems Corporation, IBM Corporation, Siemens Healthineers, 3M, Wipro, General Electric Company (GE Healthcare), Koninklijke Philips NV, Optum Inc , Allscripts Healthcare Solutions Inc.
3. What are the main segments of the Healthcare IT Provider Market?
The market segments include Business Segment, Component, Delivery Mode.
4. Can you provide details about the market size?
The market size is estimated to be USD XX Million as of 2022.
5. What are some drivers contributing to market growth?
Rise in the Demand for Paper-less Technology; Emergence of Social Media and its Impact on the Healthcare IT Industry; Increased Government Funding on Healthcare Services and Infrastructure.
6. What are the notable trends driving market growth?
Clinical Decision Support System (CDSS) Segment Expected to Drive the Market.
7. Are there any restraints impacting market growth?
Lack of Skilled Labor; High Maintenance Costs.
8. Can you provide examples of recent developments in the market?
December 2022: Charles River Community Health (CRCH) transitioned to the Epic Electronic Health Records (EHR) system. Epic will likely provide patients with improved care and access to a new online patient portal.
9. What pricing options are available for accessing the report?
Pricing options include single-user, multi-user, and enterprise licenses priced at USD 4750, USD 5250, and USD 8750 respectively.
10. Is the market size provided in terms of value or volume?
The market size is provided in terms of value, measured in Million and volume, measured in K Unit.
11. Are there any specific market keywords associated with the report?
Yes, the market keyword associated with the report is "Healthcare IT Provider Market," which aids in identifying and referencing the specific market segment covered.
12. How do I determine which pricing option suits my needs best?
The pricing options vary based on user requirements and access needs. Individual users may opt for single-user licenses, while businesses requiring broader access may choose multi-user or enterprise licenses for cost-effective access to the report.
13. Are there any additional resources or data provided in the Healthcare IT Provider Market report?
While the report offers comprehensive insights, it's advisable to review the specific contents or supplementary materials provided to ascertain if additional resources or data are available.
14. How can I stay updated on further developments or reports in the Healthcare IT Provider Market?
To stay informed about further developments, trends, and reports in the Healthcare IT Provider Market, consider subscribing to industry newsletters, following relevant companies and organizations, or regularly checking reputable industry news sources and publications.
Methodology
Step 1 - Identification of Relevant Samples Size from Population Database


Step 2 - Approaches for Defining Global Market Size (Value, Volume* & Price*)

Note*: In applicable scenarios
Step 3 - Data Sources
Primary Research
- Web Analytics
- Survey Reports
- Research Institute
- Latest Research Reports
- Opinion Leaders
Secondary Research
- Annual Reports
- White Paper
- Latest Press Release
- Industry Association
- Paid Database
- Investor Presentations

Step 4 - Data Triangulation
Involves using different sources of information in order to increase the validity of a study
These sources are likely to be stakeholders in a program - participants, other researchers, program staff, other community members, and so on.
Then we put all data in single framework & apply various statistical tools to find out the dynamic on the market.
During the analysis stage, feedback from the stakeholder groups would be compared to determine areas of agreement as well as areas of divergence


