
Key Insights
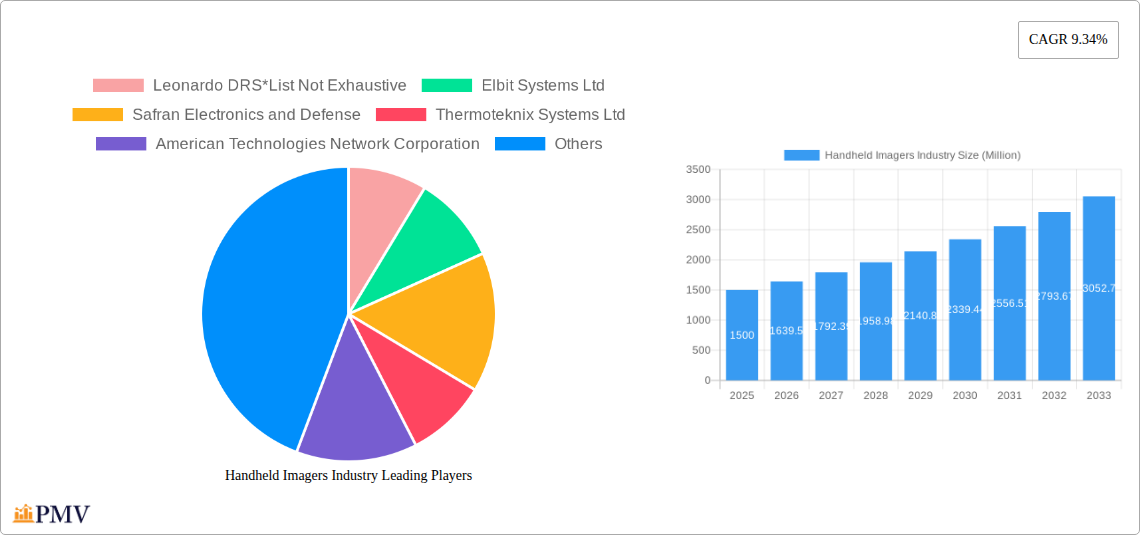
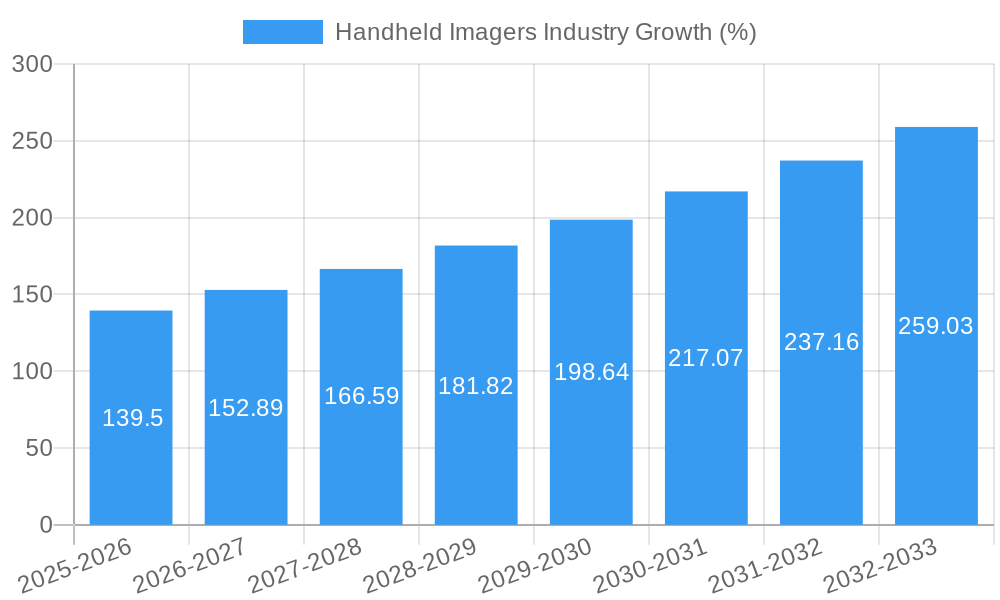
The global handheld imagers market is experiencing robust growth, projected to reach a substantial size by 2033, driven by a compound annual growth rate (CAGR) of 9.34% from 2025 to 2033. This expansion is fueled by several key factors. Increasing demand from the defense and public safety sectors for advanced surveillance and reconnaissance capabilities is a significant driver. Furthermore, the industrial sector, particularly oil and gas and utilities, is adopting handheld imagers for predictive maintenance, leak detection, and improved operational efficiency, contributing significantly to market growth. Technological advancements, including improved sensor technology leading to higher resolution and thermal sensitivity, along with miniaturization and enhanced user-friendliness, are further propelling adoption across diverse applications. The market is segmented by end-user industry, with defense, public safety, and industrial sectors dominating. Leading companies like Leonardo DRS, Elbit Systems Ltd., and FLIR Systems Inc. are driving innovation and competition, shaping the market landscape with their diverse product portfolios and strategic partnerships. While the market faces certain restraints, such as high initial investment costs and the need for specialized training, the overall positive growth trajectory is expected to continue throughout the forecast period.
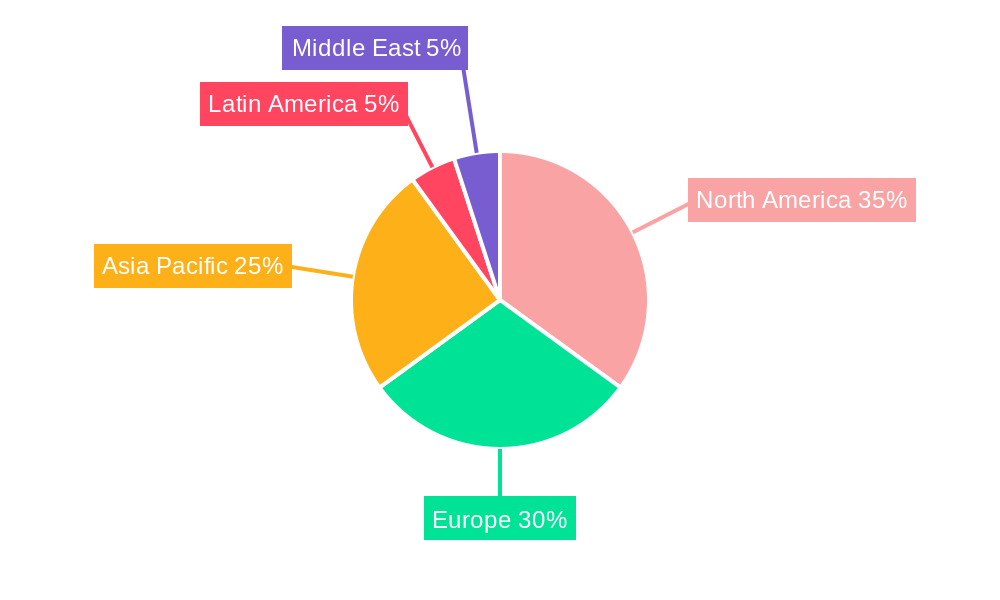
The regional distribution of the market shows a strong presence across North America, Europe, and Asia Pacific. North America is expected to maintain a significant market share due to the high adoption rate of advanced technologies in the defense and industrial sectors. Europe also exhibits considerable growth potential, driven by increasing security concerns and substantial investments in public safety infrastructure. Asia Pacific is experiencing rapid expansion, fueled by rising industrialization and urbanization, creating a large market for handheld imagers across diverse applications. The competitive landscape is dynamic, with both established players and emerging companies vying for market share through product innovation, strategic acquisitions, and partnerships. The market's future growth hinges on sustained technological advancements, increasing government investments in security and infrastructure, and the ongoing adoption of handheld imagers across diverse industrial and commercial applications. This growth is further expected to be propelled by the development of more affordable and user-friendly devices, widening the potential market and accelerating adoption.
Handheld Imagers Industry Market Report: 2019-2033
This comprehensive report provides an in-depth analysis of the global handheld imagers market, offering valuable insights for industry stakeholders, investors, and researchers. Covering the period from 2019 to 2033, with a focus on 2025, this report meticulously examines market structure, competitive dynamics, technological advancements, and future growth potential. The market size is projected to reach xx Million by 2033, exhibiting a CAGR of xx% during the forecast period (2025-2033).
Handheld Imagers Industry Market Structure & Competitive Dynamics
This section analyzes the competitive landscape of the handheld imagers market, examining market concentration, innovation ecosystems, regulatory frameworks, and key industry trends. The market is characterized by a moderately concentrated structure, with several major players holding significant market share. However, the presence of numerous smaller, specialized companies fosters a dynamic and innovative environment.
- Market Concentration: The top five companies (Leonardo DRS, Elbit Systems Ltd, Safran Electronics and Defense, Raytheon Company, and Thales Group) collectively hold an estimated xx% market share in 2025, indicating a moderately consolidated market.
- Innovation Ecosystems: Significant R&D investments by key players drive continuous innovation in sensor technology, image processing, and software integration, leading to improved image quality, enhanced functionalities, and miniaturization.
- Regulatory Frameworks: Government regulations related to defense and security applications significantly influence the market, shaping technological advancements and product adoption. Export controls and cybersecurity standards also impact market dynamics.
- Product Substitutes: The market faces competition from alternative technologies, including advanced visual aids and other remote sensing methods. However, the unique advantages of handheld imagers in terms of portability, real-time imaging, and cost-effectiveness maintain its strong market position.
- M&A Activities: The industry has witnessed several mergers and acquisitions in recent years, with deal values ranging from xx Million to xx Million. These activities aim to expand product portfolios, enhance technological capabilities, and strengthen market presence. Consolidation is expected to continue in the forecast period.
- End-User Trends: The growing demand for enhanced situational awareness across various sectors—defense, public safety, and industrial applications—is a significant growth driver. Increased adoption of thermal imaging for condition monitoring and predictive maintenance in industrial settings is particularly notable.
Handheld Imagers Industry Industry Trends & Insights
The handheld imagers market is experiencing robust growth, driven by several key factors. Technological advancements, such as the development of higher-resolution sensors and improved image processing algorithms, are improving image quality and expanding application possibilities. The increasing adoption of handheld imagers in diverse sectors fuels market expansion. The rising need for security and surveillance solutions across various applications further contributes to market growth. The market is also witnessing a shift towards the adoption of advanced features like improved battery life, enhanced connectivity, and integrated software functionalities. The increasing demand for lighter and smaller imagers drives innovation and technological advancements. The global handheld imagers market is anticipated to reach xx Million by 2033, registering a CAGR of xx% during the forecast period (2025-2033). Market penetration in certain sectors, such as public safety, is expected to increase significantly by xx% over the forecast period.
Dominant Markets & Segments in Handheld Imagers Industry
The defense segment dominates the handheld imagers market, accounting for the largest market share in 2025, driven by substantial government spending on defense and security applications. North America and Europe are the leading regions, exhibiting strong growth due to technological advancements and robust defense budgets.
- Defense:
- Key Drivers: High defense spending, increasing demand for night vision and surveillance technologies, and ongoing geopolitical instability.
- Dominance Analysis: The high demand for superior imaging capabilities for military and homeland security applications fuels significant market growth in this segment.
- Public Safety:
- Key Drivers: Growing need for enhanced situational awareness, improved law enforcement capabilities, and disaster response effectiveness.
- Dominance Analysis: Increasing adoption of thermal imaging for search and rescue operations, crime scene investigations, and border security drives market expansion.
- Industrial (Oil and Gas, Utility, etc.):
- Key Drivers: Rising need for predictive maintenance, improved safety measures, and efficient infrastructure management.
- Dominance Analysis: Thermal imaging aids in detecting equipment malfunctions, preventing costly downtime, and ensuring efficient operations in diverse industrial settings.
- Other End-user Industries:
- Key Drivers: Emerging applications in sectors such as healthcare, construction, and agriculture, which are increasingly adopting handheld imagers for specific tasks.
- Dominance Analysis: The diverse applicability of handheld imagers is driving gradual growth in this segment.
Handheld Imagers Industry Product Innovations
Recent innovations in handheld imagers include the development of smaller, lighter, and more energy-efficient devices. Advancements in sensor technology are improving image resolution and clarity, while improved image processing algorithms enhance image quality and functionality. Integration of advanced features, such as wireless connectivity and GPS capabilities, enhances situational awareness and data management. These improvements are expanding the applications of handheld imagers across diverse sectors and driving market growth.
Report Segmentation & Scope
This report segments the handheld imagers market by end-user industry:
- Defense: This segment encompasses military and homeland security applications, emphasizing high-performance thermal imaging for night vision, surveillance, and target acquisition. The market is expected to grow at a CAGR of xx% during the forecast period, driven by robust government spending on defense modernization and technological advancements.
- Public Safety: This segment focuses on applications for law enforcement, fire departments, emergency medical services, and search and rescue operations. The market is projected to experience a CAGR of xx%, driven by increasing demand for enhanced situational awareness and safety measures.
- Industrial (Oil and Gas, Utility, etc.): This segment includes applications for predictive maintenance, infrastructure inspection, and condition monitoring in various industrial sectors. The market growth is anticipated at a CAGR of xx%, fueled by the growing adoption of thermal imaging for preventative maintenance and safety enhancements.
- Other End-user Industries: This segment encompasses diverse applications in sectors such as healthcare, construction, agriculture, and others, with growth expected at a CAGR of xx%.
Key Drivers of Handheld Imagers Industry Growth
The handheld imagers market is experiencing significant growth driven by several key factors:
- Technological Advancements: The continuous improvement in sensor technology, image processing, and miniaturization leads to enhanced image quality, increased functionality, and improved user experience.
- Increased Demand for Security and Surveillance: The growing concerns over security and safety are driving demand for handheld imagers in various sectors.
- Rising Adoption in Industrial Applications: The use of handheld imagers for predictive maintenance and process optimization is expanding in industrial settings, thus contributing to market growth.
Challenges in the Handheld Imagers Industry Sector
Despite the strong growth potential, the handheld imagers market faces several challenges:
- High Initial Investment Costs: The high cost of acquisition can hinder adoption in certain sectors with limited budgets.
- Technological Complexity: The complex technology behind thermal imaging requires specialized expertise and training.
- Stringent Regulatory Standards: Compliance with stringent safety and export regulations can increase production costs and limit market access.
Leading Players in the Handheld Imagers Industry Market
- Leonardo DRS
- Elbit Systems Ltd
- Safran Electronics and Defense
- Thermoteknix Systems Ltd
- American Technologies Network Corporation
- Raytheon Company
- Thales Group
- BAE Systems PLC
- Seek Thermal Inc
- Fluke Corporation
- Flir Systems Inc
Key Developments in Handheld Imagers Industry Sector
- 2023: Launch of a new high-resolution thermal imager by Flir Systems.
- 2022: Acquisition of a smaller thermal imaging company by Leonardo DRS.
- 2021: Introduction of a new software suite enhancing image analysis capabilities by Elbit Systems.
Further specific developments will be detailed in the full report.
Strategic Handheld Imagers Industry Market Outlook
The handheld imagers market presents significant growth opportunities in the coming years, driven by technological advancements, increasing demand from diverse sectors, and ongoing investments in R&D. Strategic partnerships and acquisitions are expected to play a key role in shaping market dynamics. Companies focusing on innovation, product diversification, and expanding into new market segments will be well-positioned to capitalize on the growth potential. The market is poised for sustained expansion, offering attractive investment opportunities for both established players and new entrants.
Handheld Imagers Industry Segmentation
-
1. End-user Industry
- 1.1. Defence
- 1.2. Public Safety
- 1.3. Industrial (Oil and Gas, Utility, etc.)
- 1.4. Other End-user Industries
Handheld Imagers Industry Segmentation By Geography
- 1. North America
- 2. Europe
- 3. Asia Pacific
- 4. Latin America
- 5. Middle East
Handheld Imagers Industry REPORT HIGHLIGHTS
| Aspects | Details |
|---|---|
| Study Period | 2019-2033 |
| Base Year | 2024 |
| Estimated Year | 2025 |
| Forecast Period | 2025-2033 |
| Historical Period | 2019-2024 |
| Growth Rate | CAGR of 9.34% from 2019-2033 |
| Segmentation |
|
Table of Contents
- 1. Introduction
- 1.1. Research Scope
- 1.2. Market Segmentation
- 1.3. Research Methodology
- 1.4. Definitions and Assumptions
- 2. Executive Summary
- 2.1. Introduction
- 3. Market Dynamics
- 3.1. Introduction
- 3.2. Market Drivers
- 3.2.1. ; Increasing Application Across Various Sectors
- 3.3. Market Restrains
- 3.3.1. ; Higher Device Cost
- 3.4. Market Trends
- 3.4.1. Aerospace and Defense Sector Offers Potential Growth
- 4. Market Factor Analysis
- 4.1. Porters Five Forces
- 4.2. Supply/Value Chain
- 4.3. PESTEL analysis
- 4.4. Market Entropy
- 4.5. Patent/Trademark Analysis
- 5. Global Handheld Imagers Industry Analysis, Insights and Forecast, 2019-2031
- 5.1. Market Analysis, Insights and Forecast - by End-user Industry
- 5.1.1. Defence
- 5.1.2. Public Safety
- 5.1.3. Industrial (Oil and Gas, Utility, etc.)
- 5.1.4. Other End-user Industries
- 5.2. Market Analysis, Insights and Forecast - by Region
- 5.2.1. North America
- 5.2.2. Europe
- 5.2.3. Asia Pacific
- 5.2.4. Latin America
- 5.2.5. Middle East
- 5.1. Market Analysis, Insights and Forecast - by End-user Industry
- 6. North America Handheld Imagers Industry Analysis, Insights and Forecast, 2019-2031
- 6.1. Market Analysis, Insights and Forecast - by End-user Industry
- 6.1.1. Defence
- 6.1.2. Public Safety
- 6.1.3. Industrial (Oil and Gas, Utility, etc.)
- 6.1.4. Other End-user Industries
- 6.1. Market Analysis, Insights and Forecast - by End-user Industry
- 7. Europe Handheld Imagers Industry Analysis, Insights and Forecast, 2019-2031
- 7.1. Market Analysis, Insights and Forecast - by End-user Industry
- 7.1.1. Defence
- 7.1.2. Public Safety
- 7.1.3. Industrial (Oil and Gas, Utility, etc.)
- 7.1.4. Other End-user Industries
- 7.1. Market Analysis, Insights and Forecast - by End-user Industry
- 8. Asia Pacific Handheld Imagers Industry Analysis, Insights and Forecast, 2019-2031
- 8.1. Market Analysis, Insights and Forecast - by End-user Industry
- 8.1.1. Defence
- 8.1.2. Public Safety
- 8.1.3. Industrial (Oil and Gas, Utility, etc.)
- 8.1.4. Other End-user Industries
- 8.1. Market Analysis, Insights and Forecast - by End-user Industry
- 9. Latin America Handheld Imagers Industry Analysis, Insights and Forecast, 2019-2031
- 9.1. Market Analysis, Insights and Forecast - by End-user Industry
- 9.1.1. Defence
- 9.1.2. Public Safety
- 9.1.3. Industrial (Oil and Gas, Utility, etc.)
- 9.1.4. Other End-user Industries
- 9.1. Market Analysis, Insights and Forecast - by End-user Industry
- 10. Middle East Handheld Imagers Industry Analysis, Insights and Forecast, 2019-2031
- 10.1. Market Analysis, Insights and Forecast - by End-user Industry
- 10.1.1. Defence
- 10.1.2. Public Safety
- 10.1.3. Industrial (Oil and Gas, Utility, etc.)
- 10.1.4. Other End-user Industries
- 10.1. Market Analysis, Insights and Forecast - by End-user Industry
- 11. North America Handheld Imagers Industry Analysis, Insights and Forecast, 2019-2031
- 11.1. Market Analysis, Insights and Forecast - By Country/Sub-region
- 11.1.1.
- 12. Europe Handheld Imagers Industry Analysis, Insights and Forecast, 2019-2031
- 12.1. Market Analysis, Insights and Forecast - By Country/Sub-region
- 12.1.1.
- 13. Asia Pacific Handheld Imagers Industry Analysis, Insights and Forecast, 2019-2031
- 13.1. Market Analysis, Insights and Forecast - By Country/Sub-region
- 13.1.1.
- 14. Latin America Handheld Imagers Industry Analysis, Insights and Forecast, 2019-2031
- 14.1. Market Analysis, Insights and Forecast - By Country/Sub-region
- 14.1.1.
- 15. Middle East Handheld Imagers Industry Analysis, Insights and Forecast, 2019-2031
- 15.1. Market Analysis, Insights and Forecast - By Country/Sub-region
- 15.1.1.
- 16. Competitive Analysis
- 16.1. Global Market Share Analysis 2024
- 16.2. Company Profiles
- 16.2.1 Leonardo DRS*List Not Exhaustive
- 16.2.1.1. Overview
- 16.2.1.2. Products
- 16.2.1.3. SWOT Analysis
- 16.2.1.4. Recent Developments
- 16.2.1.5. Financials (Based on Availability)
- 16.2.2 Elbit Systems Ltd
- 16.2.2.1. Overview
- 16.2.2.2. Products
- 16.2.2.3. SWOT Analysis
- 16.2.2.4. Recent Developments
- 16.2.2.5. Financials (Based on Availability)
- 16.2.3 Safran Electronics and Defense
- 16.2.3.1. Overview
- 16.2.3.2. Products
- 16.2.3.3. SWOT Analysis
- 16.2.3.4. Recent Developments
- 16.2.3.5. Financials (Based on Availability)
- 16.2.4 Thermoteknix Systems Ltd
- 16.2.4.1. Overview
- 16.2.4.2. Products
- 16.2.4.3. SWOT Analysis
- 16.2.4.4. Recent Developments
- 16.2.4.5. Financials (Based on Availability)
- 16.2.5 American Technologies Network Corporation
- 16.2.5.1. Overview
- 16.2.5.2. Products
- 16.2.5.3. SWOT Analysis
- 16.2.5.4. Recent Developments
- 16.2.5.5. Financials (Based on Availability)
- 16.2.6 Raytheon Company
- 16.2.6.1. Overview
- 16.2.6.2. Products
- 16.2.6.3. SWOT Analysis
- 16.2.6.4. Recent Developments
- 16.2.6.5. Financials (Based on Availability)
- 16.2.7 Thales Group
- 16.2.7.1. Overview
- 16.2.7.2. Products
- 16.2.7.3. SWOT Analysis
- 16.2.7.4. Recent Developments
- 16.2.7.5. Financials (Based on Availability)
- 16.2.8 BAE Systems PLC
- 16.2.8.1. Overview
- 16.2.8.2. Products
- 16.2.8.3. SWOT Analysis
- 16.2.8.4. Recent Developments
- 16.2.8.5. Financials (Based on Availability)
- 16.2.9 Seek Thermal Inc
- 16.2.9.1. Overview
- 16.2.9.2. Products
- 16.2.9.3. SWOT Analysis
- 16.2.9.4. Recent Developments
- 16.2.9.5. Financials (Based on Availability)
- 16.2.10 Fluke Corporation
- 16.2.10.1. Overview
- 16.2.10.2. Products
- 16.2.10.3. SWOT Analysis
- 16.2.10.4. Recent Developments
- 16.2.10.5. Financials (Based on Availability)
- 16.2.11 Flir Systems Inc
- 16.2.11.1. Overview
- 16.2.11.2. Products
- 16.2.11.3. SWOT Analysis
- 16.2.11.4. Recent Developments
- 16.2.11.5. Financials (Based on Availability)
- 16.2.1 Leonardo DRS*List Not Exhaustive
List of Figures
- Figure 1: Global Handheld Imagers Industry Revenue Breakdown (Million, %) by Region 2024 & 2032
- Figure 2: North America Handheld Imagers Industry Revenue (Million), by Country 2024 & 2032
- Figure 3: North America Handheld Imagers Industry Revenue Share (%), by Country 2024 & 2032
- Figure 4: Europe Handheld Imagers Industry Revenue (Million), by Country 2024 & 2032
- Figure 5: Europe Handheld Imagers Industry Revenue Share (%), by Country 2024 & 2032
- Figure 6: Asia Pacific Handheld Imagers Industry Revenue (Million), by Country 2024 & 2032
- Figure 7: Asia Pacific Handheld Imagers Industry Revenue Share (%), by Country 2024 & 2032
- Figure 8: Latin America Handheld Imagers Industry Revenue (Million), by Country 2024 & 2032
- Figure 9: Latin America Handheld Imagers Industry Revenue Share (%), by Country 2024 & 2032
- Figure 10: Middle East Handheld Imagers Industry Revenue (Million), by Country 2024 & 2032
- Figure 11: Middle East Handheld Imagers Industry Revenue Share (%), by Country 2024 & 2032
- Figure 12: North America Handheld Imagers Industry Revenue (Million), by End-user Industry 2024 & 2032
- Figure 13: North America Handheld Imagers Industry Revenue Share (%), by End-user Industry 2024 & 2032
- Figure 14: North America Handheld Imagers Industry Revenue (Million), by Country 2024 & 2032
- Figure 15: North America Handheld Imagers Industry Revenue Share (%), by Country 2024 & 2032
- Figure 16: Europe Handheld Imagers Industry Revenue (Million), by End-user Industry 2024 & 2032
- Figure 17: Europe Handheld Imagers Industry Revenue Share (%), by End-user Industry 2024 & 2032
- Figure 18: Europe Handheld Imagers Industry Revenue (Million), by Country 2024 & 2032
- Figure 19: Europe Handheld Imagers Industry Revenue Share (%), by Country 2024 & 2032
- Figure 20: Asia Pacific Handheld Imagers Industry Revenue (Million), by End-user Industry 2024 & 2032
- Figure 21: Asia Pacific Handheld Imagers Industry Revenue Share (%), by End-user Industry 2024 & 2032
- Figure 22: Asia Pacific Handheld Imagers Industry Revenue (Million), by Country 2024 & 2032
- Figure 23: Asia Pacific Handheld Imagers Industry Revenue Share (%), by Country 2024 & 2032
- Figure 24: Latin America Handheld Imagers Industry Revenue (Million), by End-user Industry 2024 & 2032
- Figure 25: Latin America Handheld Imagers Industry Revenue Share (%), by End-user Industry 2024 & 2032
- Figure 26: Latin America Handheld Imagers Industry Revenue (Million), by Country 2024 & 2032
- Figure 27: Latin America Handheld Imagers Industry Revenue Share (%), by Country 2024 & 2032
- Figure 28: Middle East Handheld Imagers Industry Revenue (Million), by End-user Industry 2024 & 2032
- Figure 29: Middle East Handheld Imagers Industry Revenue Share (%), by End-user Industry 2024 & 2032
- Figure 30: Middle East Handheld Imagers Industry Revenue (Million), by Country 2024 & 2032
- Figure 31: Middle East Handheld Imagers Industry Revenue Share (%), by Country 2024 & 2032
List of Tables
- Table 1: Global Handheld Imagers Industry Revenue Million Forecast, by Region 2019 & 2032
- Table 2: Global Handheld Imagers Industry Revenue Million Forecast, by End-user Industry 2019 & 2032
- Table 3: Global Handheld Imagers Industry Revenue Million Forecast, by Region 2019 & 2032
- Table 4: Global Handheld Imagers Industry Revenue Million Forecast, by Country 2019 & 2032
- Table 5: Handheld Imagers Industry Revenue (Million) Forecast, by Application 2019 & 2032
- Table 6: Global Handheld Imagers Industry Revenue Million Forecast, by Country 2019 & 2032
- Table 7: Handheld Imagers Industry Revenue (Million) Forecast, by Application 2019 & 2032
- Table 8: Global Handheld Imagers Industry Revenue Million Forecast, by Country 2019 & 2032
- Table 9: Handheld Imagers Industry Revenue (Million) Forecast, by Application 2019 & 2032
- Table 10: Global Handheld Imagers Industry Revenue Million Forecast, by Country 2019 & 2032
- Table 11: Handheld Imagers Industry Revenue (Million) Forecast, by Application 2019 & 2032
- Table 12: Global Handheld Imagers Industry Revenue Million Forecast, by Country 2019 & 2032
- Table 13: Handheld Imagers Industry Revenue (Million) Forecast, by Application 2019 & 2032
- Table 14: Global Handheld Imagers Industry Revenue Million Forecast, by End-user Industry 2019 & 2032
- Table 15: Global Handheld Imagers Industry Revenue Million Forecast, by Country 2019 & 2032
- Table 16: Global Handheld Imagers Industry Revenue Million Forecast, by End-user Industry 2019 & 2032
- Table 17: Global Handheld Imagers Industry Revenue Million Forecast, by Country 2019 & 2032
- Table 18: Global Handheld Imagers Industry Revenue Million Forecast, by End-user Industry 2019 & 2032
- Table 19: Global Handheld Imagers Industry Revenue Million Forecast, by Country 2019 & 2032
- Table 20: Global Handheld Imagers Industry Revenue Million Forecast, by End-user Industry 2019 & 2032
- Table 21: Global Handheld Imagers Industry Revenue Million Forecast, by Country 2019 & 2032
- Table 22: Global Handheld Imagers Industry Revenue Million Forecast, by End-user Industry 2019 & 2032
- Table 23: Global Handheld Imagers Industry Revenue Million Forecast, by Country 2019 & 2032
Frequently Asked Questions
1. What is the projected Compound Annual Growth Rate (CAGR) of the Handheld Imagers Industry?
The projected CAGR is approximately 9.34%.
2. Which companies are prominent players in the Handheld Imagers Industry?
Key companies in the market include Leonardo DRS*List Not Exhaustive, Elbit Systems Ltd, Safran Electronics and Defense, Thermoteknix Systems Ltd, American Technologies Network Corporation, Raytheon Company, Thales Group, BAE Systems PLC, Seek Thermal Inc, Fluke Corporation, Flir Systems Inc.
3. What are the main segments of the Handheld Imagers Industry?
The market segments include End-user Industry.
4. Can you provide details about the market size?
The market size is estimated to be USD XX Million as of 2022.
5. What are some drivers contributing to market growth?
; Increasing Application Across Various Sectors.
6. What are the notable trends driving market growth?
Aerospace and Defense Sector Offers Potential Growth.
7. Are there any restraints impacting market growth?
; Higher Device Cost.
8. Can you provide examples of recent developments in the market?
N/A
9. What pricing options are available for accessing the report?
Pricing options include single-user, multi-user, and enterprise licenses priced at USD 4750, USD 5250, and USD 8750 respectively.
10. Is the market size provided in terms of value or volume?
The market size is provided in terms of value, measured in Million.
11. Are there any specific market keywords associated with the report?
Yes, the market keyword associated with the report is "Handheld Imagers Industry," which aids in identifying and referencing the specific market segment covered.
12. How do I determine which pricing option suits my needs best?
The pricing options vary based on user requirements and access needs. Individual users may opt for single-user licenses, while businesses requiring broader access may choose multi-user or enterprise licenses for cost-effective access to the report.
13. Are there any additional resources or data provided in the Handheld Imagers Industry report?
While the report offers comprehensive insights, it's advisable to review the specific contents or supplementary materials provided to ascertain if additional resources or data are available.
14. How can I stay updated on further developments or reports in the Handheld Imagers Industry?
To stay informed about further developments, trends, and reports in the Handheld Imagers Industry, consider subscribing to industry newsletters, following relevant companies and organizations, or regularly checking reputable industry news sources and publications.
Methodology
Step 1 - Identification of Relevant Samples Size from Population Database


Step 2 - Approaches for Defining Global Market Size (Value, Volume* & Price*)

Note*: In applicable scenarios
Step 3 - Data Sources
Primary Research
- Web Analytics
- Survey Reports
- Research Institute
- Latest Research Reports
- Opinion Leaders
Secondary Research
- Annual Reports
- White Paper
- Latest Press Release
- Industry Association
- Paid Database
- Investor Presentations

Step 4 - Data Triangulation
Involves using different sources of information in order to increase the validity of a study
These sources are likely to be stakeholders in a program - participants, other researchers, program staff, other community members, and so on.
Then we put all data in single framework & apply various statistical tools to find out the dynamic on the market.
During the analysis stage, feedback from the stakeholder groups would be compared to determine areas of agreement as well as areas of divergence


