
Key Insights
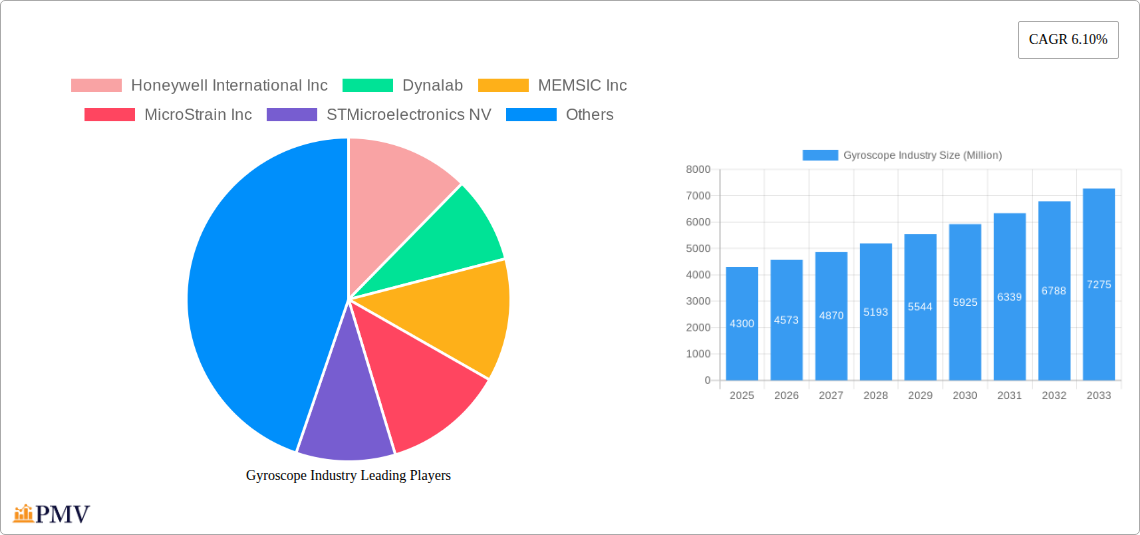
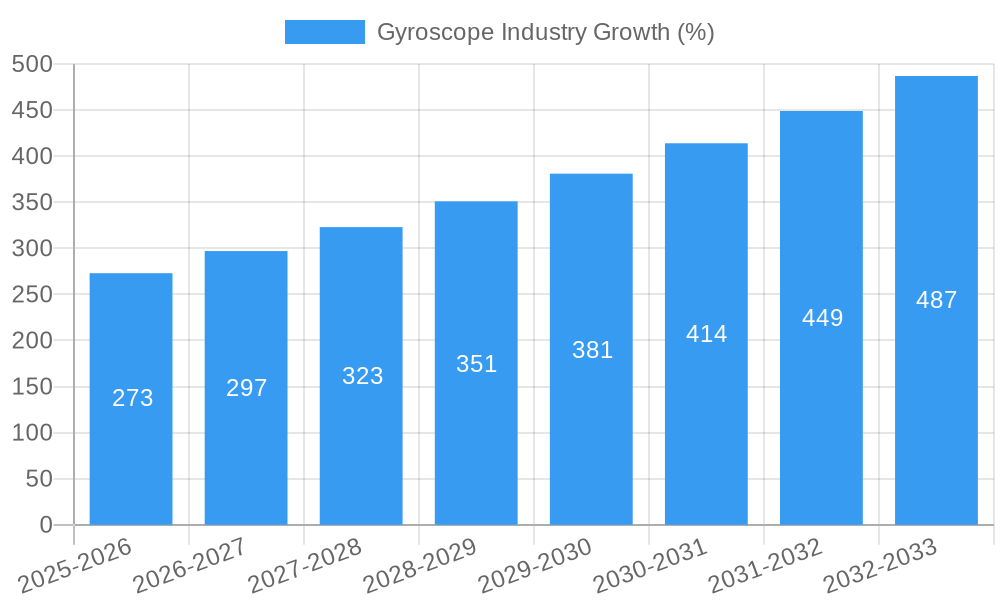
The global gyroscope market, valued at $4.30 billion in 2025, is projected to experience robust growth, driven by a compound annual growth rate (CAGR) of 6.10% from 2025 to 2033. This expansion is fueled by several key factors. Firstly, the burgeoning consumer electronics sector, particularly smartphones, wearables, and virtual reality (VR) devices, necessitates increasingly sophisticated motion sensing capabilities, driving demand for miniaturized and high-precision gyroscopes. Secondly, the automotive industry's transition towards autonomous vehicles and advanced driver-assistance systems (ADAS) is a major catalyst, as gyroscopes are crucial components in navigation, stability control, and collision avoidance systems. The aerospace and defense sector also contributes significantly, with gyroscopes playing a vital role in navigation, guidance, and stabilization systems for aircraft, missiles, and satellites. Technological advancements, such as the development of MEMS gyroscopes offering improved accuracy and reduced costs, further bolster market growth. However, challenges remain, including the high initial investment required for advanced gyroscope technologies and potential supply chain disruptions.
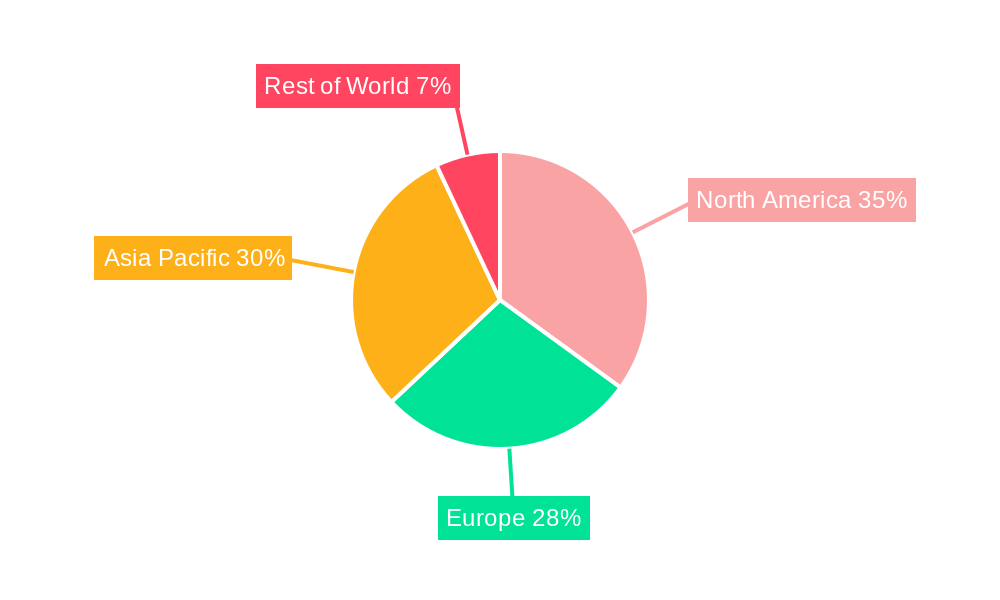
Segment-wise, MEMS gyroscopes currently dominate the market due to their cost-effectiveness and miniaturization potential. However, fiber optic gyroscopes (FOG) and ring laser gyroscopes (RLG) are expected to witness significant growth, driven by their higher accuracy and stability requirements in demanding applications like aerospace and defense. Geographically, North America and Asia-Pacific are currently the leading regions, benefiting from a strong presence of key players and robust technological advancements. Europe is also expected to witness considerable growth, fueled by increasing adoption of advanced technologies in automotive and industrial sectors. The market is highly competitive, with established players like Honeywell International Inc, Robert Bosch GmbH, and STMicroelectronics NV alongside emerging companies continuously innovating and expanding their product offerings. The forecast period (2025-2033) anticipates sustained growth, driven by continued technological advancements, increasing demand from diverse end-user verticals, and the expansion of high-precision gyroscope applications.
Gyroscope Industry Market Report: 2019-2033
This comprehensive report provides a detailed analysis of the global gyroscope industry, encompassing market size, growth projections, competitive landscape, technological advancements, and key industry trends from 2019 to 2033. The report covers various gyroscope technologies and end-user verticals, offering actionable insights for stakeholders across the value chain. With a focus on market segmentation, competitive dynamics, and future growth opportunities, this report is an essential resource for businesses, investors, and researchers seeking to understand and capitalize on the evolving gyroscope market. The study period spans 2019–2033, with 2025 as the base and estimated year. The forecast period is 2025-2033, and the historical period is 2019-2024. The total market size is projected to reach xx Million by 2033.
Gyroscope Industry Market Structure & Competitive Dynamics
The gyroscope industry is characterized by a moderately concentrated market structure, with a few major players holding significant market share. However, the presence of numerous smaller niche players contributes to a dynamic competitive landscape. Honeywell International Inc., Robert Bosch GmbH, and Analog Devices Inc. are among the leading players, collectively holding an estimated xx% of the global market share in 2025. The industry's innovation ecosystem is driven by continuous advancements in MEMS technology, alongside ongoing R&D efforts in FOG, RLG, and HRG gyroscopes. Regulatory frameworks, particularly those related to safety and performance standards in aerospace and automotive applications, significantly influence market dynamics. Product substitutes, such as GPS and other navigation systems, exert competitive pressure, especially in certain end-user segments. End-user trends, particularly the increasing demand for high-precision gyroscopes in autonomous vehicles and drones, are reshaping the industry. M&A activities, while not exceptionally frequent, play a role in consolidating market share and accelerating technological advancements. The total value of M&A deals in the gyroscope industry between 2019 and 2024 is estimated at xx Million.
- Market Concentration: Moderately concentrated, with top 5 players holding xx% market share.
- Innovation Ecosystem: Strong R&D focus on MEMS, FOG, RLG, and HRG technologies.
- Regulatory Frameworks: Stringent safety and performance standards, particularly in aerospace and defense.
- Product Substitutes: GPS and alternative navigation systems pose competitive pressure.
- End-User Trends: Growing demand for high-precision gyroscopes in autonomous vehicles and drones.
- M&A Activities: Moderate activity, with total deal value of xx Million (2019-2024).
Gyroscope Industry Industry Trends & Insights
The gyroscope industry is experiencing robust growth, driven by several key factors. The increasing adoption of autonomous vehicles, drones, and robotics fuels demand for high-precision inertial measurement units (IMUs) incorporating gyroscopes. Technological disruptions, particularly advancements in MEMS gyroscope technology, are leading to smaller, lighter, and more cost-effective devices, broadening their applications. Consumer preferences are shifting toward more sophisticated devices with enhanced accuracy and reliability. Competitive dynamics are characterized by intense innovation and strategic partnerships, fostering market expansion. The global gyroscope market is projected to achieve a compound annual growth rate (CAGR) of xx% during the forecast period (2025-2033), with MEMS gyroscopes exhibiting the highest market penetration rate, currently estimated at xx%. This growth is largely driven by the cost-effectiveness and miniaturization of MEMS technology. The market penetration of FOG and RLG gyroscopes remains high in niche applications demanding extremely high precision, particularly within the aerospace and defense sectors.
Dominant Markets & Segments in Gyroscope Industry
The Aerospace and Defense segment holds a dominant position in the gyroscope market, driven by the stringent requirements for precision and reliability in navigation and guidance systems. This segment's growth is fueled by increasing military expenditure and investments in advanced defense technologies. The Automotive segment displays significant growth potential, propelled by the rising demand for advanced driver-assistance systems (ADAS) and autonomous driving capabilities. The Industrial segment is also a significant contributor, driven by the growing demand for automation and precision control in manufacturing and logistics. Within the technology segment, MEMS gyroscopes are the leading technology, owing to their cost-effectiveness and miniaturization advantages. However, FOG and RLG gyroscopes maintain dominance in applications requiring ultra-high precision, primarily in aerospace and defense.
- Key Drivers of Aerospace and Defense Segment Dominance:
- High demand for precision navigation and guidance systems.
- Increased military spending and technological advancements.
- Stringent safety and performance standards.
- Key Drivers of Automotive Segment Growth:
- Rising demand for ADAS and autonomous driving features.
- Increasing vehicle production and sales globally.
- Government regulations promoting vehicle safety.
- Key Drivers of MEMS Gyroscope Dominance:
- Cost-effectiveness compared to other technologies.
- Miniaturization capabilities.
- Improved performance and reliability over time.
Gyroscope Industry Product Innovations
Recent product innovations reflect a strong trend toward miniaturization, enhanced precision, and improved power efficiency. Companies are focusing on developing smaller, lighter, and more energy-efficient gyroscopes, especially MEMS-based devices, to expand their application range to portable devices, wearables, and other consumer electronics. The development of higher-performance IMUs that integrate gyroscopes with other sensors (such as accelerometers and magnetometers) enhances accuracy and reliability in navigation and motion tracking applications. These improvements are driving greater adoption across various sectors, expanding the market's reach.
Report Segmentation & Scope
This report segments the gyroscope market by technology (MEMS Gyroscope, Fiber Optic Gyroscope (FOG), Ring Laser Gyroscope (RLG), Hemispherical Resonating Gyroscope (HRG), Dynamically Tuned Gyroscopes (DTG), Other Technologies) and by end-user vertical (Consumer Electronics, Automotive, Aerospace and Defense, Industrial, Marine, Other End-user Verticals). Each segment's growth projections, market size, and competitive dynamics are analyzed. MEMS gyroscopes represent the largest segment by technology, driven by cost advantages and miniaturization. The aerospace and defense segment dominates by end-user, reflecting high-precision needs. Significant growth is anticipated in the automotive and consumer electronics segments, fueled by ADAS, autonomous driving, and wearable technology trends.
Key Drivers of Gyroscope Industry Growth
Several key factors are driving growth in the gyroscope industry. Advancements in MEMS technology are leading to smaller, cheaper, and more reliable gyroscopes, expanding their applications. The rising adoption of autonomous vehicles, drones, and robotics increases demand for high-precision inertial measurement units. Government regulations promoting safety and automation in various sectors further stimulate growth. The expanding consumer electronics market and the growing demand for wearable technology contribute to the overall market expansion.
Challenges in the Gyroscope Industry Sector
The gyroscope industry faces several challenges. Competition from alternative navigation technologies, such as GPS, can limit market growth in certain segments. Supply chain disruptions and raw material price fluctuations can impact production costs and profitability. Stringent regulatory requirements and safety standards in certain applications, like aerospace and defense, necessitate significant investment in compliance. These factors collectively impact the overall growth and profitability of the industry.
Leading Players in the Gyroscope Industry Market
- Honeywell International Inc.
- Dynalab
- MEMSIC Inc
- MicroStrain Inc
- STMicroelectronics NV
- Robert Bosch GmbH
- InnaLabs
- Murata Manufacturing Co Ltd
- Analog Devices Inc
- EMCORE Corporation
- Vectornav Technologies LLC
Key Developments in Gyroscope Industry Sector
- October 2023: Honeywell expanded its HGuide industrial navigation portfolio with the HGuide i400 IMU, designed for defense, industrial, and autonomous applications. Its high precision and compact size are significant advancements.
- September 2023: EMCORE Corporation launched the TAC-440 MEMS IMU, the world's smallest 1°/hour IMU, offering a higher-performance replacement for existing Honeywell IMUs.
Strategic Gyroscope Industry Market Outlook
The gyroscope industry is poised for continued growth, driven by technological advancements, increasing demand from various sectors, and favorable regulatory environments. Strategic opportunities exist in developing highly integrated IMUs incorporating advanced sensor fusion technologies. Focusing on miniaturization, cost reduction, and enhanced power efficiency will be crucial for expanding market penetration. Investing in R&D to improve accuracy and reliability, especially in demanding applications like autonomous driving and aerospace, will further solidify market leadership. Strategic partnerships and collaborations can accelerate innovation and market expansion.
Gyroscope Industry Segmentation
-
1. Technology
- 1.1. MEMS Gyroscope
- 1.2. Fiber Optic Gyroscope (FOG)
- 1.3. Ring Laser Gyroscope (RLG)
- 1.4. Hemispherical Resonating Gyroscope (HRG)
- 1.5. Dynamically Tuned Gyroscopes (DTG)
- 1.6. Other Technologies
-
2. End-user Vertical
- 2.1. Consumer Electronics
- 2.2. Automotive
- 2.3. Aerospace and Defense
- 2.4. Industrial
- 2.5. Marine
- 2.6. Other End-user Verticals
Gyroscope Industry Segmentation By Geography
-
1. North America
- 1.1. United States
- 1.2. Canada
-
2. Europe
- 2.1. Germany
- 2.2. United Kingdom
- 2.3. France
-
3. Asia
- 3.1. China
- 3.2. Japan
- 3.3. India
- 4. Australia and New Zealand
- 5. Latin America
- 6. Middle East and Africa
Gyroscope Industry REPORT HIGHLIGHTS
| Aspects | Details |
|---|---|
| Study Period | 2019-2033 |
| Base Year | 2024 |
| Estimated Year | 2025 |
| Forecast Period | 2025-2033 |
| Historical Period | 2019-2024 |
| Growth Rate | CAGR of 6.10% from 2019-2033 |
| Segmentation |
|
Table of Contents
- 1. Introduction
- 1.1. Research Scope
- 1.2. Market Segmentation
- 1.3. Research Methodology
- 1.4. Definitions and Assumptions
- 2. Executive Summary
- 2.1. Introduction
- 3. Market Dynamics
- 3.1. Introduction
- 3.2. Market Drivers
- 3.2.1. Rapid Rise of Unmanned Vehicle in Both Defense and Civilian Applications; Technological Advancements Enabling More Effective Components at a Smaller and Lighter Size
- 3.3. Market Restrains
- 3.3.1. Substantial Increase in Complexity Challenging the Market Demand
- 3.4. Market Trends
- 3.4.1. Automotive to be the Fastest Growing End-user Vertical
- 4. Market Factor Analysis
- 4.1. Porters Five Forces
- 4.2. Supply/Value Chain
- 4.3. PESTEL analysis
- 4.4. Market Entropy
- 4.5. Patent/Trademark Analysis
- 5. Global Gyroscope Industry Analysis, Insights and Forecast, 2019-2031
- 5.1. Market Analysis, Insights and Forecast - by Technology
- 5.1.1. MEMS Gyroscope
- 5.1.2. Fiber Optic Gyroscope (FOG)
- 5.1.3. Ring Laser Gyroscope (RLG)
- 5.1.4. Hemispherical Resonating Gyroscope (HRG)
- 5.1.5. Dynamically Tuned Gyroscopes (DTG)
- 5.1.6. Other Technologies
- 5.2. Market Analysis, Insights and Forecast - by End-user Vertical
- 5.2.1. Consumer Electronics
- 5.2.2. Automotive
- 5.2.3. Aerospace and Defense
- 5.2.4. Industrial
- 5.2.5. Marine
- 5.2.6. Other End-user Verticals
- 5.3. Market Analysis, Insights and Forecast - by Region
- 5.3.1. North America
- 5.3.2. Europe
- 5.3.3. Asia
- 5.3.4. Australia and New Zealand
- 5.3.5. Latin America
- 5.3.6. Middle East and Africa
- 5.1. Market Analysis, Insights and Forecast - by Technology
- 6. North America Gyroscope Industry Analysis, Insights and Forecast, 2019-2031
- 6.1. Market Analysis, Insights and Forecast - by Technology
- 6.1.1. MEMS Gyroscope
- 6.1.2. Fiber Optic Gyroscope (FOG)
- 6.1.3. Ring Laser Gyroscope (RLG)
- 6.1.4. Hemispherical Resonating Gyroscope (HRG)
- 6.1.5. Dynamically Tuned Gyroscopes (DTG)
- 6.1.6. Other Technologies
- 6.2. Market Analysis, Insights and Forecast - by End-user Vertical
- 6.2.1. Consumer Electronics
- 6.2.2. Automotive
- 6.2.3. Aerospace and Defense
- 6.2.4. Industrial
- 6.2.5. Marine
- 6.2.6. Other End-user Verticals
- 6.1. Market Analysis, Insights and Forecast - by Technology
- 7. Europe Gyroscope Industry Analysis, Insights and Forecast, 2019-2031
- 7.1. Market Analysis, Insights and Forecast - by Technology
- 7.1.1. MEMS Gyroscope
- 7.1.2. Fiber Optic Gyroscope (FOG)
- 7.1.3. Ring Laser Gyroscope (RLG)
- 7.1.4. Hemispherical Resonating Gyroscope (HRG)
- 7.1.5. Dynamically Tuned Gyroscopes (DTG)
- 7.1.6. Other Technologies
- 7.2. Market Analysis, Insights and Forecast - by End-user Vertical
- 7.2.1. Consumer Electronics
- 7.2.2. Automotive
- 7.2.3. Aerospace and Defense
- 7.2.4. Industrial
- 7.2.5. Marine
- 7.2.6. Other End-user Verticals
- 7.1. Market Analysis, Insights and Forecast - by Technology
- 8. Asia Gyroscope Industry Analysis, Insights and Forecast, 2019-2031
- 8.1. Market Analysis, Insights and Forecast - by Technology
- 8.1.1. MEMS Gyroscope
- 8.1.2. Fiber Optic Gyroscope (FOG)
- 8.1.3. Ring Laser Gyroscope (RLG)
- 8.1.4. Hemispherical Resonating Gyroscope (HRG)
- 8.1.5. Dynamically Tuned Gyroscopes (DTG)
- 8.1.6. Other Technologies
- 8.2. Market Analysis, Insights and Forecast - by End-user Vertical
- 8.2.1. Consumer Electronics
- 8.2.2. Automotive
- 8.2.3. Aerospace and Defense
- 8.2.4. Industrial
- 8.2.5. Marine
- 8.2.6. Other End-user Verticals
- 8.1. Market Analysis, Insights and Forecast - by Technology
- 9. Australia and New Zealand Gyroscope Industry Analysis, Insights and Forecast, 2019-2031
- 9.1. Market Analysis, Insights and Forecast - by Technology
- 9.1.1. MEMS Gyroscope
- 9.1.2. Fiber Optic Gyroscope (FOG)
- 9.1.3. Ring Laser Gyroscope (RLG)
- 9.1.4. Hemispherical Resonating Gyroscope (HRG)
- 9.1.5. Dynamically Tuned Gyroscopes (DTG)
- 9.1.6. Other Technologies
- 9.2. Market Analysis, Insights and Forecast - by End-user Vertical
- 9.2.1. Consumer Electronics
- 9.2.2. Automotive
- 9.2.3. Aerospace and Defense
- 9.2.4. Industrial
- 9.2.5. Marine
- 9.2.6. Other End-user Verticals
- 9.1. Market Analysis, Insights and Forecast - by Technology
- 10. Latin America Gyroscope Industry Analysis, Insights and Forecast, 2019-2031
- 10.1. Market Analysis, Insights and Forecast - by Technology
- 10.1.1. MEMS Gyroscope
- 10.1.2. Fiber Optic Gyroscope (FOG)
- 10.1.3. Ring Laser Gyroscope (RLG)
- 10.1.4. Hemispherical Resonating Gyroscope (HRG)
- 10.1.5. Dynamically Tuned Gyroscopes (DTG)
- 10.1.6. Other Technologies
- 10.2. Market Analysis, Insights and Forecast - by End-user Vertical
- 10.2.1. Consumer Electronics
- 10.2.2. Automotive
- 10.2.3. Aerospace and Defense
- 10.2.4. Industrial
- 10.2.5. Marine
- 10.2.6. Other End-user Verticals
- 10.1. Market Analysis, Insights and Forecast - by Technology
- 11. Middle East and Africa Gyroscope Industry Analysis, Insights and Forecast, 2019-2031
- 11.1. Market Analysis, Insights and Forecast - by Technology
- 11.1.1. MEMS Gyroscope
- 11.1.2. Fiber Optic Gyroscope (FOG)
- 11.1.3. Ring Laser Gyroscope (RLG)
- 11.1.4. Hemispherical Resonating Gyroscope (HRG)
- 11.1.5. Dynamically Tuned Gyroscopes (DTG)
- 11.1.6. Other Technologies
- 11.2. Market Analysis, Insights and Forecast - by End-user Vertical
- 11.2.1. Consumer Electronics
- 11.2.2. Automotive
- 11.2.3. Aerospace and Defense
- 11.2.4. Industrial
- 11.2.5. Marine
- 11.2.6. Other End-user Verticals
- 11.1. Market Analysis, Insights and Forecast - by Technology
- 12. North America Gyroscope Industry Analysis, Insights and Forecast, 2019-2031
- 12.1. Market Analysis, Insights and Forecast - By Country/Sub-region
- 12.1.1 United States
- 12.1.2 Canada
- 13. Europe Gyroscope Industry Analysis, Insights and Forecast, 2019-2031
- 13.1. Market Analysis, Insights and Forecast - By Country/Sub-region
- 13.1.1 Germany
- 13.1.2 United Kingdom
- 13.1.3 France
- 13.1.4 Rest of Europe
- 14. Asia Pacific Gyroscope Industry Analysis, Insights and Forecast, 2019-2031
- 14.1. Market Analysis, Insights and Forecast - By Country/Sub-region
- 14.1.1 China
- 14.1.2 Japan
- 14.1.3 India
- 14.1.4 Rest of Asia Pacific
- 15. Rest of the World Gyroscope Industry Analysis, Insights and Forecast, 2019-2031
- 15.1. Market Analysis, Insights and Forecast - By Country/Sub-region
- 15.1.1.
- 16. Competitive Analysis
- 16.1. Global Market Share Analysis 2024
- 16.2. Company Profiles
- 16.2.1 Honeywell International Inc
- 16.2.1.1. Overview
- 16.2.1.2. Products
- 16.2.1.3. SWOT Analysis
- 16.2.1.4. Recent Developments
- 16.2.1.5. Financials (Based on Availability)
- 16.2.2 Dynalab
- 16.2.2.1. Overview
- 16.2.2.2. Products
- 16.2.2.3. SWOT Analysis
- 16.2.2.4. Recent Developments
- 16.2.2.5. Financials (Based on Availability)
- 16.2.3 MEMSIC Inc
- 16.2.3.1. Overview
- 16.2.3.2. Products
- 16.2.3.3. SWOT Analysis
- 16.2.3.4. Recent Developments
- 16.2.3.5. Financials (Based on Availability)
- 16.2.4 MicroStrain Inc
- 16.2.4.1. Overview
- 16.2.4.2. Products
- 16.2.4.3. SWOT Analysis
- 16.2.4.4. Recent Developments
- 16.2.4.5. Financials (Based on Availability)
- 16.2.5 STMicroelectronics NV
- 16.2.5.1. Overview
- 16.2.5.2. Products
- 16.2.5.3. SWOT Analysis
- 16.2.5.4. Recent Developments
- 16.2.5.5. Financials (Based on Availability)
- 16.2.6 Robert Bosch GmbH
- 16.2.6.1. Overview
- 16.2.6.2. Products
- 16.2.6.3. SWOT Analysis
- 16.2.6.4. Recent Developments
- 16.2.6.5. Financials (Based on Availability)
- 16.2.7 InnaLabs
- 16.2.7.1. Overview
- 16.2.7.2. Products
- 16.2.7.3. SWOT Analysis
- 16.2.7.4. Recent Developments
- 16.2.7.5. Financials (Based on Availability)
- 16.2.8 Murata Manufacturing Co Ltd
- 16.2.8.1. Overview
- 16.2.8.2. Products
- 16.2.8.3. SWOT Analysis
- 16.2.8.4. Recent Developments
- 16.2.8.5. Financials (Based on Availability)
- 16.2.9 Analog Devices Inc
- 16.2.9.1. Overview
- 16.2.9.2. Products
- 16.2.9.3. SWOT Analysis
- 16.2.9.4. Recent Developments
- 16.2.9.5. Financials (Based on Availability)
- 16.2.10 EMCORE Corporation
- 16.2.10.1. Overview
- 16.2.10.2. Products
- 16.2.10.3. SWOT Analysis
- 16.2.10.4. Recent Developments
- 16.2.10.5. Financials (Based on Availability)
- 16.2.11 Vectornav Technologies LLC
- 16.2.11.1. Overview
- 16.2.11.2. Products
- 16.2.11.3. SWOT Analysis
- 16.2.11.4. Recent Developments
- 16.2.11.5. Financials (Based on Availability)
- 16.2.1 Honeywell International Inc
List of Figures
- Figure 1: Global Gyroscope Industry Revenue Breakdown (Million, %) by Region 2024 & 2032
- Figure 2: North America Gyroscope Industry Revenue (Million), by Country 2024 & 2032
- Figure 3: North America Gyroscope Industry Revenue Share (%), by Country 2024 & 2032
- Figure 4: Europe Gyroscope Industry Revenue (Million), by Country 2024 & 2032
- Figure 5: Europe Gyroscope Industry Revenue Share (%), by Country 2024 & 2032
- Figure 6: Asia Pacific Gyroscope Industry Revenue (Million), by Country 2024 & 2032
- Figure 7: Asia Pacific Gyroscope Industry Revenue Share (%), by Country 2024 & 2032
- Figure 8: Rest of the World Gyroscope Industry Revenue (Million), by Country 2024 & 2032
- Figure 9: Rest of the World Gyroscope Industry Revenue Share (%), by Country 2024 & 2032
- Figure 10: North America Gyroscope Industry Revenue (Million), by Technology 2024 & 2032
- Figure 11: North America Gyroscope Industry Revenue Share (%), by Technology 2024 & 2032
- Figure 12: North America Gyroscope Industry Revenue (Million), by End-user Vertical 2024 & 2032
- Figure 13: North America Gyroscope Industry Revenue Share (%), by End-user Vertical 2024 & 2032
- Figure 14: North America Gyroscope Industry Revenue (Million), by Country 2024 & 2032
- Figure 15: North America Gyroscope Industry Revenue Share (%), by Country 2024 & 2032
- Figure 16: Europe Gyroscope Industry Revenue (Million), by Technology 2024 & 2032
- Figure 17: Europe Gyroscope Industry Revenue Share (%), by Technology 2024 & 2032
- Figure 18: Europe Gyroscope Industry Revenue (Million), by End-user Vertical 2024 & 2032
- Figure 19: Europe Gyroscope Industry Revenue Share (%), by End-user Vertical 2024 & 2032
- Figure 20: Europe Gyroscope Industry Revenue (Million), by Country 2024 & 2032
- Figure 21: Europe Gyroscope Industry Revenue Share (%), by Country 2024 & 2032
- Figure 22: Asia Gyroscope Industry Revenue (Million), by Technology 2024 & 2032
- Figure 23: Asia Gyroscope Industry Revenue Share (%), by Technology 2024 & 2032
- Figure 24: Asia Gyroscope Industry Revenue (Million), by End-user Vertical 2024 & 2032
- Figure 25: Asia Gyroscope Industry Revenue Share (%), by End-user Vertical 2024 & 2032
- Figure 26: Asia Gyroscope Industry Revenue (Million), by Country 2024 & 2032
- Figure 27: Asia Gyroscope Industry Revenue Share (%), by Country 2024 & 2032
- Figure 28: Australia and New Zealand Gyroscope Industry Revenue (Million), by Technology 2024 & 2032
- Figure 29: Australia and New Zealand Gyroscope Industry Revenue Share (%), by Technology 2024 & 2032
- Figure 30: Australia and New Zealand Gyroscope Industry Revenue (Million), by End-user Vertical 2024 & 2032
- Figure 31: Australia and New Zealand Gyroscope Industry Revenue Share (%), by End-user Vertical 2024 & 2032
- Figure 32: Australia and New Zealand Gyroscope Industry Revenue (Million), by Country 2024 & 2032
- Figure 33: Australia and New Zealand Gyroscope Industry Revenue Share (%), by Country 2024 & 2032
- Figure 34: Latin America Gyroscope Industry Revenue (Million), by Technology 2024 & 2032
- Figure 35: Latin America Gyroscope Industry Revenue Share (%), by Technology 2024 & 2032
- Figure 36: Latin America Gyroscope Industry Revenue (Million), by End-user Vertical 2024 & 2032
- Figure 37: Latin America Gyroscope Industry Revenue Share (%), by End-user Vertical 2024 & 2032
- Figure 38: Latin America Gyroscope Industry Revenue (Million), by Country 2024 & 2032
- Figure 39: Latin America Gyroscope Industry Revenue Share (%), by Country 2024 & 2032
- Figure 40: Middle East and Africa Gyroscope Industry Revenue (Million), by Technology 2024 & 2032
- Figure 41: Middle East and Africa Gyroscope Industry Revenue Share (%), by Technology 2024 & 2032
- Figure 42: Middle East and Africa Gyroscope Industry Revenue (Million), by End-user Vertical 2024 & 2032
- Figure 43: Middle East and Africa Gyroscope Industry Revenue Share (%), by End-user Vertical 2024 & 2032
- Figure 44: Middle East and Africa Gyroscope Industry Revenue (Million), by Country 2024 & 2032
- Figure 45: Middle East and Africa Gyroscope Industry Revenue Share (%), by Country 2024 & 2032
List of Tables
- Table 1: Global Gyroscope Industry Revenue Million Forecast, by Region 2019 & 2032
- Table 2: Global Gyroscope Industry Revenue Million Forecast, by Technology 2019 & 2032
- Table 3: Global Gyroscope Industry Revenue Million Forecast, by End-user Vertical 2019 & 2032
- Table 4: Global Gyroscope Industry Revenue Million Forecast, by Region 2019 & 2032
- Table 5: Global Gyroscope Industry Revenue Million Forecast, by Country 2019 & 2032
- Table 6: United States Gyroscope Industry Revenue (Million) Forecast, by Application 2019 & 2032
- Table 7: Canada Gyroscope Industry Revenue (Million) Forecast, by Application 2019 & 2032
- Table 8: Global Gyroscope Industry Revenue Million Forecast, by Country 2019 & 2032
- Table 9: Germany Gyroscope Industry Revenue (Million) Forecast, by Application 2019 & 2032
- Table 10: United Kingdom Gyroscope Industry Revenue (Million) Forecast, by Application 2019 & 2032
- Table 11: France Gyroscope Industry Revenue (Million) Forecast, by Application 2019 & 2032
- Table 12: Rest of Europe Gyroscope Industry Revenue (Million) Forecast, by Application 2019 & 2032
- Table 13: Global Gyroscope Industry Revenue Million Forecast, by Country 2019 & 2032
- Table 14: China Gyroscope Industry Revenue (Million) Forecast, by Application 2019 & 2032
- Table 15: Japan Gyroscope Industry Revenue (Million) Forecast, by Application 2019 & 2032
- Table 16: India Gyroscope Industry Revenue (Million) Forecast, by Application 2019 & 2032
- Table 17: Rest of Asia Pacific Gyroscope Industry Revenue (Million) Forecast, by Application 2019 & 2032
- Table 18: Global Gyroscope Industry Revenue Million Forecast, by Country 2019 & 2032
- Table 19: Gyroscope Industry Revenue (Million) Forecast, by Application 2019 & 2032
- Table 20: Global Gyroscope Industry Revenue Million Forecast, by Technology 2019 & 2032
- Table 21: Global Gyroscope Industry Revenue Million Forecast, by End-user Vertical 2019 & 2032
- Table 22: Global Gyroscope Industry Revenue Million Forecast, by Country 2019 & 2032
- Table 23: United States Gyroscope Industry Revenue (Million) Forecast, by Application 2019 & 2032
- Table 24: Canada Gyroscope Industry Revenue (Million) Forecast, by Application 2019 & 2032
- Table 25: Global Gyroscope Industry Revenue Million Forecast, by Technology 2019 & 2032
- Table 26: Global Gyroscope Industry Revenue Million Forecast, by End-user Vertical 2019 & 2032
- Table 27: Global Gyroscope Industry Revenue Million Forecast, by Country 2019 & 2032
- Table 28: Germany Gyroscope Industry Revenue (Million) Forecast, by Application 2019 & 2032
- Table 29: United Kingdom Gyroscope Industry Revenue (Million) Forecast, by Application 2019 & 2032
- Table 30: France Gyroscope Industry Revenue (Million) Forecast, by Application 2019 & 2032
- Table 31: Global Gyroscope Industry Revenue Million Forecast, by Technology 2019 & 2032
- Table 32: Global Gyroscope Industry Revenue Million Forecast, by End-user Vertical 2019 & 2032
- Table 33: Global Gyroscope Industry Revenue Million Forecast, by Country 2019 & 2032
- Table 34: China Gyroscope Industry Revenue (Million) Forecast, by Application 2019 & 2032
- Table 35: Japan Gyroscope Industry Revenue (Million) Forecast, by Application 2019 & 2032
- Table 36: India Gyroscope Industry Revenue (Million) Forecast, by Application 2019 & 2032
- Table 37: Global Gyroscope Industry Revenue Million Forecast, by Technology 2019 & 2032
- Table 38: Global Gyroscope Industry Revenue Million Forecast, by End-user Vertical 2019 & 2032
- Table 39: Global Gyroscope Industry Revenue Million Forecast, by Country 2019 & 2032
- Table 40: Global Gyroscope Industry Revenue Million Forecast, by Technology 2019 & 2032
- Table 41: Global Gyroscope Industry Revenue Million Forecast, by End-user Vertical 2019 & 2032
- Table 42: Global Gyroscope Industry Revenue Million Forecast, by Country 2019 & 2032
- Table 43: Global Gyroscope Industry Revenue Million Forecast, by Technology 2019 & 2032
- Table 44: Global Gyroscope Industry Revenue Million Forecast, by End-user Vertical 2019 & 2032
- Table 45: Global Gyroscope Industry Revenue Million Forecast, by Country 2019 & 2032
Frequently Asked Questions
1. What is the projected Compound Annual Growth Rate (CAGR) of the Gyroscope Industry?
The projected CAGR is approximately 6.10%.
2. Which companies are prominent players in the Gyroscope Industry?
Key companies in the market include Honeywell International Inc, Dynalab, MEMSIC Inc, MicroStrain Inc, STMicroelectronics NV, Robert Bosch GmbH, InnaLabs, Murata Manufacturing Co Ltd, Analog Devices Inc, EMCORE Corporation, Vectornav Technologies LLC.
3. What are the main segments of the Gyroscope Industry?
The market segments include Technology, End-user Vertical.
4. Can you provide details about the market size?
The market size is estimated to be USD 4.30 Million as of 2022.
5. What are some drivers contributing to market growth?
Rapid Rise of Unmanned Vehicle in Both Defense and Civilian Applications; Technological Advancements Enabling More Effective Components at a Smaller and Lighter Size.
6. What are the notable trends driving market growth?
Automotive to be the Fastest Growing End-user Vertical.
7. Are there any restraints impacting market growth?
Substantial Increase in Complexity Challenging the Market Demand.
8. Can you provide examples of recent developments in the market?
October 2023 - Honeywell expanded its HGuide industrial navigation portfolio by adding a new Inertial Measurement Unit (IMU), the HGuide i400. This new IMU is specifically designed for a wide array of defense, industrial, and autonomous applications across air, land, and sea vehicles and related equipment. The HGuide i400 IMU, boasting a Gyro Bias Repeatability of under one degree per hour, sets a new standard for compact precision. Measuring just 28 mm x 25 mm, it delivers performance without compromising size or weight compared to existing units.
9. What pricing options are available for accessing the report?
Pricing options include single-user, multi-user, and enterprise licenses priced at USD 4750, USD 5250, and USD 8750 respectively.
10. Is the market size provided in terms of value or volume?
The market size is provided in terms of value, measured in Million.
11. Are there any specific market keywords associated with the report?
Yes, the market keyword associated with the report is "Gyroscope Industry," which aids in identifying and referencing the specific market segment covered.
12. How do I determine which pricing option suits my needs best?
The pricing options vary based on user requirements and access needs. Individual users may opt for single-user licenses, while businesses requiring broader access may choose multi-user or enterprise licenses for cost-effective access to the report.
13. Are there any additional resources or data provided in the Gyroscope Industry report?
While the report offers comprehensive insights, it's advisable to review the specific contents or supplementary materials provided to ascertain if additional resources or data are available.
14. How can I stay updated on further developments or reports in the Gyroscope Industry?
To stay informed about further developments, trends, and reports in the Gyroscope Industry, consider subscribing to industry newsletters, following relevant companies and organizations, or regularly checking reputable industry news sources and publications.
Methodology
Step 1 - Identification of Relevant Samples Size from Population Database


Step 2 - Approaches for Defining Global Market Size (Value, Volume* & Price*)

Note*: In applicable scenarios
Step 3 - Data Sources
Primary Research
- Web Analytics
- Survey Reports
- Research Institute
- Latest Research Reports
- Opinion Leaders
Secondary Research
- Annual Reports
- White Paper
- Latest Press Release
- Industry Association
- Paid Database
- Investor Presentations

Step 4 - Data Triangulation
Involves using different sources of information in order to increase the validity of a study
These sources are likely to be stakeholders in a program - participants, other researchers, program staff, other community members, and so on.
Then we put all data in single framework & apply various statistical tools to find out the dynamic on the market.
During the analysis stage, feedback from the stakeholder groups would be compared to determine areas of agreement as well as areas of divergence


