

Key Insights
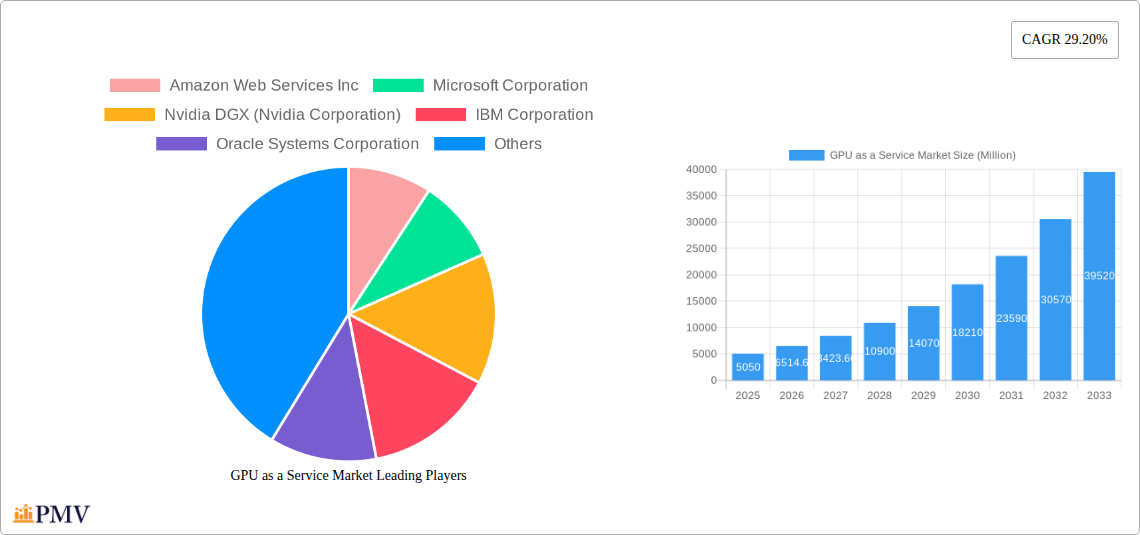
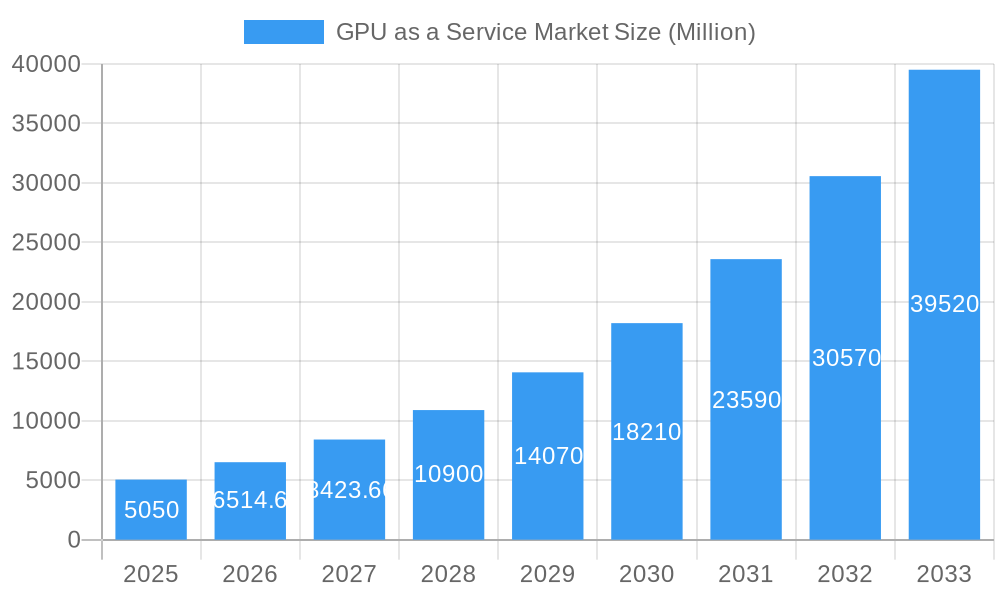
The GPU as a Service (GPaaS) market is experiencing explosive growth, projected to reach $5.05 billion in 2025 and maintain a robust Compound Annual Growth Rate (CAGR) of 29.20% from 2025 to 2033. This rapid expansion is fueled by several key factors. The increasing demand for high-performance computing (HPC) across diverse sectors like AI, machine learning, deep learning, data analytics, and scientific research is a primary driver. Businesses are increasingly adopting cloud-based solutions to access powerful GPUs on demand, avoiding the significant capital expenditure and operational complexities associated with on-premise infrastructure. Furthermore, advancements in GPU technology, offering enhanced processing power and efficiency, are further fueling market growth. The availability of various service models, including spot instances and managed services, catering to diverse budgetary and performance needs, contributes to the market's expansion. Leading players like Amazon Web Services, Microsoft, Nvidia, and Google Cloud are actively investing in expanding their GPaaS offerings, fostering competition and innovation within the market.
GPU as a Service Market Market Size (In Billion)
The GPaaS market is segmented by various factors including deployment model (cloud, on-premises), end-user industry (healthcare, finance, automotive, etc.), and service type (managed, unmanaged). While specific segment data is unavailable, it is reasonable to infer that cloud deployment models will dominate due to their inherent scalability and cost-effectiveness. Similarly, the dominance of large cloud providers like AWS, Microsoft Azure, and Google Cloud suggests that the market is experiencing consolidation among major players. Potential restraints include the challenges associated with data security and privacy in cloud environments and the potential for latency issues depending on network connectivity. However, the strong overall growth trajectory suggests that these restraints are currently being outweighed by the significant advantages offered by GPaaS. Future growth will depend on technological advancements, the expansion of 5G networks and the continued adoption of cloud computing across various sectors.
GPU as a Service Market Company Market Share
GPU as a Service Market: A Comprehensive Report (2019-2033)
This detailed report provides a comprehensive analysis of the GPU as a Service market, covering its structure, competitive dynamics, industry trends, leading players, and future outlook. The study period spans from 2019 to 2033, with 2025 serving as the base and estimated year. The forecast period encompasses 2025-2033, and the historical period covers 2019-2024. The market is expected to reach xx Million by 2033, exhibiting a CAGR of xx% during the forecast period.
GPU as a Service Market Market Structure & Competitive Dynamics
The GPU as a Service market is characterized by a moderately concentrated structure, with a few dominant players commanding a significant market share. However, this landscape is exceptionally dynamic, propelled by relentless innovation and strategic mergers and acquisitions (M&A). Market concentration is estimated at **[Insert Specific Percentage]%**, with the top 5 players collectively generating approximately **[Insert Specific Revenue Figure] Million** in revenue as of 2024. The innovation ecosystem is thriving, fueled by rapid advancements in GPU architecture, sophisticated AI algorithms, and robust cloud computing infrastructure. Regulatory frameworks, which vary considerably by region, play a crucial role in shaping market access and ensuring data privacy compliance. While product substitutes like CPU-based solutions exist, they often fall short in delivering the requisite performance for computationally intensive applications, particularly in the realms of AI and machine learning. End-user trends clearly indicate a strong preference for scalable, cost-effective, and readily accessible GPU resources. M&A activities are frequent and substantial, with recent deal values ranging from **[Insert Lower Deal Value] Million** to **[Insert Higher Deal Value] Million**. Key industry players are strategically focusing on forging partnerships and executing acquisitions to broaden their market reach and enhance their capabilities. For instance, recent acquisitions have predominantly centered on reinforcing cloud infrastructure and expanding geographical presence, signaling a clear trend towards consolidation and aggressive expansion within this highly competitive market.
GPU as a Service Market Industry Trends & Insights
The GPU as a Service market is experiencing exponential growth, driven by several key factors. The increasing adoption of artificial intelligence (AI), machine learning (ML), and high-performance computing (HPC) applications is a major catalyst. The demand for processing power to train and deploy complex AI models is exceeding the capabilities of traditional on-premises solutions. This has resulted in significant market penetration by cloud-based GPU solutions. The market penetration rate is currently estimated at xx%, expected to reach xx% by 2033. Technological disruptions, such as the development of new GPU architectures and advancements in cloud computing technologies, are further accelerating market expansion. Consumer preferences lean towards pay-as-you-go models, offering flexibility and cost optimization. The rise of serverless computing and containerization technologies is simplifying deployment and management of GPU-accelerated applications. Competitive dynamics are characterized by intense innovation and pricing pressures, driving continuous improvements in performance and cost efficiency. The overall market demonstrates significant growth, projected at a CAGR of xx% during the forecast period.
Dominant Markets & Segments in GPU as a Service Market
The North American region currently dominates the GPU as a Service market, driven by a robust technology ecosystem, high adoption rates of cloud computing, and significant investments in AI and ML research. Key drivers in this region include:
- Strong technological infrastructure: Extensive cloud infrastructure and advanced internet connectivity.
- High investment in R&D: Significant funding for AI and HPC research and development.
- Favorable regulatory environment: Policies that promote innovation and technology adoption.
- High concentration of AI and HPC companies: A large number of companies operating in these sectors.
The dominance of North America is expected to continue throughout the forecast period, although other regions, particularly Asia-Pacific, are projected to witness significant growth due to increased investment in technology and growing adoption of cloud computing services.
GPU as a Service Market Product Innovations
Recent product developments in the GPU as a Service market are aggressively focused on elevating performance, enhancing scalability, and simplifying user experience. New-generation GPU architectures, boasting substantially improved computational power and expanded memory bandwidth, are being seamlessly integrated into cloud service offerings. Significant strides in software development and API design are revolutionizing the deployment and management of GPU-accelerated applications, making them more accessible and efficient. Key competitive advantages are being carved out through the delivery of superior performance, compelling cost-effectiveness, and seamless integration with comprehensive cloud platforms. The market is witnessing a pronounced shift towards specialized GPUs meticulously optimized for distinct workloads, such as AI inference or deep learning training, alongside the provision of more adaptable and budget-friendly solutions like pay-as-you-go spot instances.
Report Segmentation & Scope
This comprehensive report meticulously segments the GPU as a Service market across several critical dimensions, including deployment models (cloud and on-premises), diverse end-users (spanning enterprises, academic and research institutions, and others), and distinct geographical regions (such as North America, Europe, Asia-Pacific, and others). The growth trajectory, precise market size, and intricate competitive dynamics of each identified segment are subjected to rigorous individual analysis. Detailed growth projections and precise market size estimations are diligently provided for every segment throughout the entire forecast period. Furthermore, the analysis delves into the nuanced differences in adoption rates and prevailing preferences observed across these various market segments.
Key Drivers of GPU as a Service Market Growth
The robust growth trajectory of the GPU as a Service market is being propelled by a confluence of potent factors. Foremost among these is the escalating demand for high-performance computing (HPC) capabilities across a multitude of industries. This is intricately linked with the burgeoning adoption of cloud-based services, which offer unparalleled flexibility and scalability. The rapidly increasing popularity of Artificial Intelligence (AI) and Machine Learning (ML) applications, inherently demanding significant computational resources, is a primary catalyst. Furthermore, the inherent cost-effectiveness and inherent scalability afforded by cloud-based GPU solutions are major draws for businesses. Technological advancements in GPU architectures and the continuous evolution of cloud computing infrastructure are also instrumental in driving market expansion. In addition, evolving government regulations, with a pronounced emphasis on data privacy and security, are indirectly fostering market growth by promoting the adoption of secure and compliant cloud-based solutions.
Challenges in the GPU as a Service Market Sector
Despite its promising growth, the GPU as a Service market is not without its significant challenges. The inherent high cost associated with both GPUs and comprehensive cloud services remains a substantial hurdle for many organizations. Ensuring the consistent availability and unwavering reliability of cloud infrastructure is another critical concern. The market is also characterized by intense competition among established and emerging cloud providers, which can lead to pricing pressures and a complex decision-making process for potential clients. Regulatory complexities, particularly concerning data security and privacy compliance across different jurisdictions, present ongoing challenges. Moreover, disruptions within global supply chains can adversely affect the availability of GPUs, potentially impacting market dynamics and leading to price fluctuations. These multifaceted challenges necessitate that businesses adopt agile and flexible strategies to effectively mitigate risks and capitalize on market opportunities.
Leading Players in the GPU as a Service Market Market
- Amazon Web Services Inc
- Microsoft Corporation
- Nvidia DGX (Nvidia Corporation)
- IBM Corporation
- Oracle Systems Corporation
- Alphabet Inc (Google)
- Latitude sh
- Seeweb
- Alibaba cloud
- Linode LLC
- CoreWeave
*List Not Exhaustive
Key Developments in GPU as a Service Market Sector
- November 2023: Microsoft Corporation announced the addition of a new NVIDIA H200 Tensor core GPU as a Service on Azure, expected to be available in Q2 2024. This aims to enhance larger model inferencing with no latency increase, boosting AI workloads like LLMs and generative AI.
- May 2024: Krutrim, an Ola-backed AI startup, launched a GPU as a Service platform enabling developers and enterprises to train and fine-tune AI models cost-effectively.
Strategic GPU as a Service Market Market Outlook
The GPU as a Service market is poised for continued robust growth, driven by the increasing demand for AI and ML capabilities across diverse industries. The market offers significant opportunities for cloud providers, GPU manufacturers, and software developers. Strategic partnerships and collaborations are likely to play a pivotal role in shaping the market's future. Focus on developing specialized GPU offerings catering to specific industry needs and optimizing cost-effectiveness will be crucial for achieving sustained growth and market leadership.
GPU as a Service Market Segmentation
-
1. Application
- 1.1. Artificial Intelligence
- 1.2. High Performance Computing
- 1.3. Other Applications
-
2. Enterprise Type
- 2.1. Small and Medium Enterprise
- 2.2. Large Enterprise
-
3. End User
- 3.1. BFSI
- 3.2. Automotive
- 3.3. Healthcare
- 3.4. IT and Communication
- 3.5. Other End Users
GPU as a Service Market Segmentation By Geography
- 1. North America
- 2. Europe
- 3. Asia
- 4. Australia and New Zealand
- 5. Middle East and Africa
- 6. Latin America
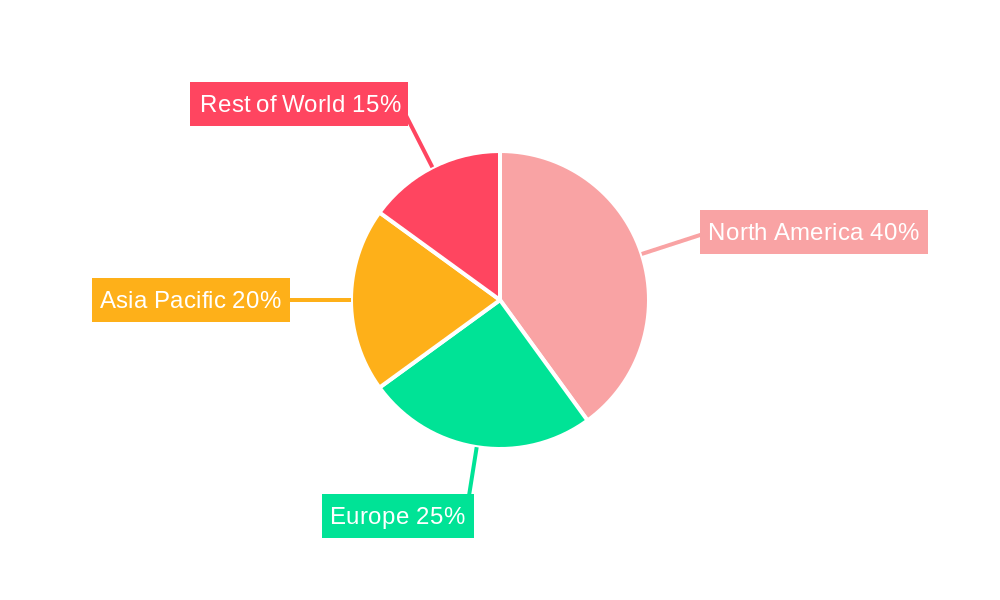
GPU as a Service Market Regional Market Share
Geographic Coverage of GPU as a Service Market
GPU as a Service Market REPORT HIGHLIGHTS
| Aspects | Details |
|---|---|
| Study Period | 2020-2034 |
| Base Year | 2025 |
| Estimated Year | 2026 |
| Forecast Period | 2026-2034 |
| Historical Period | 2020-2025 |
| Growth Rate | CAGR of 29.20% from 2020-2034 |
| Segmentation |
|
Table of Contents
- 1. Introduction
- 1.1. Research Scope
- 1.2. Market Segmentation
- 1.3. Research Objective
- 1.4. Definitions and Assumptions
- 2. Executive Summary
- 2.1. Market Snapshot
- 3. Market Dynamics
- 3.1. Market Drivers
- 3.2. Market Restrains
- 3.3. Market Trends
- 3.4. Market Opportunities
- 4. Market Factor Analysis
- 4.1. Porters Five Forces
- 4.1.1. Bargaining Power of Suppliers
- 4.1.2. Bargaining Power of Buyers
- 4.1.3. Threat of New Entrants
- 4.1.4. Threat of Substitutes
- 4.1.5. Competitive Rivalry
- 4.2. PESTEL analysis
- 4.3. BCG Analysis
- 4.3.1. Stars (High Growth, High Market Share)
- 4.3.2. Cash Cows (Low Growth, High Market Share)
- 4.3.3. Question Mark (High Growth, Low Market Share)
- 4.3.4. Dogs (Low Growth, Low Market Share)
- 4.4. Ansoff Matrix Analysis
- 4.5. Supply Chain Analysis
- 4.6. Regulatory Landscape
- 4.7. Current Market Potential and Opportunity Assessment (TAM–SAM–SOM Framework)
- 4.8. PMV Analyst Note
- 4.1. Porters Five Forces
- 5. Market Analysis, Insights and Forecast 2021-2033
- 5.1. Market Analysis, Insights and Forecast - by Application
- 5.1.1. Artificial Intelligence
- 5.1.2. High Performance Computing
- 5.1.3. Other Applications
- 5.2. Market Analysis, Insights and Forecast - by Enterprise Type
- 5.2.1. Small and Medium Enterprise
- 5.2.2. Large Enterprise
- 5.3. Market Analysis, Insights and Forecast - by End User
- 5.3.1. BFSI
- 5.3.2. Automotive
- 5.3.3. Healthcare
- 5.3.4. IT and Communication
- 5.3.5. Other End Users
- 5.4. Market Analysis, Insights and Forecast - by Region
- 5.4.1. North America
- 5.4.2. Europe
- 5.4.3. Asia
- 5.4.4. Australia and New Zealand
- 5.4.5. Middle East and Africa
- 5.4.6. Latin America
- 5.1. Market Analysis, Insights and Forecast - by Application
- 6. Global GPU as a Service Market Analysis, Insights and Forecast, 2021-2033
- 6.1. Market Analysis, Insights and Forecast - by Application
- 6.1.1. Artificial Intelligence
- 6.1.2. High Performance Computing
- 6.1.3. Other Applications
- 6.2. Market Analysis, Insights and Forecast - by Enterprise Type
- 6.2.1. Small and Medium Enterprise
- 6.2.2. Large Enterprise
- 6.3. Market Analysis, Insights and Forecast - by End User
- 6.3.1. BFSI
- 6.3.2. Automotive
- 6.3.3. Healthcare
- 6.3.4. IT and Communication
- 6.3.5. Other End Users
- 6.1. Market Analysis, Insights and Forecast - by Application
- 7. North America GPU as a Service Market Analysis, Insights and Forecast, 2020-2032
- 7.1. Market Analysis, Insights and Forecast - by Application
- 7.1.1. Artificial Intelligence
- 7.1.2. High Performance Computing
- 7.1.3. Other Applications
- 7.2. Market Analysis, Insights and Forecast - by Enterprise Type
- 7.2.1. Small and Medium Enterprise
- 7.2.2. Large Enterprise
- 7.3. Market Analysis, Insights and Forecast - by End User
- 7.3.1. BFSI
- 7.3.2. Automotive
- 7.3.3. Healthcare
- 7.3.4. IT and Communication
- 7.3.5. Other End Users
- 7.1. Market Analysis, Insights and Forecast - by Application
- 8. Europe GPU as a Service Market Analysis, Insights and Forecast, 2020-2032
- 8.1. Market Analysis, Insights and Forecast - by Application
- 8.1.1. Artificial Intelligence
- 8.1.2. High Performance Computing
- 8.1.3. Other Applications
- 8.2. Market Analysis, Insights and Forecast - by Enterprise Type
- 8.2.1. Small and Medium Enterprise
- 8.2.2. Large Enterprise
- 8.3. Market Analysis, Insights and Forecast - by End User
- 8.3.1. BFSI
- 8.3.2. Automotive
- 8.3.3. Healthcare
- 8.3.4. IT and Communication
- 8.3.5. Other End Users
- 8.1. Market Analysis, Insights and Forecast - by Application
- 9. Asia GPU as a Service Market Analysis, Insights and Forecast, 2020-2032
- 9.1. Market Analysis, Insights and Forecast - by Application
- 9.1.1. Artificial Intelligence
- 9.1.2. High Performance Computing
- 9.1.3. Other Applications
- 9.2. Market Analysis, Insights and Forecast - by Enterprise Type
- 9.2.1. Small and Medium Enterprise
- 9.2.2. Large Enterprise
- 9.3. Market Analysis, Insights and Forecast - by End User
- 9.3.1. BFSI
- 9.3.2. Automotive
- 9.3.3. Healthcare
- 9.3.4. IT and Communication
- 9.3.5. Other End Users
- 9.1. Market Analysis, Insights and Forecast - by Application
- 10. Australia and New Zealand GPU as a Service Market Analysis, Insights and Forecast, 2020-2032
- 10.1. Market Analysis, Insights and Forecast - by Application
- 10.1.1. Artificial Intelligence
- 10.1.2. High Performance Computing
- 10.1.3. Other Applications
- 10.2. Market Analysis, Insights and Forecast - by Enterprise Type
- 10.2.1. Small and Medium Enterprise
- 10.2.2. Large Enterprise
- 10.3. Market Analysis, Insights and Forecast - by End User
- 10.3.1. BFSI
- 10.3.2. Automotive
- 10.3.3. Healthcare
- 10.3.4. IT and Communication
- 10.3.5. Other End Users
- 10.1. Market Analysis, Insights and Forecast - by Application
- 11. Middle East and Africa GPU as a Service Market Analysis, Insights and Forecast, 2020-2032
- 11.1. Market Analysis, Insights and Forecast - by Application
- 11.1.1. Artificial Intelligence
- 11.1.2. High Performance Computing
- 11.1.3. Other Applications
- 11.2. Market Analysis, Insights and Forecast - by Enterprise Type
- 11.2.1. Small and Medium Enterprise
- 11.2.2. Large Enterprise
- 11.3. Market Analysis, Insights and Forecast - by End User
- 11.3.1. BFSI
- 11.3.2. Automotive
- 11.3.3. Healthcare
- 11.3.4. IT and Communication
- 11.3.5. Other End Users
- 11.1. Market Analysis, Insights and Forecast - by Application
- 12. Latin America GPU as a Service Market Analysis, Insights and Forecast, 2020-2032
- 12.1. Market Analysis, Insights and Forecast - by Application
- 12.1.1. Artificial Intelligence
- 12.1.2. High Performance Computing
- 12.1.3. Other Applications
- 12.2. Market Analysis, Insights and Forecast - by Enterprise Type
- 12.2.1. Small and Medium Enterprise
- 12.2.2. Large Enterprise
- 12.3. Market Analysis, Insights and Forecast - by End User
- 12.3.1. BFSI
- 12.3.2. Automotive
- 12.3.3. Healthcare
- 12.3.4. IT and Communication
- 12.3.5. Other End Users
- 12.1. Market Analysis, Insights and Forecast - by Application
- 13. Competitive Analysis
- 13.1. Company Profiles
- 13.1.1 Amazon Web Services Inc
- 13.1.1.1. Company Overview
- 13.1.1.2. Products
- 13.1.1.3. Company Financials
- 13.1.1.4. SWOT Analysis
- 13.1.2 Microsoft Corporation
- 13.1.2.1. Company Overview
- 13.1.2.2. Products
- 13.1.2.3. Company Financials
- 13.1.2.4. SWOT Analysis
- 13.1.3 Nvidia DGX (Nvidia Corporation)
- 13.1.3.1. Company Overview
- 13.1.3.2. Products
- 13.1.3.3. Company Financials
- 13.1.3.4. SWOT Analysis
- 13.1.4 IBM Corporation
- 13.1.4.1. Company Overview
- 13.1.4.2. Products
- 13.1.4.3. Company Financials
- 13.1.4.4. SWOT Analysis
- 13.1.5 Oracle Systems Corporation
- 13.1.5.1. Company Overview
- 13.1.5.2. Products
- 13.1.5.3. Company Financials
- 13.1.5.4. SWOT Analysis
- 13.1.6 Alphabet Inc (Google)
- 13.1.6.1. Company Overview
- 13.1.6.2. Products
- 13.1.6.3. Company Financials
- 13.1.6.4. SWOT Analysis
- 13.1.7 Latitude sh
- 13.1.7.1. Company Overview
- 13.1.7.2. Products
- 13.1.7.3. Company Financials
- 13.1.7.4. SWOT Analysis
- 13.1.8 Seeweb
- 13.1.8.1. Company Overview
- 13.1.8.2. Products
- 13.1.8.3. Company Financials
- 13.1.8.4. SWOT Analysis
- 13.1.9 Alibaba cloud
- 13.1.9.1. Company Overview
- 13.1.9.2. Products
- 13.1.9.3. Company Financials
- 13.1.9.4. SWOT Analysis
- 13.1.10 Linode LLC
- 13.1.10.1. Company Overview
- 13.1.10.2. Products
- 13.1.10.3. Company Financials
- 13.1.10.4. SWOT Analysis
- 13.1.11 CoreWeave*List Not Exhaustive
- 13.1.11.1. Company Overview
- 13.1.11.2. Products
- 13.1.11.3. Company Financials
- 13.1.11.4. SWOT Analysis
- 13.1.1 Amazon Web Services Inc
- 13.2. Market Entropy
- 13.2.1 Company's Key Areas Served
- 13.2.2 Recent Developments
- 13.3. Company Market Share Analysis 2025
- 13.3.1 Top 5 Companies Market Share Analysis
- 13.3.2 Top 3 Companies Market Share Analysis
- 13.4. List of Potential Customers
- 14. Research Methodology
List of Figures
- Figure 1: Global GPU as a Service Market Revenue Breakdown (Million, %) by Region 2025 & 2033
- Figure 2: Global GPU as a Service Market Volume Breakdown (Billion, %) by Region 2025 & 2033
- Figure 3: North America GPU as a Service Market Revenue (Million), by Application 2025 & 2033
- Figure 4: North America GPU as a Service Market Volume (Billion), by Application 2025 & 2033
- Figure 5: North America GPU as a Service Market Revenue Share (%), by Application 2025 & 2033
- Figure 6: North America GPU as a Service Market Volume Share (%), by Application 2025 & 2033
- Figure 7: North America GPU as a Service Market Revenue (Million), by Enterprise Type 2025 & 2033
- Figure 8: North America GPU as a Service Market Volume (Billion), by Enterprise Type 2025 & 2033
- Figure 9: North America GPU as a Service Market Revenue Share (%), by Enterprise Type 2025 & 2033
- Figure 10: North America GPU as a Service Market Volume Share (%), by Enterprise Type 2025 & 2033
- Figure 11: North America GPU as a Service Market Revenue (Million), by End User 2025 & 2033
- Figure 12: North America GPU as a Service Market Volume (Billion), by End User 2025 & 2033
- Figure 13: North America GPU as a Service Market Revenue Share (%), by End User 2025 & 2033
- Figure 14: North America GPU as a Service Market Volume Share (%), by End User 2025 & 2033
- Figure 15: North America GPU as a Service Market Revenue (Million), by Country 2025 & 2033
- Figure 16: North America GPU as a Service Market Volume (Billion), by Country 2025 & 2033
- Figure 17: North America GPU as a Service Market Revenue Share (%), by Country 2025 & 2033
- Figure 18: North America GPU as a Service Market Volume Share (%), by Country 2025 & 2033
- Figure 19: Europe GPU as a Service Market Revenue (Million), by Application 2025 & 2033
- Figure 20: Europe GPU as a Service Market Volume (Billion), by Application 2025 & 2033
- Figure 21: Europe GPU as a Service Market Revenue Share (%), by Application 2025 & 2033
- Figure 22: Europe GPU as a Service Market Volume Share (%), by Application 2025 & 2033
- Figure 23: Europe GPU as a Service Market Revenue (Million), by Enterprise Type 2025 & 2033
- Figure 24: Europe GPU as a Service Market Volume (Billion), by Enterprise Type 2025 & 2033
- Figure 25: Europe GPU as a Service Market Revenue Share (%), by Enterprise Type 2025 & 2033
- Figure 26: Europe GPU as a Service Market Volume Share (%), by Enterprise Type 2025 & 2033
- Figure 27: Europe GPU as a Service Market Revenue (Million), by End User 2025 & 2033
- Figure 28: Europe GPU as a Service Market Volume (Billion), by End User 2025 & 2033
- Figure 29: Europe GPU as a Service Market Revenue Share (%), by End User 2025 & 2033
- Figure 30: Europe GPU as a Service Market Volume Share (%), by End User 2025 & 2033
- Figure 31: Europe GPU as a Service Market Revenue (Million), by Country 2025 & 2033
- Figure 32: Europe GPU as a Service Market Volume (Billion), by Country 2025 & 2033
- Figure 33: Europe GPU as a Service Market Revenue Share (%), by Country 2025 & 2033
- Figure 34: Europe GPU as a Service Market Volume Share (%), by Country 2025 & 2033
- Figure 35: Asia GPU as a Service Market Revenue (Million), by Application 2025 & 2033
- Figure 36: Asia GPU as a Service Market Volume (Billion), by Application 2025 & 2033
- Figure 37: Asia GPU as a Service Market Revenue Share (%), by Application 2025 & 2033
- Figure 38: Asia GPU as a Service Market Volume Share (%), by Application 2025 & 2033
- Figure 39: Asia GPU as a Service Market Revenue (Million), by Enterprise Type 2025 & 2033
- Figure 40: Asia GPU as a Service Market Volume (Billion), by Enterprise Type 2025 & 2033
- Figure 41: Asia GPU as a Service Market Revenue Share (%), by Enterprise Type 2025 & 2033
- Figure 42: Asia GPU as a Service Market Volume Share (%), by Enterprise Type 2025 & 2033
- Figure 43: Asia GPU as a Service Market Revenue (Million), by End User 2025 & 2033
- Figure 44: Asia GPU as a Service Market Volume (Billion), by End User 2025 & 2033
- Figure 45: Asia GPU as a Service Market Revenue Share (%), by End User 2025 & 2033
- Figure 46: Asia GPU as a Service Market Volume Share (%), by End User 2025 & 2033
- Figure 47: Asia GPU as a Service Market Revenue (Million), by Country 2025 & 2033
- Figure 48: Asia GPU as a Service Market Volume (Billion), by Country 2025 & 2033
- Figure 49: Asia GPU as a Service Market Revenue Share (%), by Country 2025 & 2033
- Figure 50: Asia GPU as a Service Market Volume Share (%), by Country 2025 & 2033
- Figure 51: Australia and New Zealand GPU as a Service Market Revenue (Million), by Application 2025 & 2033
- Figure 52: Australia and New Zealand GPU as a Service Market Volume (Billion), by Application 2025 & 2033
- Figure 53: Australia and New Zealand GPU as a Service Market Revenue Share (%), by Application 2025 & 2033
- Figure 54: Australia and New Zealand GPU as a Service Market Volume Share (%), by Application 2025 & 2033
- Figure 55: Australia and New Zealand GPU as a Service Market Revenue (Million), by Enterprise Type 2025 & 2033
- Figure 56: Australia and New Zealand GPU as a Service Market Volume (Billion), by Enterprise Type 2025 & 2033
- Figure 57: Australia and New Zealand GPU as a Service Market Revenue Share (%), by Enterprise Type 2025 & 2033
- Figure 58: Australia and New Zealand GPU as a Service Market Volume Share (%), by Enterprise Type 2025 & 2033
- Figure 59: Australia and New Zealand GPU as a Service Market Revenue (Million), by End User 2025 & 2033
- Figure 60: Australia and New Zealand GPU as a Service Market Volume (Billion), by End User 2025 & 2033
- Figure 61: Australia and New Zealand GPU as a Service Market Revenue Share (%), by End User 2025 & 2033
- Figure 62: Australia and New Zealand GPU as a Service Market Volume Share (%), by End User 2025 & 2033
- Figure 63: Australia and New Zealand GPU as a Service Market Revenue (Million), by Country 2025 & 2033
- Figure 64: Australia and New Zealand GPU as a Service Market Volume (Billion), by Country 2025 & 2033
- Figure 65: Australia and New Zealand GPU as a Service Market Revenue Share (%), by Country 2025 & 2033
- Figure 66: Australia and New Zealand GPU as a Service Market Volume Share (%), by Country 2025 & 2033
- Figure 67: Middle East and Africa GPU as a Service Market Revenue (Million), by Application 2025 & 2033
- Figure 68: Middle East and Africa GPU as a Service Market Volume (Billion), by Application 2025 & 2033
- Figure 69: Middle East and Africa GPU as a Service Market Revenue Share (%), by Application 2025 & 2033
- Figure 70: Middle East and Africa GPU as a Service Market Volume Share (%), by Application 2025 & 2033
- Figure 71: Middle East and Africa GPU as a Service Market Revenue (Million), by Enterprise Type 2025 & 2033
- Figure 72: Middle East and Africa GPU as a Service Market Volume (Billion), by Enterprise Type 2025 & 2033
- Figure 73: Middle East and Africa GPU as a Service Market Revenue Share (%), by Enterprise Type 2025 & 2033
- Figure 74: Middle East and Africa GPU as a Service Market Volume Share (%), by Enterprise Type 2025 & 2033
- Figure 75: Middle East and Africa GPU as a Service Market Revenue (Million), by End User 2025 & 2033
- Figure 76: Middle East and Africa GPU as a Service Market Volume (Billion), by End User 2025 & 2033
- Figure 77: Middle East and Africa GPU as a Service Market Revenue Share (%), by End User 2025 & 2033
- Figure 78: Middle East and Africa GPU as a Service Market Volume Share (%), by End User 2025 & 2033
- Figure 79: Middle East and Africa GPU as a Service Market Revenue (Million), by Country 2025 & 2033
- Figure 80: Middle East and Africa GPU as a Service Market Volume (Billion), by Country 2025 & 2033
- Figure 81: Middle East and Africa GPU as a Service Market Revenue Share (%), by Country 2025 & 2033
- Figure 82: Middle East and Africa GPU as a Service Market Volume Share (%), by Country 2025 & 2033
- Figure 83: Latin America GPU as a Service Market Revenue (Million), by Application 2025 & 2033
- Figure 84: Latin America GPU as a Service Market Volume (Billion), by Application 2025 & 2033
- Figure 85: Latin America GPU as a Service Market Revenue Share (%), by Application 2025 & 2033
- Figure 86: Latin America GPU as a Service Market Volume Share (%), by Application 2025 & 2033
- Figure 87: Latin America GPU as a Service Market Revenue (Million), by Enterprise Type 2025 & 2033
- Figure 88: Latin America GPU as a Service Market Volume (Billion), by Enterprise Type 2025 & 2033
- Figure 89: Latin America GPU as a Service Market Revenue Share (%), by Enterprise Type 2025 & 2033
- Figure 90: Latin America GPU as a Service Market Volume Share (%), by Enterprise Type 2025 & 2033
- Figure 91: Latin America GPU as a Service Market Revenue (Million), by End User 2025 & 2033
- Figure 92: Latin America GPU as a Service Market Volume (Billion), by End User 2025 & 2033
- Figure 93: Latin America GPU as a Service Market Revenue Share (%), by End User 2025 & 2033
- Figure 94: Latin America GPU as a Service Market Volume Share (%), by End User 2025 & 2033
- Figure 95: Latin America GPU as a Service Market Revenue (Million), by Country 2025 & 2033
- Figure 96: Latin America GPU as a Service Market Volume (Billion), by Country 2025 & 2033
- Figure 97: Latin America GPU as a Service Market Revenue Share (%), by Country 2025 & 2033
- Figure 98: Latin America GPU as a Service Market Volume Share (%), by Country 2025 & 2033
List of Tables
- Table 1: Global GPU as a Service Market Revenue Million Forecast, by Application 2020 & 2033
- Table 2: Global GPU as a Service Market Volume Billion Forecast, by Application 2020 & 2033
- Table 3: Global GPU as a Service Market Revenue Million Forecast, by Enterprise Type 2020 & 2033
- Table 4: Global GPU as a Service Market Volume Billion Forecast, by Enterprise Type 2020 & 2033
- Table 5: Global GPU as a Service Market Revenue Million Forecast, by End User 2020 & 2033
- Table 6: Global GPU as a Service Market Volume Billion Forecast, by End User 2020 & 2033
- Table 7: Global GPU as a Service Market Revenue Million Forecast, by Region 2020 & 2033
- Table 8: Global GPU as a Service Market Volume Billion Forecast, by Region 2020 & 2033
- Table 9: Global GPU as a Service Market Revenue Million Forecast, by Application 2020 & 2033
- Table 10: Global GPU as a Service Market Volume Billion Forecast, by Application 2020 & 2033
- Table 11: Global GPU as a Service Market Revenue Million Forecast, by Enterprise Type 2020 & 2033
- Table 12: Global GPU as a Service Market Volume Billion Forecast, by Enterprise Type 2020 & 2033
- Table 13: Global GPU as a Service Market Revenue Million Forecast, by End User 2020 & 2033
- Table 14: Global GPU as a Service Market Volume Billion Forecast, by End User 2020 & 2033
- Table 15: Global GPU as a Service Market Revenue Million Forecast, by Country 2020 & 2033
- Table 16: Global GPU as a Service Market Volume Billion Forecast, by Country 2020 & 2033
- Table 17: Global GPU as a Service Market Revenue Million Forecast, by Application 2020 & 2033
- Table 18: Global GPU as a Service Market Volume Billion Forecast, by Application 2020 & 2033
- Table 19: Global GPU as a Service Market Revenue Million Forecast, by Enterprise Type 2020 & 2033
- Table 20: Global GPU as a Service Market Volume Billion Forecast, by Enterprise Type 2020 & 2033
- Table 21: Global GPU as a Service Market Revenue Million Forecast, by End User 2020 & 2033
- Table 22: Global GPU as a Service Market Volume Billion Forecast, by End User 2020 & 2033
- Table 23: Global GPU as a Service Market Revenue Million Forecast, by Country 2020 & 2033
- Table 24: Global GPU as a Service Market Volume Billion Forecast, by Country 2020 & 2033
- Table 25: Global GPU as a Service Market Revenue Million Forecast, by Application 2020 & 2033
- Table 26: Global GPU as a Service Market Volume Billion Forecast, by Application 2020 & 2033
- Table 27: Global GPU as a Service Market Revenue Million Forecast, by Enterprise Type 2020 & 2033
- Table 28: Global GPU as a Service Market Volume Billion Forecast, by Enterprise Type 2020 & 2033
- Table 29: Global GPU as a Service Market Revenue Million Forecast, by End User 2020 & 2033
- Table 30: Global GPU as a Service Market Volume Billion Forecast, by End User 2020 & 2033
- Table 31: Global GPU as a Service Market Revenue Million Forecast, by Country 2020 & 2033
- Table 32: Global GPU as a Service Market Volume Billion Forecast, by Country 2020 & 2033
- Table 33: Global GPU as a Service Market Revenue Million Forecast, by Application 2020 & 2033
- Table 34: Global GPU as a Service Market Volume Billion Forecast, by Application 2020 & 2033
- Table 35: Global GPU as a Service Market Revenue Million Forecast, by Enterprise Type 2020 & 2033
- Table 36: Global GPU as a Service Market Volume Billion Forecast, by Enterprise Type 2020 & 2033
- Table 37: Global GPU as a Service Market Revenue Million Forecast, by End User 2020 & 2033
- Table 38: Global GPU as a Service Market Volume Billion Forecast, by End User 2020 & 2033
- Table 39: Global GPU as a Service Market Revenue Million Forecast, by Country 2020 & 2033
- Table 40: Global GPU as a Service Market Volume Billion Forecast, by Country 2020 & 2033
- Table 41: Global GPU as a Service Market Revenue Million Forecast, by Application 2020 & 2033
- Table 42: Global GPU as a Service Market Volume Billion Forecast, by Application 2020 & 2033
- Table 43: Global GPU as a Service Market Revenue Million Forecast, by Enterprise Type 2020 & 2033
- Table 44: Global GPU as a Service Market Volume Billion Forecast, by Enterprise Type 2020 & 2033
- Table 45: Global GPU as a Service Market Revenue Million Forecast, by End User 2020 & 2033
- Table 46: Global GPU as a Service Market Volume Billion Forecast, by End User 2020 & 2033
- Table 47: Global GPU as a Service Market Revenue Million Forecast, by Country 2020 & 2033
- Table 48: Global GPU as a Service Market Volume Billion Forecast, by Country 2020 & 2033
- Table 49: Global GPU as a Service Market Revenue Million Forecast, by Application 2020 & 2033
- Table 50: Global GPU as a Service Market Volume Billion Forecast, by Application 2020 & 2033
- Table 51: Global GPU as a Service Market Revenue Million Forecast, by Enterprise Type 2020 & 2033
- Table 52: Global GPU as a Service Market Volume Billion Forecast, by Enterprise Type 2020 & 2033
- Table 53: Global GPU as a Service Market Revenue Million Forecast, by End User 2020 & 2033
- Table 54: Global GPU as a Service Market Volume Billion Forecast, by End User 2020 & 2033
- Table 55: Global GPU as a Service Market Revenue Million Forecast, by Country 2020 & 2033
- Table 56: Global GPU as a Service Market Volume Billion Forecast, by Country 2020 & 2033
Frequently Asked Questions
1. What is the projected Compound Annual Growth Rate (CAGR) of the GPU as a Service Market?
The projected CAGR is approximately 29.20%.
2. Which companies are prominent players in the GPU as a Service Market?
Key companies in the market include Amazon Web Services Inc, Microsoft Corporation, Nvidia DGX (Nvidia Corporation), IBM Corporation, Oracle Systems Corporation, Alphabet Inc (Google), Latitude sh, Seeweb, Alibaba cloud, Linode LLC, CoreWeave*List Not Exhaustive.
3. What are the main segments of the GPU as a Service Market?
The market segments include Application, Enterprise Type, End User.
4. Can you provide details about the market size?
The market size is estimated to be USD 5.05 Million as of 2022.
5. What are some drivers contributing to market growth?
Rising Usage of Generative AI and LLM Models Across Enterprises; Growing Applications of AR. VR. and AI.
6. What are the notable trends driving market growth?
Automotive is Expected to Witness Remarkable Growth During Forecast Period.
7. Are there any restraints impacting market growth?
Rising Usage of Generative AI and LLM Models Across Enterprises; Growing Applications of AR. VR. and AI.
8. Can you provide examples of recent developments in the market?
May 2024: Krutrim, an AI startup by Ola, launched a GPU as a Service, which enables developers and enterprises to train and tune their AI models at competitive prices.November 2023: Microsoft Corporation announced the addition of a new NVIDIA H200 Tensor core GPU as a Service on Azure, which will be available in Q2 2024. The new service aims to support larger model inferencing with no growth in latency. This new service is expected to boost AI workloads such as LLMs and generative AI models.
9. What pricing options are available for accessing the report?
Pricing options include single-user, multi-user, and enterprise licenses priced at USD 4750, USD 5250, and USD 8750 respectively.
10. Is the market size provided in terms of value or volume?
The market size is provided in terms of value, measured in Million and volume, measured in Billion.
11. Are there any specific market keywords associated with the report?
Yes, the market keyword associated with the report is "GPU as a Service Market," which aids in identifying and referencing the specific market segment covered.
12. How do I determine which pricing option suits my needs best?
The pricing options vary based on user requirements and access needs. Individual users may opt for single-user licenses, while businesses requiring broader access may choose multi-user or enterprise licenses for cost-effective access to the report.
13. Are there any additional resources or data provided in the GPU as a Service Market report?
While the report offers comprehensive insights, it's advisable to review the specific contents or supplementary materials provided to ascertain if additional resources or data are available.
14. How can I stay updated on further developments or reports in the GPU as a Service Market?
To stay informed about further developments, trends, and reports in the GPU as a Service Market, consider subscribing to industry newsletters, following relevant companies and organizations, or regularly checking reputable industry news sources and publications.
Methodology
Step 1 - Identification of Relevant Samples Size from Population Database


Step 2 - Approaches for Defining Global Market Size (Value, Volume* & Price*)

Note*: In applicable scenarios
Step 3 - Data Sources
Primary Research
- Web Analytics
- Survey Reports
- Research Institute
- Latest Research Reports
- Opinion Leaders
Secondary Research
- Annual Reports
- White Paper
- Latest Press Release
- Industry Association
- Paid Database
- Investor Presentations

Step 4 - Data Triangulation
Involves using different sources of information in order to increase the validity of a study
These sources are likely to be stakeholders in a program - participants, other researchers, program staff, other community members, and so on.
Then we put all data in single framework & apply various statistical tools to find out the dynamic on the market.
During the analysis stage, feedback from the stakeholder groups would be compared to determine areas of agreement as well as areas of divergence