
Key Insights
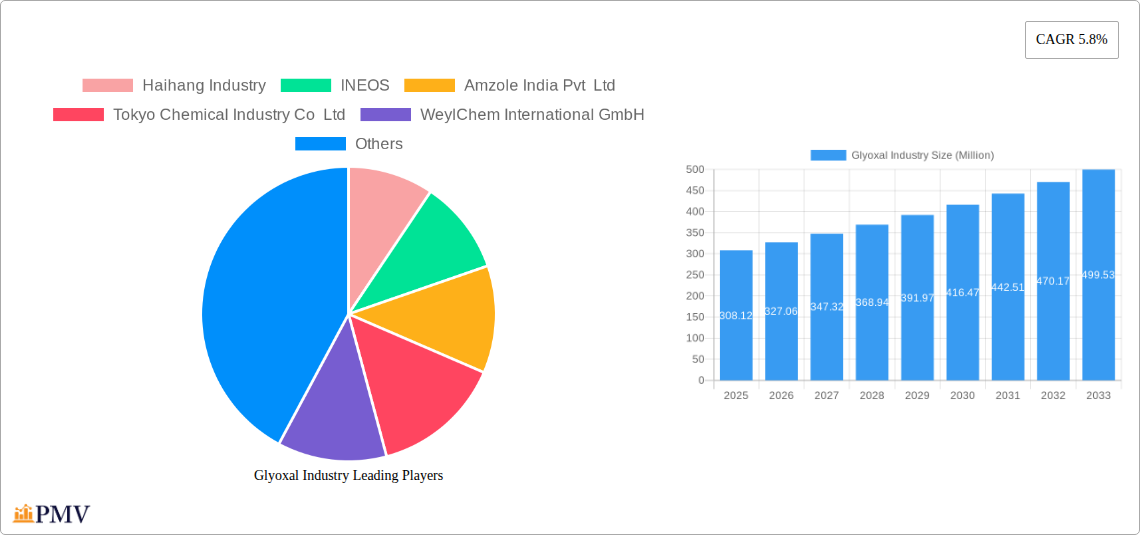
The global glyoxal market, valued at $308.12 million in 2025, is projected to experience robust growth, driven by increasing demand across diverse applications. A Compound Annual Growth Rate (CAGR) of 5.8% from 2025 to 2033 signifies a substantial market expansion. Key drivers include the rising use of glyoxal as a cross-linking agent in the textile industry for enhanced fabric properties, its role as an effective adhesive and sealant in various applications, and its growing importance as an intermediate in the synthesis of pharmaceuticals and other specialty chemicals. The adhesives and sealants segment is anticipated to remain a dominant application area, fueled by construction activity and industrial growth. Furthermore, the expanding cosmetics and personal care sector, with its increasing demand for safe and effective preservatives, is expected to contribute significantly to market growth. However, stringent environmental regulations surrounding chemical usage and potential health concerns associated with glyoxal exposure could act as restraints, necessitating the development of safer handling and disposal methods. Geographic expansion, particularly in rapidly developing economies in Asia-Pacific and South America, offers considerable opportunities for market players. The competitive landscape is marked by both large multinational chemical companies and regional players, highlighting a dynamic market structure with opportunities for innovation and strategic partnerships.
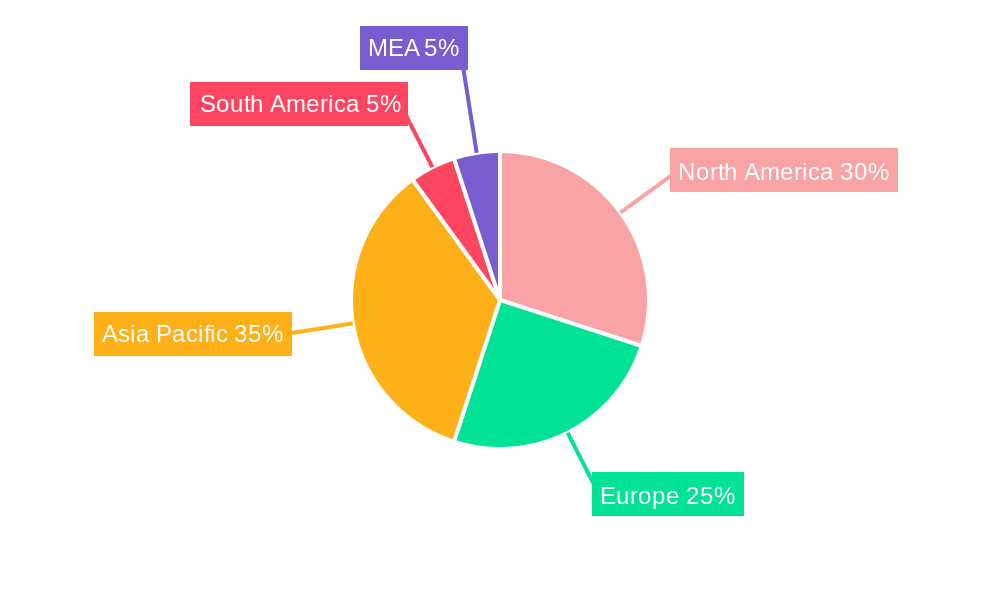
The diverse end-use industries, including textiles, leather, resins & polymers, cosmetics & personal care, and paper packaging, contribute to the market's broad appeal. Direct sales channels currently dominate, but the increasing preference for intermediaries and distributors, particularly in niche markets and remote regions, is creating opportunities for indirect sales channels to gain market share. The North American and European markets are expected to maintain their prominent positions, while Asia-Pacific, driven by China and India's economic expansion, is anticipated to showcase the fastest growth trajectory. The ongoing research and development efforts aimed at improving the efficiency and sustainability of glyoxal production processes will further shape the market's trajectory in the coming years. Overall, the glyoxal market is poised for sustained growth, presenting promising avenues for both established and emerging players.
Glyoxal Industry Market Report: 2019-2033
This comprehensive Glyoxal Industry market report provides an in-depth analysis of the market dynamics, competitive landscape, and future growth prospects from 2019 to 2033. The report covers key segments including application (adhesives & sealants, cross-linking, intermediate, others), end-use industry (textile, leather, resin & polymers, cosmetics & personal care, paper packaging, oil & gas, others), and sales channels (direct and indirect). With a focus on key players like Haihang Industry, INEOS, BASF SE, and more, this report is essential for industry stakeholders seeking actionable insights and strategic planning. The base year for this report is 2025, with an estimated year of 2025 and a forecast period extending to 2033. The historical period covered is 2019-2024. Expected market value in Millions is used throughout.
Glyoxal Industry Market Structure & Competitive Dynamics
This section analyzes the competitive landscape of the global glyoxal market, focusing on market concentration, innovation, regulatory frameworks, and M&A activity. The market is moderately concentrated, with several major players holding significant market share. For example, BASF SE and INEOS are estimated to hold xx% and xx% market share respectively in 2025, while other key players like Haihang Industry and WeylChem International GmbH contribute significantly. The industry witnesses continuous innovation in production processes and application development. Regulatory frameworks, particularly concerning environmental regulations and safety standards, significantly influence market dynamics. Product substitutes, such as other cross-linking agents, pose a competitive challenge. End-user trends, particularly in the textile and resin & polymers industries, drive market growth. M&A activity in the sector has been moderate, with deal values estimated at xx Million in the past five years, primarily focused on expanding geographical reach and product portfolios.
- Market Concentration: Moderately concentrated with key players holding significant shares.
- Innovation: Continuous improvement in production processes and application development.
- Regulatory Framework: Environmental regulations and safety standards are key influencers.
- Product Substitutes: Presence of alternative cross-linking agents impacting market share.
- M&A Activity: Moderate activity with deal values estimated at xx Million over the past 5 years.
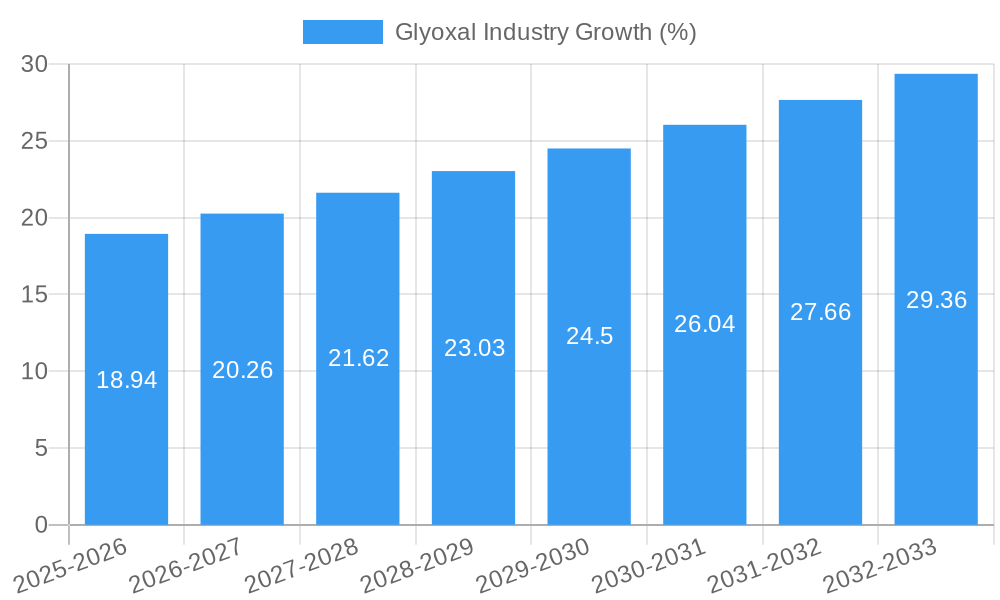
Glyoxal Industry Trends & Insights
The global glyoxal market is experiencing significant growth driven by increasing demand from various end-use industries. The textile industry's reliance on glyoxal as a finishing agent, coupled with growth in the resin & polymer sector, contributes significantly to market expansion. The CAGR during the forecast period (2025-2033) is projected to be xx%, reflecting robust market expansion. Technological advancements in production techniques, leading to cost-effective and efficient manufacturing, further fuel this growth. Consumer preferences for durable and eco-friendly products are influencing the demand for glyoxal-based materials. Competitive dynamics are shaped by factors such as pricing strategies, product innovation, and geographical expansion. Market penetration in emerging economies shows promising potential for expansion, driven by rapid industrialization and infrastructure development.
Dominant Markets & Segments in Glyoxal Industry
The Resin & Polymers segment dominates the glyoxal market by end-use industry, accounting for xx% of the total market in 2025. This high demand stems from the extensive use of glyoxal as a cross-linking agent in various polymer applications. The Adhesives and Sealants segment demonstrates significant growth potential, projected to reach xx Million by 2033. Geographically, the Asia-Pacific region is the leading market, driven by rapid industrialization and growing demand from countries like China and India. Direct sales remain the dominant sales channel, contributing to xx% of market revenue.
- Key Drivers for Resin & Polymers Dominance: High demand for cross-linking agents in polymer production.
- Key Drivers for Adhesives & Sealants Segment Growth: Expanding construction and manufacturing sectors.
- Key Drivers for Asia-Pacific Regional Dominance: Rapid industrialization and robust economic growth.
- Key Drivers for Direct Sales Channel Dominance: Established relationships with key players in the industry.
Glyoxal Industry Product Innovations
Recent innovations in glyoxal production focus on enhancing efficiency and reducing environmental impact. Developments include the implementation of cleaner production technologies and the use of sustainable raw materials. These innovations provide competitive advantages by lowering production costs and improving product quality. The integration of glyoxal into advanced materials and applications continues to expand its market reach, demonstrating a strong market fit.
Report Segmentation & Scope
This report segments the glyoxal market by application (adhesives and sealants, cross-linking agents, intermediates, and others), end-use industry (textile, leather, resin & polymers, cosmetics & personal care, paper packaging, oil & gas, and others), and sales channel (direct and indirect sales). Each segment’s growth projection, market size, and competitive dynamics are analyzed. The report provides a detailed overview of market size, growth rate, and competitive landscape for each segment, offering insights into future market trends and opportunities.
Key Drivers of Glyoxal Industry Growth
Growth is primarily driven by increasing demand from the textile, resin & polymer, and paper packaging industries. The rise of the construction sector and the increasing need for high-performance adhesives and sealants are further boosting demand. Furthermore, technological advancements leading to cost-effective production and improved product quality contribute significantly to the industry's growth. Favorable government policies supporting industrial growth in certain regions also contribute.
Challenges in the Glyoxal Industry Sector
The glyoxal industry faces challenges related to stringent environmental regulations and the volatility of raw material prices. Supply chain disruptions can impact production and distribution, leading to market instability. Intense competition among established players and the entry of new players also pose challenges. The industry must adapt to stricter environmental regulations and fluctuations in raw material costs to maintain profitability and sustainability.
Leading Players in the Glyoxal Industry Market
- Haihang Industry
- INEOS
- Amzole India Pvt Ltd
- Tokyo Chemical Industry Co Ltd
- WeylChem International GmbH
- BASF SE
- Hubei Hongyuan Pharmaceutical Technology Co Ltd
- Toronto Research Chemicals
- Zhonglan Industry Co Ltd
- Thermo Fisher Scientific
Key Developments in Glyoxal Industry Sector
- 2022 Q3: BASF SE announced a significant investment in expanding its glyoxal production capacity.
- 2023 Q1: INEOS launched a new, environmentally friendly glyoxal production process.
- 2024 Q2: Haihang Industry secured a major contract to supply glyoxal to a leading textile manufacturer. (Further developments can be added here as they occur)
Strategic Glyoxal Industry Market Outlook
The glyoxal market is poised for significant growth, driven by increasing demand across various sectors and continuous innovation in production and application. Strategic opportunities lie in developing sustainable production methods, expanding into new geographical markets, particularly in emerging economies, and focusing on niche applications. Companies that can effectively manage supply chain challenges and adapt to evolving regulatory landscapes will be best positioned for success.
Glyoxal Industry Segmentation
-
1. Application
- 1.1. Adhesives and Sealants
- 1.2. Intermediates
- 1.3. Oil and Gas Exploration
- 1.4. Paints and Coatings
- 1.5. Textile
- 1.6. Other Applications
Glyoxal Industry Segmentation By Geography
-
1. Asia Pacific
- 1.1. China
- 1.2. India
- 1.3. Japan
- 1.4. South Korea
- 1.5. Rest of Asia Pacific
-
2. North America
- 2.1. United States
- 2.2. Canada
- 2.3. Mexico
-
3. Europe
- 3.1. Germany
- 3.2. United Kingdom
- 3.3. Italy
- 3.4. France
- 3.5. Rest of Europe
-
4. South America
- 4.1. Brazil
- 4.2. Argentina
- 4.3. Rest of South America
- 5. Middle East
-
6. Saudi Arabia
- 6.1. South Africa
- 6.2. Rest of Middle East
Glyoxal Industry REPORT HIGHLIGHTS
| Aspects | Details |
|---|---|
| Study Period | 2019-2033 |
| Base Year | 2024 |
| Estimated Year | 2025 |
| Forecast Period | 2025-2033 |
| Historical Period | 2019-2024 |
| Growth Rate | CAGR of 5.8% from 2019-2033 |
| Segmentation |
|
Table of Contents
- 1. Introduction
- 1.1. Research Scope
- 1.2. Market Segmentation
- 1.3. Research Methodology
- 1.4. Definitions and Assumptions
- 2. Executive Summary
- 2.1. Introduction
- 3. Market Dynamics
- 3.1. Introduction
- 3.2. Market Drivers
- 3.2.1. ; Increasing Applications of Glyoxal in Fabrics; Growing Demand for Glyoxal as an Intermediate
- 3.3. Market Restrains
- 3.3.1. ; Associated Health Issues; Unfavorable Conditions Arising due to the Impact of COVID-19; Other Restraints
- 3.4. Market Trends
- 3.4.1. Increasing Demand for Glyoxal as an Intermediate and Crosslinkers
- 4. Market Factor Analysis
- 4.1. Porters Five Forces
- 4.2. Supply/Value Chain
- 4.3. PESTEL analysis
- 4.4. Market Entropy
- 4.5. Patent/Trademark Analysis
- 5. Global Glyoxal Industry Analysis, Insights and Forecast, 2019-2031
- 5.1. Market Analysis, Insights and Forecast - by Application
- 5.1.1. Adhesives and Sealants
- 5.1.2. Intermediates
- 5.1.3. Oil and Gas Exploration
- 5.1.4. Paints and Coatings
- 5.1.5. Textile
- 5.1.6. Other Applications
- 5.2. Market Analysis, Insights and Forecast - by Region
- 5.2.1. Asia Pacific
- 5.2.2. North America
- 5.2.3. Europe
- 5.2.4. South America
- 5.2.5. Middle East
- 5.2.6. Saudi Arabia
- 5.1. Market Analysis, Insights and Forecast - by Application
- 6. Asia Pacific Glyoxal Industry Analysis, Insights and Forecast, 2019-2031
- 6.1. Market Analysis, Insights and Forecast - by Application
- 6.1.1. Adhesives and Sealants
- 6.1.2. Intermediates
- 6.1.3. Oil and Gas Exploration
- 6.1.4. Paints and Coatings
- 6.1.5. Textile
- 6.1.6. Other Applications
- 6.1. Market Analysis, Insights and Forecast - by Application
- 7. North America Glyoxal Industry Analysis, Insights and Forecast, 2019-2031
- 7.1. Market Analysis, Insights and Forecast - by Application
- 7.1.1. Adhesives and Sealants
- 7.1.2. Intermediates
- 7.1.3. Oil and Gas Exploration
- 7.1.4. Paints and Coatings
- 7.1.5. Textile
- 7.1.6. Other Applications
- 7.1. Market Analysis, Insights and Forecast - by Application
- 8. Europe Glyoxal Industry Analysis, Insights and Forecast, 2019-2031
- 8.1. Market Analysis, Insights and Forecast - by Application
- 8.1.1. Adhesives and Sealants
- 8.1.2. Intermediates
- 8.1.3. Oil and Gas Exploration
- 8.1.4. Paints and Coatings
- 8.1.5. Textile
- 8.1.6. Other Applications
- 8.1. Market Analysis, Insights and Forecast - by Application
- 9. South America Glyoxal Industry Analysis, Insights and Forecast, 2019-2031
- 9.1. Market Analysis, Insights and Forecast - by Application
- 9.1.1. Adhesives and Sealants
- 9.1.2. Intermediates
- 9.1.3. Oil and Gas Exploration
- 9.1.4. Paints and Coatings
- 9.1.5. Textile
- 9.1.6. Other Applications
- 9.1. Market Analysis, Insights and Forecast - by Application
- 10. Middle East Glyoxal Industry Analysis, Insights and Forecast, 2019-2031
- 10.1. Market Analysis, Insights and Forecast - by Application
- 10.1.1. Adhesives and Sealants
- 10.1.2. Intermediates
- 10.1.3. Oil and Gas Exploration
- 10.1.4. Paints and Coatings
- 10.1.5. Textile
- 10.1.6. Other Applications
- 10.1. Market Analysis, Insights and Forecast - by Application
- 11. Saudi Arabia Glyoxal Industry Analysis, Insights and Forecast, 2019-2031
- 11.1. Market Analysis, Insights and Forecast - by Application
- 11.1.1. Adhesives and Sealants
- 11.1.2. Intermediates
- 11.1.3. Oil and Gas Exploration
- 11.1.4. Paints and Coatings
- 11.1.5. Textile
- 11.1.6. Other Applications
- 11.1. Market Analysis, Insights and Forecast - by Application
- 12. North America Glyoxal Industry Analysis, Insights and Forecast, 2019-2031
- 12.1. Market Analysis, Insights and Forecast - By Country/Sub-region
- 12.1.1 United States
- 12.1.2 Canada
- 12.1.3 Mexico
- 13. Europe Glyoxal Industry Analysis, Insights and Forecast, 2019-2031
- 13.1. Market Analysis, Insights and Forecast - By Country/Sub-region
- 13.1.1 Germany
- 13.1.2 France
- 13.1.3 Italy
- 13.1.4 United Kingdom
- 13.1.5 Netherlands
- 13.1.6 Rest of Europe
- 14. Asia Pacific Glyoxal Industry Analysis, Insights and Forecast, 2019-2031
- 14.1. Market Analysis, Insights and Forecast - By Country/Sub-region
- 14.1.1 China
- 14.1.2 Japan
- 14.1.3 India
- 14.1.4 South Korea
- 14.1.5 Taiwan
- 14.1.6 Australia
- 14.1.7 Rest of Asia-Pacific
- 15. South America Glyoxal Industry Analysis, Insights and Forecast, 2019-2031
- 15.1. Market Analysis, Insights and Forecast - By Country/Sub-region
- 15.1.1 Brazil
- 15.1.2 Argentina
- 15.1.3 Rest of South America
- 16. MEA Glyoxal Industry Analysis, Insights and Forecast, 2019-2031
- 16.1. Market Analysis, Insights and Forecast - By Country/Sub-region
- 16.1.1 Middle East
- 16.1.2 Africa
- 17. Competitive Analysis
- 17.1. Global Market Share Analysis 2024
- 17.2. Company Profiles
- 17.2.1 Haihang Industry
- 17.2.1.1. Overview
- 17.2.1.2. Products
- 17.2.1.3. SWOT Analysis
- 17.2.1.4. Recent Developments
- 17.2.1.5. Financials (Based on Availability)
- 17.2.2 INEOS
- 17.2.2.1. Overview
- 17.2.2.2. Products
- 17.2.2.3. SWOT Analysis
- 17.2.2.4. Recent Developments
- 17.2.2.5. Financials (Based on Availability)
- 17.2.3 Amzole India Pvt Ltd
- 17.2.3.1. Overview
- 17.2.3.2. Products
- 17.2.3.3. SWOT Analysis
- 17.2.3.4. Recent Developments
- 17.2.3.5. Financials (Based on Availability)
- 17.2.4 Tokyo Chemical Industry Co Ltd
- 17.2.4.1. Overview
- 17.2.4.2. Products
- 17.2.4.3. SWOT Analysis
- 17.2.4.4. Recent Developments
- 17.2.4.5. Financials (Based on Availability)
- 17.2.5 WeylChem International GmbH
- 17.2.5.1. Overview
- 17.2.5.2. Products
- 17.2.5.3. SWOT Analysis
- 17.2.5.4. Recent Developments
- 17.2.5.5. Financials (Based on Availability)
- 17.2.6 BASF SE
- 17.2.6.1. Overview
- 17.2.6.2. Products
- 17.2.6.3. SWOT Analysis
- 17.2.6.4. Recent Developments
- 17.2.6.5. Financials (Based on Availability)
- 17.2.7 Hubei Hongyuan Pharmaceutical Technology Co Ltd
- 17.2.7.1. Overview
- 17.2.7.2. Products
- 17.2.7.3. SWOT Analysis
- 17.2.7.4. Recent Developments
- 17.2.7.5. Financials (Based on Availability)
- 17.2.8 Toronto Research Chemicals
- 17.2.8.1. Overview
- 17.2.8.2. Products
- 17.2.8.3. SWOT Analysis
- 17.2.8.4. Recent Developments
- 17.2.8.5. Financials (Based on Availability)
- 17.2.9 Zhonglan Industry Co Ltd
- 17.2.9.1. Overview
- 17.2.9.2. Products
- 17.2.9.3. SWOT Analysis
- 17.2.9.4. Recent Developments
- 17.2.9.5. Financials (Based on Availability)
- 17.2.10 Thermo Fisher Scientific
- 17.2.10.1. Overview
- 17.2.10.2. Products
- 17.2.10.3. SWOT Analysis
- 17.2.10.4. Recent Developments
- 17.2.10.5. Financials (Based on Availability)
- 17.2.1 Haihang Industry
List of Figures
- Figure 1: Global Glyoxal Industry Revenue Breakdown (Million, %) by Region 2024 & 2032
- Figure 2: Global Glyoxal Industry Volume Breakdown (K Tons, %) by Region 2024 & 2032
- Figure 3: North America Glyoxal Industry Revenue (Million), by Country 2024 & 2032
- Figure 4: North America Glyoxal Industry Volume (K Tons), by Country 2024 & 2032
- Figure 5: North America Glyoxal Industry Revenue Share (%), by Country 2024 & 2032
- Figure 6: North America Glyoxal Industry Volume Share (%), by Country 2024 & 2032
- Figure 7: Europe Glyoxal Industry Revenue (Million), by Country 2024 & 2032
- Figure 8: Europe Glyoxal Industry Volume (K Tons), by Country 2024 & 2032
- Figure 9: Europe Glyoxal Industry Revenue Share (%), by Country 2024 & 2032
- Figure 10: Europe Glyoxal Industry Volume Share (%), by Country 2024 & 2032
- Figure 11: Asia Pacific Glyoxal Industry Revenue (Million), by Country 2024 & 2032
- Figure 12: Asia Pacific Glyoxal Industry Volume (K Tons), by Country 2024 & 2032
- Figure 13: Asia Pacific Glyoxal Industry Revenue Share (%), by Country 2024 & 2032
- Figure 14: Asia Pacific Glyoxal Industry Volume Share (%), by Country 2024 & 2032
- Figure 15: South America Glyoxal Industry Revenue (Million), by Country 2024 & 2032
- Figure 16: South America Glyoxal Industry Volume (K Tons), by Country 2024 & 2032
- Figure 17: South America Glyoxal Industry Revenue Share (%), by Country 2024 & 2032
- Figure 18: South America Glyoxal Industry Volume Share (%), by Country 2024 & 2032
- Figure 19: MEA Glyoxal Industry Revenue (Million), by Country 2024 & 2032
- Figure 20: MEA Glyoxal Industry Volume (K Tons), by Country 2024 & 2032
- Figure 21: MEA Glyoxal Industry Revenue Share (%), by Country 2024 & 2032
- Figure 22: MEA Glyoxal Industry Volume Share (%), by Country 2024 & 2032
- Figure 23: Asia Pacific Glyoxal Industry Revenue (Million), by Application 2024 & 2032
- Figure 24: Asia Pacific Glyoxal Industry Volume (K Tons), by Application 2024 & 2032
- Figure 25: Asia Pacific Glyoxal Industry Revenue Share (%), by Application 2024 & 2032
- Figure 26: Asia Pacific Glyoxal Industry Volume Share (%), by Application 2024 & 2032
- Figure 27: Asia Pacific Glyoxal Industry Revenue (Million), by Country 2024 & 2032
- Figure 28: Asia Pacific Glyoxal Industry Volume (K Tons), by Country 2024 & 2032
- Figure 29: Asia Pacific Glyoxal Industry Revenue Share (%), by Country 2024 & 2032
- Figure 30: Asia Pacific Glyoxal Industry Volume Share (%), by Country 2024 & 2032
- Figure 31: North America Glyoxal Industry Revenue (Million), by Application 2024 & 2032
- Figure 32: North America Glyoxal Industry Volume (K Tons), by Application 2024 & 2032
- Figure 33: North America Glyoxal Industry Revenue Share (%), by Application 2024 & 2032
- Figure 34: North America Glyoxal Industry Volume Share (%), by Application 2024 & 2032
- Figure 35: North America Glyoxal Industry Revenue (Million), by Country 2024 & 2032
- Figure 36: North America Glyoxal Industry Volume (K Tons), by Country 2024 & 2032
- Figure 37: North America Glyoxal Industry Revenue Share (%), by Country 2024 & 2032
- Figure 38: North America Glyoxal Industry Volume Share (%), by Country 2024 & 2032
- Figure 39: Europe Glyoxal Industry Revenue (Million), by Application 2024 & 2032
- Figure 40: Europe Glyoxal Industry Volume (K Tons), by Application 2024 & 2032
- Figure 41: Europe Glyoxal Industry Revenue Share (%), by Application 2024 & 2032
- Figure 42: Europe Glyoxal Industry Volume Share (%), by Application 2024 & 2032
- Figure 43: Europe Glyoxal Industry Revenue (Million), by Country 2024 & 2032
- Figure 44: Europe Glyoxal Industry Volume (K Tons), by Country 2024 & 2032
- Figure 45: Europe Glyoxal Industry Revenue Share (%), by Country 2024 & 2032
- Figure 46: Europe Glyoxal Industry Volume Share (%), by Country 2024 & 2032
- Figure 47: South America Glyoxal Industry Revenue (Million), by Application 2024 & 2032
- Figure 48: South America Glyoxal Industry Volume (K Tons), by Application 2024 & 2032
- Figure 49: South America Glyoxal Industry Revenue Share (%), by Application 2024 & 2032
- Figure 50: South America Glyoxal Industry Volume Share (%), by Application 2024 & 2032
- Figure 51: South America Glyoxal Industry Revenue (Million), by Country 2024 & 2032
- Figure 52: South America Glyoxal Industry Volume (K Tons), by Country 2024 & 2032
- Figure 53: South America Glyoxal Industry Revenue Share (%), by Country 2024 & 2032
- Figure 54: South America Glyoxal Industry Volume Share (%), by Country 2024 & 2032
- Figure 55: Middle East Glyoxal Industry Revenue (Million), by Application 2024 & 2032
- Figure 56: Middle East Glyoxal Industry Volume (K Tons), by Application 2024 & 2032
- Figure 57: Middle East Glyoxal Industry Revenue Share (%), by Application 2024 & 2032
- Figure 58: Middle East Glyoxal Industry Volume Share (%), by Application 2024 & 2032
- Figure 59: Middle East Glyoxal Industry Revenue (Million), by Country 2024 & 2032
- Figure 60: Middle East Glyoxal Industry Volume (K Tons), by Country 2024 & 2032
- Figure 61: Middle East Glyoxal Industry Revenue Share (%), by Country 2024 & 2032
- Figure 62: Middle East Glyoxal Industry Volume Share (%), by Country 2024 & 2032
- Figure 63: Saudi Arabia Glyoxal Industry Revenue (Million), by Application 2024 & 2032
- Figure 64: Saudi Arabia Glyoxal Industry Volume (K Tons), by Application 2024 & 2032
- Figure 65: Saudi Arabia Glyoxal Industry Revenue Share (%), by Application 2024 & 2032
- Figure 66: Saudi Arabia Glyoxal Industry Volume Share (%), by Application 2024 & 2032
- Figure 67: Saudi Arabia Glyoxal Industry Revenue (Million), by Country 2024 & 2032
- Figure 68: Saudi Arabia Glyoxal Industry Volume (K Tons), by Country 2024 & 2032
- Figure 69: Saudi Arabia Glyoxal Industry Revenue Share (%), by Country 2024 & 2032
- Figure 70: Saudi Arabia Glyoxal Industry Volume Share (%), by Country 2024 & 2032
List of Tables
- Table 1: Global Glyoxal Industry Revenue Million Forecast, by Region 2019 & 2032
- Table 2: Global Glyoxal Industry Volume K Tons Forecast, by Region 2019 & 2032
- Table 3: Global Glyoxal Industry Revenue Million Forecast, by Application 2019 & 2032
- Table 4: Global Glyoxal Industry Volume K Tons Forecast, by Application 2019 & 2032
- Table 5: Global Glyoxal Industry Revenue Million Forecast, by Region 2019 & 2032
- Table 6: Global Glyoxal Industry Volume K Tons Forecast, by Region 2019 & 2032
- Table 7: Global Glyoxal Industry Revenue Million Forecast, by Country 2019 & 2032
- Table 8: Global Glyoxal Industry Volume K Tons Forecast, by Country 2019 & 2032
- Table 9: United States Glyoxal Industry Revenue (Million) Forecast, by Application 2019 & 2032
- Table 10: United States Glyoxal Industry Volume (K Tons) Forecast, by Application 2019 & 2032
- Table 11: Canada Glyoxal Industry Revenue (Million) Forecast, by Application 2019 & 2032
- Table 12: Canada Glyoxal Industry Volume (K Tons) Forecast, by Application 2019 & 2032
- Table 13: Mexico Glyoxal Industry Revenue (Million) Forecast, by Application 2019 & 2032
- Table 14: Mexico Glyoxal Industry Volume (K Tons) Forecast, by Application 2019 & 2032
- Table 15: Global Glyoxal Industry Revenue Million Forecast, by Country 2019 & 2032
- Table 16: Global Glyoxal Industry Volume K Tons Forecast, by Country 2019 & 2032
- Table 17: Germany Glyoxal Industry Revenue (Million) Forecast, by Application 2019 & 2032
- Table 18: Germany Glyoxal Industry Volume (K Tons) Forecast, by Application 2019 & 2032
- Table 19: France Glyoxal Industry Revenue (Million) Forecast, by Application 2019 & 2032
- Table 20: France Glyoxal Industry Volume (K Tons) Forecast, by Application 2019 & 2032
- Table 21: Italy Glyoxal Industry Revenue (Million) Forecast, by Application 2019 & 2032
- Table 22: Italy Glyoxal Industry Volume (K Tons) Forecast, by Application 2019 & 2032
- Table 23: United Kingdom Glyoxal Industry Revenue (Million) Forecast, by Application 2019 & 2032
- Table 24: United Kingdom Glyoxal Industry Volume (K Tons) Forecast, by Application 2019 & 2032
- Table 25: Netherlands Glyoxal Industry Revenue (Million) Forecast, by Application 2019 & 2032
- Table 26: Netherlands Glyoxal Industry Volume (K Tons) Forecast, by Application 2019 & 2032
- Table 27: Rest of Europe Glyoxal Industry Revenue (Million) Forecast, by Application 2019 & 2032
- Table 28: Rest of Europe Glyoxal Industry Volume (K Tons) Forecast, by Application 2019 & 2032
- Table 29: Global Glyoxal Industry Revenue Million Forecast, by Country 2019 & 2032
- Table 30: Global Glyoxal Industry Volume K Tons Forecast, by Country 2019 & 2032
- Table 31: China Glyoxal Industry Revenue (Million) Forecast, by Application 2019 & 2032
- Table 32: China Glyoxal Industry Volume (K Tons) Forecast, by Application 2019 & 2032
- Table 33: Japan Glyoxal Industry Revenue (Million) Forecast, by Application 2019 & 2032
- Table 34: Japan Glyoxal Industry Volume (K Tons) Forecast, by Application 2019 & 2032
- Table 35: India Glyoxal Industry Revenue (Million) Forecast, by Application 2019 & 2032
- Table 36: India Glyoxal Industry Volume (K Tons) Forecast, by Application 2019 & 2032
- Table 37: South Korea Glyoxal Industry Revenue (Million) Forecast, by Application 2019 & 2032
- Table 38: South Korea Glyoxal Industry Volume (K Tons) Forecast, by Application 2019 & 2032
- Table 39: Taiwan Glyoxal Industry Revenue (Million) Forecast, by Application 2019 & 2032
- Table 40: Taiwan Glyoxal Industry Volume (K Tons) Forecast, by Application 2019 & 2032
- Table 41: Australia Glyoxal Industry Revenue (Million) Forecast, by Application 2019 & 2032
- Table 42: Australia Glyoxal Industry Volume (K Tons) Forecast, by Application 2019 & 2032
- Table 43: Rest of Asia-Pacific Glyoxal Industry Revenue (Million) Forecast, by Application 2019 & 2032
- Table 44: Rest of Asia-Pacific Glyoxal Industry Volume (K Tons) Forecast, by Application 2019 & 2032
- Table 45: Global Glyoxal Industry Revenue Million Forecast, by Country 2019 & 2032
- Table 46: Global Glyoxal Industry Volume K Tons Forecast, by Country 2019 & 2032
- Table 47: Brazil Glyoxal Industry Revenue (Million) Forecast, by Application 2019 & 2032
- Table 48: Brazil Glyoxal Industry Volume (K Tons) Forecast, by Application 2019 & 2032
- Table 49: Argentina Glyoxal Industry Revenue (Million) Forecast, by Application 2019 & 2032
- Table 50: Argentina Glyoxal Industry Volume (K Tons) Forecast, by Application 2019 & 2032
- Table 51: Rest of South America Glyoxal Industry Revenue (Million) Forecast, by Application 2019 & 2032
- Table 52: Rest of South America Glyoxal Industry Volume (K Tons) Forecast, by Application 2019 & 2032
- Table 53: Global Glyoxal Industry Revenue Million Forecast, by Country 2019 & 2032
- Table 54: Global Glyoxal Industry Volume K Tons Forecast, by Country 2019 & 2032
- Table 55: Middle East Glyoxal Industry Revenue (Million) Forecast, by Application 2019 & 2032
- Table 56: Middle East Glyoxal Industry Volume (K Tons) Forecast, by Application 2019 & 2032
- Table 57: Africa Glyoxal Industry Revenue (Million) Forecast, by Application 2019 & 2032
- Table 58: Africa Glyoxal Industry Volume (K Tons) Forecast, by Application 2019 & 2032
- Table 59: Global Glyoxal Industry Revenue Million Forecast, by Application 2019 & 2032
- Table 60: Global Glyoxal Industry Volume K Tons Forecast, by Application 2019 & 2032
- Table 61: Global Glyoxal Industry Revenue Million Forecast, by Country 2019 & 2032
- Table 62: Global Glyoxal Industry Volume K Tons Forecast, by Country 2019 & 2032
- Table 63: China Glyoxal Industry Revenue (Million) Forecast, by Application 2019 & 2032
- Table 64: China Glyoxal Industry Volume (K Tons) Forecast, by Application 2019 & 2032
- Table 65: India Glyoxal Industry Revenue (Million) Forecast, by Application 2019 & 2032
- Table 66: India Glyoxal Industry Volume (K Tons) Forecast, by Application 2019 & 2032
- Table 67: Japan Glyoxal Industry Revenue (Million) Forecast, by Application 2019 & 2032
- Table 68: Japan Glyoxal Industry Volume (K Tons) Forecast, by Application 2019 & 2032
- Table 69: South Korea Glyoxal Industry Revenue (Million) Forecast, by Application 2019 & 2032
- Table 70: South Korea Glyoxal Industry Volume (K Tons) Forecast, by Application 2019 & 2032
- Table 71: Rest of Asia Pacific Glyoxal Industry Revenue (Million) Forecast, by Application 2019 & 2032
- Table 72: Rest of Asia Pacific Glyoxal Industry Volume (K Tons) Forecast, by Application 2019 & 2032
- Table 73: Global Glyoxal Industry Revenue Million Forecast, by Application 2019 & 2032
- Table 74: Global Glyoxal Industry Volume K Tons Forecast, by Application 2019 & 2032
- Table 75: Global Glyoxal Industry Revenue Million Forecast, by Country 2019 & 2032
- Table 76: Global Glyoxal Industry Volume K Tons Forecast, by Country 2019 & 2032
- Table 77: United States Glyoxal Industry Revenue (Million) Forecast, by Application 2019 & 2032
- Table 78: United States Glyoxal Industry Volume (K Tons) Forecast, by Application 2019 & 2032
- Table 79: Canada Glyoxal Industry Revenue (Million) Forecast, by Application 2019 & 2032
- Table 80: Canada Glyoxal Industry Volume (K Tons) Forecast, by Application 2019 & 2032
- Table 81: Mexico Glyoxal Industry Revenue (Million) Forecast, by Application 2019 & 2032
- Table 82: Mexico Glyoxal Industry Volume (K Tons) Forecast, by Application 2019 & 2032
- Table 83: Global Glyoxal Industry Revenue Million Forecast, by Application 2019 & 2032
- Table 84: Global Glyoxal Industry Volume K Tons Forecast, by Application 2019 & 2032
- Table 85: Global Glyoxal Industry Revenue Million Forecast, by Country 2019 & 2032
- Table 86: Global Glyoxal Industry Volume K Tons Forecast, by Country 2019 & 2032
- Table 87: Germany Glyoxal Industry Revenue (Million) Forecast, by Application 2019 & 2032
- Table 88: Germany Glyoxal Industry Volume (K Tons) Forecast, by Application 2019 & 2032
- Table 89: United Kingdom Glyoxal Industry Revenue (Million) Forecast, by Application 2019 & 2032
- Table 90: United Kingdom Glyoxal Industry Volume (K Tons) Forecast, by Application 2019 & 2032
- Table 91: Italy Glyoxal Industry Revenue (Million) Forecast, by Application 2019 & 2032
- Table 92: Italy Glyoxal Industry Volume (K Tons) Forecast, by Application 2019 & 2032
- Table 93: France Glyoxal Industry Revenue (Million) Forecast, by Application 2019 & 2032
- Table 94: France Glyoxal Industry Volume (K Tons) Forecast, by Application 2019 & 2032
- Table 95: Rest of Europe Glyoxal Industry Revenue (Million) Forecast, by Application 2019 & 2032
- Table 96: Rest of Europe Glyoxal Industry Volume (K Tons) Forecast, by Application 2019 & 2032
- Table 97: Global Glyoxal Industry Revenue Million Forecast, by Application 2019 & 2032
- Table 98: Global Glyoxal Industry Volume K Tons Forecast, by Application 2019 & 2032
- Table 99: Global Glyoxal Industry Revenue Million Forecast, by Country 2019 & 2032
- Table 100: Global Glyoxal Industry Volume K Tons Forecast, by Country 2019 & 2032
- Table 101: Brazil Glyoxal Industry Revenue (Million) Forecast, by Application 2019 & 2032
- Table 102: Brazil Glyoxal Industry Volume (K Tons) Forecast, by Application 2019 & 2032
- Table 103: Argentina Glyoxal Industry Revenue (Million) Forecast, by Application 2019 & 2032
- Table 104: Argentina Glyoxal Industry Volume (K Tons) Forecast, by Application 2019 & 2032
- Table 105: Rest of South America Glyoxal Industry Revenue (Million) Forecast, by Application 2019 & 2032
- Table 106: Rest of South America Glyoxal Industry Volume (K Tons) Forecast, by Application 2019 & 2032
- Table 107: Global Glyoxal Industry Revenue Million Forecast, by Application 2019 & 2032
- Table 108: Global Glyoxal Industry Volume K Tons Forecast, by Application 2019 & 2032
- Table 109: Global Glyoxal Industry Revenue Million Forecast, by Country 2019 & 2032
- Table 110: Global Glyoxal Industry Volume K Tons Forecast, by Country 2019 & 2032
- Table 111: Global Glyoxal Industry Revenue Million Forecast, by Application 2019 & 2032
- Table 112: Global Glyoxal Industry Volume K Tons Forecast, by Application 2019 & 2032
- Table 113: Global Glyoxal Industry Revenue Million Forecast, by Country 2019 & 2032
- Table 114: Global Glyoxal Industry Volume K Tons Forecast, by Country 2019 & 2032
- Table 115: South Africa Glyoxal Industry Revenue (Million) Forecast, by Application 2019 & 2032
- Table 116: South Africa Glyoxal Industry Volume (K Tons) Forecast, by Application 2019 & 2032
- Table 117: Rest of Middle East Glyoxal Industry Revenue (Million) Forecast, by Application 2019 & 2032
- Table 118: Rest of Middle East Glyoxal Industry Volume (K Tons) Forecast, by Application 2019 & 2032
Frequently Asked Questions
1. What is the projected Compound Annual Growth Rate (CAGR) of the Glyoxal Industry?
The projected CAGR is approximately 5.8%.
2. Which companies are prominent players in the Glyoxal Industry?
Key companies in the market include Haihang Industry, INEOS, Amzole India Pvt Ltd, Tokyo Chemical Industry Co Ltd, WeylChem International GmbH, BASF SE, Hubei Hongyuan Pharmaceutical Technology Co Ltd, Toronto Research Chemicals, Zhonglan Industry Co Ltd, Thermo Fisher Scientific.
3. What are the main segments of the Glyoxal Industry?
The market segments include Application.
4. Can you provide details about the market size?
The market size is estimated to be USD 308.12 Million as of 2022.
5. What are some drivers contributing to market growth?
; Increasing Applications of Glyoxal in Fabrics; Growing Demand for Glyoxal as an Intermediate.
6. What are the notable trends driving market growth?
Increasing Demand for Glyoxal as an Intermediate and Crosslinkers.
7. Are there any restraints impacting market growth?
; Associated Health Issues; Unfavorable Conditions Arising due to the Impact of COVID-19; Other Restraints.
8. Can you provide examples of recent developments in the market?
N/A
9. What pricing options are available for accessing the report?
Pricing options include single-user, multi-user, and enterprise licenses priced at USD 4750, USD 5250, and USD 8750 respectively.
10. Is the market size provided in terms of value or volume?
The market size is provided in terms of value, measured in Million and volume, measured in K Tons.
11. Are there any specific market keywords associated with the report?
Yes, the market keyword associated with the report is "Glyoxal Industry," which aids in identifying and referencing the specific market segment covered.
12. How do I determine which pricing option suits my needs best?
The pricing options vary based on user requirements and access needs. Individual users may opt for single-user licenses, while businesses requiring broader access may choose multi-user or enterprise licenses for cost-effective access to the report.
13. Are there any additional resources or data provided in the Glyoxal Industry report?
While the report offers comprehensive insights, it's advisable to review the specific contents or supplementary materials provided to ascertain if additional resources or data are available.
14. How can I stay updated on further developments or reports in the Glyoxal Industry?
To stay informed about further developments, trends, and reports in the Glyoxal Industry, consider subscribing to industry newsletters, following relevant companies and organizations, or regularly checking reputable industry news sources and publications.
Methodology
Step 1 - Identification of Relevant Samples Size from Population Database


Step 2 - Approaches for Defining Global Market Size (Value, Volume* & Price*)

Note*: In applicable scenarios
Step 3 - Data Sources
Primary Research
- Web Analytics
- Survey Reports
- Research Institute
- Latest Research Reports
- Opinion Leaders
Secondary Research
- Annual Reports
- White Paper
- Latest Press Release
- Industry Association
- Paid Database
- Investor Presentations

Step 4 - Data Triangulation
Involves using different sources of information in order to increase the validity of a study
These sources are likely to be stakeholders in a program - participants, other researchers, program staff, other community members, and so on.
Then we put all data in single framework & apply various statistical tools to find out the dynamic on the market.
During the analysis stage, feedback from the stakeholder groups would be compared to determine areas of agreement as well as areas of divergence


