
Key Insights
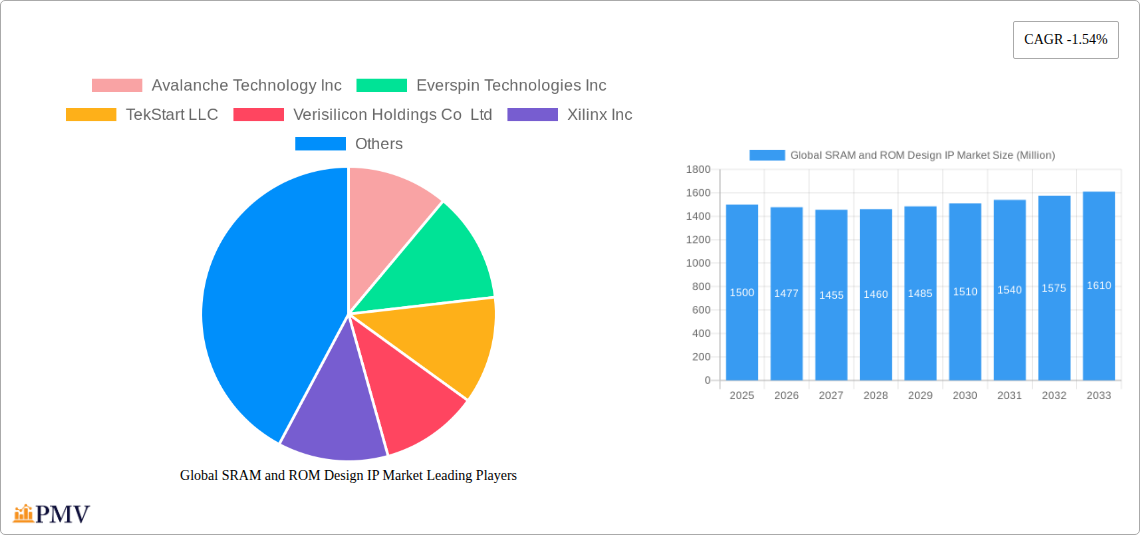
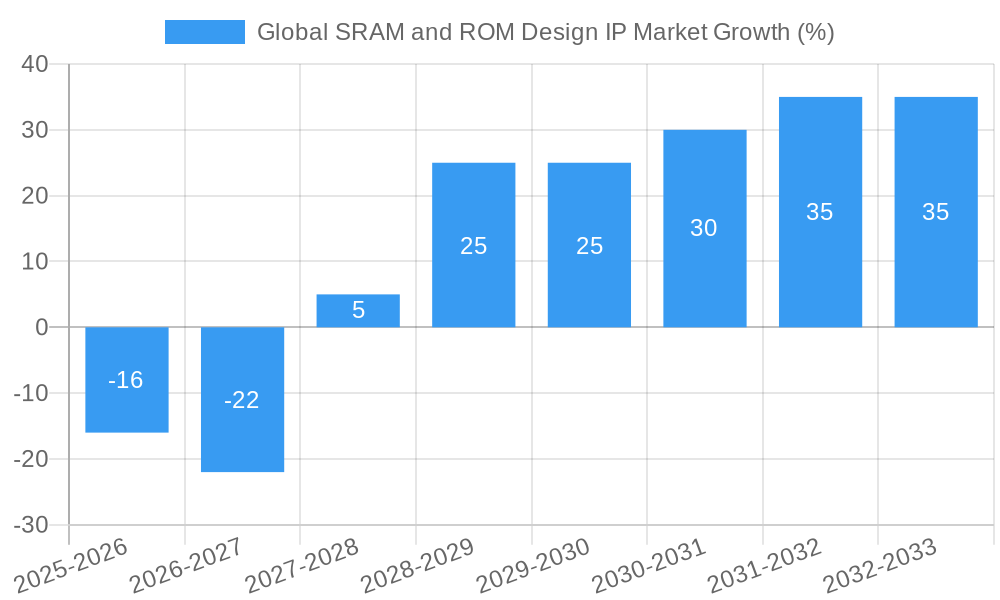
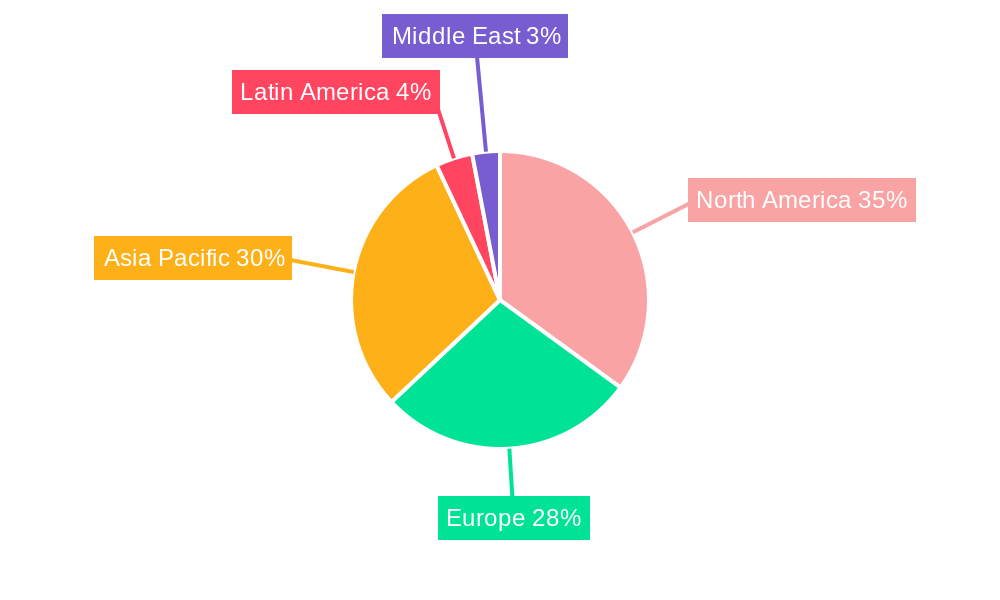
The global SRAM and ROM Design IP market, while exhibiting a slightly negative CAGR of -1.54% between 2019 and 2024, is poised for dynamic evolution in the coming years. The relatively low growth rate during the historical period might be attributed to several factors, including market saturation in certain segments and cyclical economic influences affecting investment in semiconductor design. However, the forecast period (2025-2033) presents opportunities driven by escalating demand for high-performance computing, particularly in the automotive and healthcare sectors. The increasing adoption of advanced driver-assistance systems (ADAS) in automobiles and the expansion of medical imaging and wearable technologies are key application drivers. Furthermore, the growing need for efficient and reliable memory solutions in diverse applications like consumer electronics, automation, and robotics will fuel market growth. Segmentation by component (CPU, GPU, NNP, etc.) reveals varying growth trajectories, with NNPs experiencing potentially rapid expansion given their role in AI and machine learning applications. The competitive landscape is characterized by a mix of established players like Xilinx, Arm Holdings, and Synopsys, alongside emerging companies specializing in niche technologies. Geographical analysis reveals varying market penetration levels across North America, Europe, and Asia Pacific, with the latter expected to show significant growth potential driven by robust technological advancements and expanding manufacturing capabilities.
The market's future trajectory hinges on several trends. The ongoing miniaturization of semiconductor components will create opportunities for design IP providers to develop more energy-efficient and high-density solutions. Furthermore, increasing collaboration between design IP providers and semiconductor manufacturers will facilitate faster innovation cycles. Conversely, potential restraints include the high cost of development and integration of advanced memory technologies and the challenge of meeting stringent regulatory standards in various application domains. Strategic alliances and partnerships will be crucial for market players to navigate these challenges and capture market share within the evolving landscape. Overall, while the historical data shows a modest decline, the anticipated growth drivers and evolving technological trends suggest a gradual upward trajectory for the global SRAM and ROM Design IP market in the coming decade.
Global SRAM and ROM Design IP Market: A Comprehensive Report (2019-2033)
This in-depth report provides a comprehensive analysis of the global SRAM and ROM Design IP market, offering invaluable insights for stakeholders across the semiconductor and electronics industries. Covering the period from 2019 to 2033, with 2025 as the base year, this report meticulously examines market structure, competitive dynamics, industry trends, and future growth prospects. The analysis incorporates detailed segmentation by component (CPU, GPU, NNP, Other) and application (Consumer Electronics, Automotive, Healthcare, Automation and Robotics, Other), providing a granular understanding of market opportunities and challenges. The report’s findings are supported by robust data analysis, including CAGR projections and market size estimations in Millions.
Global SRAM and ROM Design IP Market Market Structure & Competitive Dynamics
The global SRAM and ROM Design IP market exhibits a moderately concentrated structure, with several key players holding significant market share. The competitive landscape is characterized by intense innovation, driven by the constant demand for higher performance, lower power consumption, and smaller form factors in electronic devices. Regulatory frameworks, particularly those related to intellectual property protection and data security, play a crucial role in shaping market dynamics. The presence of substitute technologies, such as embedded memory solutions, presents ongoing competitive pressure. End-user trends, such as the increasing adoption of AI and IoT, are significantly influencing market growth. Mergers and acquisitions (M&A) activities have been relatively frequent, with deal values ranging from xx Million to xx Million in recent years, primarily focused on consolidating market share and acquiring specialized technologies. For example, the acquisition of [Company A] by [Company B] in 2022 resulted in a xx% increase in [Company B]'s market share in the [Specific Segment] segment. Key players actively engage in strategic partnerships and collaborations to expand their product portfolios and enhance their technological capabilities. The market concentration ratio (CRx) is estimated at xx% in 2025, indicating [description of market concentration based on the CRx value].
Global SRAM and ROM Design IP Market Industry Trends & Insights
The global SRAM and ROM Design IP market is experiencing robust growth, driven by several key factors. The increasing demand for high-performance computing, particularly in data centers and cloud computing environments, is a significant driver. The proliferation of smart devices, autonomous vehicles, and advanced medical equipment fuels the demand for efficient and high-capacity memory solutions. Technological advancements, such as the development of advanced memory architectures and process nodes, are enhancing performance and reducing power consumption. Consumer preferences for smaller, faster, and more energy-efficient electronic devices are also driving the demand for advanced memory solutions. Competitive dynamics are characterized by continuous innovation, with companies focusing on differentiating their products through improved performance, reduced power consumption, and enhanced security features. The market is expected to witness a CAGR of xx% during the forecast period (2025-2033), with a market penetration rate of xx% by 2033 in the [Specific Region/Application]. The increasing adoption of AI and machine learning applications will further accelerate market growth, leading to increased demand for specialized memory solutions, such as those optimized for neural network processors.
Dominant Markets & Segments in Global SRAM and ROM Design IP Market
The North American region currently holds the dominant position in the global SRAM and ROM Design IP market, driven by a strong presence of major technology companies and substantial investments in R&D. Within the application segments, consumer electronics constitutes the largest market share, followed by the automotive sector which is experiencing significant growth due to the increasing adoption of advanced driver-assistance systems (ADAS) and autonomous vehicles.
Key Drivers for Dominant Regions/Segments:
- North America: Strong R&D investments, presence of major technology companies, favorable regulatory environment.
- Consumer Electronics: High volume of smart devices, increasing demand for high-performance memory.
- Automotive: Rapid adoption of ADAS and autonomous vehicles, increasing demand for reliable and high-performance memory solutions.
Dominance Analysis: North America's dominance stems from a concentration of leading semiconductor companies and robust investment in research and development. The consumer electronics segment's large market share reflects the ubiquity of smart devices, while automotive is a rapidly growing segment fueled by technological advancements in the sector. The significant market size of these regions and application segments presents lucrative opportunities for market participants.
Global SRAM and ROM Design IP Market Product Innovations
Recent product innovations in the SRAM and ROM Design IP market center around advancements in low-power designs, higher density solutions, and improved security features. Companies are focusing on developing memory solutions optimized for specific applications, such as AI and machine learning, offering specialized architectures and interfaces for enhanced performance and efficiency. These innovations are enhancing the competitive landscape by enabling higher levels of integration, smaller form factors, and enhanced data security. The market trend indicates a shift toward advanced memory technologies, particularly those incorporating high-bandwidth memory and 3D stacking techniques.
Report Segmentation & Scope
The report segments the global SRAM and ROM Design IP market by component: Central Processing Unit (CPU), Graphics Processing Unit (GPU), Neural Processing Unit (NNP), and Other Components. Each segment's growth is projected based on its specific application demands and technological advancements. The market is further segmented by application: Consumer Electronics, Automotive, Healthcare, Automation and Robotics, and Other Applications. Each application segment's growth projection considers factors like market size, technological trends, and regulatory landscape. The competitive dynamics within each segment vary based on the level of technological maturity and the presence of specialized players. The report offers detailed market size estimates and growth projections for each segment, accompanied by an in-depth analysis of competitive landscape and market trends.
Key Drivers of Global SRAM and ROM Design IP Market Growth
Several factors are driving the growth of the global SRAM and ROM Design IP market. Technological advancements, such as the development of advanced memory architectures and smaller process nodes, lead to higher performance, lower power consumption, and increased density. The increasing adoption of AI, machine learning, and IoT applications fuels the demand for high-performance memory solutions. Furthermore, favorable economic conditions and government support for technology advancements contribute to market expansion. The rising demand for high-bandwidth memory in data centers and cloud computing also propels market growth.
Challenges in the Global SRAM and ROM Design IP Market Sector
Despite significant growth potential, the SRAM and ROM Design IP market faces several challenges. Intellectual property (IP) protection and security concerns require robust security measures, increasing development costs. Supply chain disruptions and component shortages can significantly impact production and lead times. Intense competition and the need for continuous innovation necessitate significant investments in R&D, posing a financial challenge for smaller players. Furthermore, evolving regulatory standards and compliance requirements add complexity to product development and market entry. These challenges can collectively impact the overall market growth and profitability.
Leading Players in the Global SRAM and ROM Design IP Market Market
- Avalanche Technology Inc
- Everspin Technologies Inc
- TekStart LLC
- Verisilicon Holdings Co Ltd
- Xilinx Inc
- Dolphin Design SAS
- Arm Holdings
- Dolphin Technology Inc
- Surecore Ltd
- Renesas Electronics Corporation
- Synopsys Inc
- TDK Corporation
- eMemory Technology Inc
- Mentor Graphics Corporation
Key Developments in Global SRAM and ROM Design IP Market Sector
- January 2023: Synopsys Inc. announced a new low-power SRAM IP solution for mobile applications.
- March 2022: Arm Holdings partnered with a leading foundry to develop a high-performance ROM IP solution.
- June 2021: Renesas Electronics Corporation acquired a smaller memory IP company, expanding its product portfolio.
- September 2020: Xilinx Inc. launched a new generation of high-density SRAM IP. (Further development details would be added here, specific to the years and months.)
Strategic Global SRAM and ROM Design IP Market Market Outlook
The future of the SRAM and ROM Design IP market appears promising, with continuous growth driven by technological advancements and the increasing demand for high-performance computing. Strategic opportunities lie in developing specialized memory solutions for emerging applications such as AI, 5G, and autonomous vehicles. Companies focusing on innovation, strategic partnerships, and efficient supply chain management are expected to gain a competitive edge. The market's long-term outlook is positive, with substantial growth potential across various segments and geographical regions. Continued investment in R&D and the development of advanced memory technologies will be crucial for sustained market expansion.
Global SRAM and ROM Design IP Market Segmentation
-
1. Type
- 1.1. High-density SRAM
- 1.2. Low-power SRAM
- 1.3. ROM
-
2. Application
- 2.1. Consumer Electronics
- 2.2. Automotive
- 2.3. Industrial
- 2.4. Enterprise/Data Center
-
3. Geography
- 3.1. North America
- 3.2. Asia-Pacific
- 3.3. Europe
- 3.4. Other Regions
Global SRAM and ROM Design IP Market Segmentation By Geography
-
1. North America
- 1.1. United States
- 1.2. Canada
- 1.3. Mexico
-
2. South America
- 2.1. Brazil
- 2.2. Argentina
- 2.3. Rest of South America
-
3. Europe
- 3.1. United Kingdom
- 3.2. Germany
- 3.3. France
- 3.4. Italy
- 3.5. Spain
- 3.6. Russia
- 3.7. Benelux
- 3.8. Nordics
- 3.9. Rest of Europe
-
4. Middle East & Africa
- 4.1. Turkey
- 4.2. Israel
- 4.3. GCC
- 4.4. North Africa
- 4.5. South Africa
- 4.6. Rest of Middle East & Africa
-
5. Asia Pacific
- 5.1. China
- 5.2. India
- 5.3. Japan
- 5.4. South Korea
- 5.5. ASEAN
- 5.6. Oceania
- 5.7. Rest of Asia Pacific
Global SRAM and ROM Design IP Market REPORT HIGHLIGHTS
| Aspects | Details |
|---|---|
| Study Period | 2019-2033 |
| Base Year | 2024 |
| Estimated Year | 2025 |
| Forecast Period | 2025-2033 |
| Historical Period | 2019-2024 |
| Growth Rate | CAGR of -1.54% from 2019-2033 |
| Segmentation |
|
Table of Contents
- 1. Introduction
- 1.1. Research Scope
- 1.2. Market Segmentation
- 1.3. Research Methodology
- 1.4. Definitions and Assumptions
- 2. Executive Summary
- 2.1. Introduction
- 3. Market Dynamics
- 3.1. Introduction
- 3.2. Market Drivers
- 3.2.1. Increase in Demand for Autonomous Driving Technology; Growth in Edge Analytics for IoT Application
- 3.3. Market Restrains
- 3.3.1. Complexity in Design and AI Interface
- 3.4. Market Trends
- 3.4.1. Increasing Demand For Enterprise Storage Applications to Drive the Growth for MRAM
- 4. Market Factor Analysis
- 4.1. Porters Five Forces
- 4.2. Supply/Value Chain
- 4.3. PESTEL analysis
- 4.4. Market Entropy
- 4.5. Patent/Trademark Analysis
- 5. Global SRAM and ROM Design IP Market Analysis, Insights and Forecast, 2019-2031
- 5.1. Market Analysis, Insights and Forecast - by Type
- 5.1.1. High-density SRAM
- 5.1.2. Low-power SRAM
- 5.1.3. ROM
- 5.2. Market Analysis, Insights and Forecast - by Application
- 5.2.1. Consumer Electronics
- 5.2.2. Automotive
- 5.2.3. Industrial
- 5.2.4. Enterprise/Data Center
- 5.3. Market Analysis, Insights and Forecast - by Geography
- 5.3.1. North America
- 5.3.2. Asia-Pacific
- 5.3.3. Europe
- 5.3.4. Other Regions
- 5.4. Market Analysis, Insights and Forecast - by Region
- 5.4.1. North America
- 5.4.2. South America
- 5.4.3. Europe
- 5.4.4. Middle East & Africa
- 5.4.5. Asia Pacific
- 5.1. Market Analysis, Insights and Forecast - by Type
- 6. North America Global SRAM and ROM Design IP Market Analysis, Insights and Forecast, 2019-2031
- 6.1. Market Analysis, Insights and Forecast - by Type
- 6.1.1. High-density SRAM
- 6.1.2. Low-power SRAM
- 6.1.3. ROM
- 6.2. Market Analysis, Insights and Forecast - by Application
- 6.2.1. Consumer Electronics
- 6.2.2. Automotive
- 6.2.3. Industrial
- 6.2.4. Enterprise/Data Center
- 6.3. Market Analysis, Insights and Forecast - by Geography
- 6.3.1. North America
- 6.3.2. Asia-Pacific
- 6.3.3. Europe
- 6.3.4. Other Regions
- 6.1. Market Analysis, Insights and Forecast - by Type
- 7. South America Global SRAM and ROM Design IP Market Analysis, Insights and Forecast, 2019-2031
- 7.1. Market Analysis, Insights and Forecast - by Type
- 7.1.1. High-density SRAM
- 7.1.2. Low-power SRAM
- 7.1.3. ROM
- 7.2. Market Analysis, Insights and Forecast - by Application
- 7.2.1. Consumer Electronics
- 7.2.2. Automotive
- 7.2.3. Industrial
- 7.2.4. Enterprise/Data Center
- 7.3. Market Analysis, Insights and Forecast - by Geography
- 7.3.1. North America
- 7.3.2. Asia-Pacific
- 7.3.3. Europe
- 7.3.4. Other Regions
- 7.1. Market Analysis, Insights and Forecast - by Type
- 8. Europe Global SRAM and ROM Design IP Market Analysis, Insights and Forecast, 2019-2031
- 8.1. Market Analysis, Insights and Forecast - by Type
- 8.1.1. High-density SRAM
- 8.1.2. Low-power SRAM
- 8.1.3. ROM
- 8.2. Market Analysis, Insights and Forecast - by Application
- 8.2.1. Consumer Electronics
- 8.2.2. Automotive
- 8.2.3. Industrial
- 8.2.4. Enterprise/Data Center
- 8.3. Market Analysis, Insights and Forecast - by Geography
- 8.3.1. North America
- 8.3.2. Asia-Pacific
- 8.3.3. Europe
- 8.3.4. Other Regions
- 8.1. Market Analysis, Insights and Forecast - by Type
- 9. Middle East & Africa Global SRAM and ROM Design IP Market Analysis, Insights and Forecast, 2019-2031
- 9.1. Market Analysis, Insights and Forecast - by Type
- 9.1.1. High-density SRAM
- 9.1.2. Low-power SRAM
- 9.1.3. ROM
- 9.2. Market Analysis, Insights and Forecast - by Application
- 9.2.1. Consumer Electronics
- 9.2.2. Automotive
- 9.2.3. Industrial
- 9.2.4. Enterprise/Data Center
- 9.3. Market Analysis, Insights and Forecast - by Geography
- 9.3.1. North America
- 9.3.2. Asia-Pacific
- 9.3.3. Europe
- 9.3.4. Other Regions
- 9.1. Market Analysis, Insights and Forecast - by Type
- 10. Asia Pacific Global SRAM and ROM Design IP Market Analysis, Insights and Forecast, 2019-2031
- 10.1. Market Analysis, Insights and Forecast - by Type
- 10.1.1. High-density SRAM
- 10.1.2. Low-power SRAM
- 10.1.3. ROM
- 10.2. Market Analysis, Insights and Forecast - by Application
- 10.2.1. Consumer Electronics
- 10.2.2. Automotive
- 10.2.3. Industrial
- 10.2.4. Enterprise/Data Center
- 10.3. Market Analysis, Insights and Forecast - by Geography
- 10.3.1. North America
- 10.3.2. Asia-Pacific
- 10.3.3. Europe
- 10.3.4. Other Regions
- 10.1. Market Analysis, Insights and Forecast - by Type
- 11. North America Global SRAM and ROM Design IP Market Analysis, Insights and Forecast, 2019-2031
- 11.1. Market Analysis, Insights and Forecast - By Country/Sub-region
- 11.1.1.
- 12. Europe Global SRAM and ROM Design IP Market Analysis, Insights and Forecast, 2019-2031
- 12.1. Market Analysis, Insights and Forecast - By Country/Sub-region
- 12.1.1.
- 13. Asia Pacific Global SRAM and ROM Design IP Market Analysis, Insights and Forecast, 2019-2031
- 13.1. Market Analysis, Insights and Forecast - By Country/Sub-region
- 13.1.1.
- 14. Latin America Global SRAM and ROM Design IP Market Analysis, Insights and Forecast, 2019-2031
- 14.1. Market Analysis, Insights and Forecast - By Country/Sub-region
- 14.1.1.
- 15. Middle East Global SRAM and ROM Design IP Market Analysis, Insights and Forecast, 2019-2031
- 15.1. Market Analysis, Insights and Forecast - By Country/Sub-region
- 15.1.1.
- 16. Competitive Analysis
- 16.1. Market Share Analysis 2024
- 16.2. Company Profiles
- 16.2.1 Avalanche Technology Inc
- 16.2.1.1. Overview
- 16.2.1.2. Products
- 16.2.1.3. SWOT Analysis
- 16.2.1.4. Recent Developments
- 16.2.1.5. Financials (Based on Availability)
- 16.2.2 Everspin Technologies Inc
- 16.2.2.1. Overview
- 16.2.2.2. Products
- 16.2.2.3. SWOT Analysis
- 16.2.2.4. Recent Developments
- 16.2.2.5. Financials (Based on Availability)
- 16.2.3 TekStart LLC
- 16.2.3.1. Overview
- 16.2.3.2. Products
- 16.2.3.3. SWOT Analysis
- 16.2.3.4. Recent Developments
- 16.2.3.5. Financials (Based on Availability)
- 16.2.4 Verisilicon Holdings Co Ltd
- 16.2.4.1. Overview
- 16.2.4.2. Products
- 16.2.4.3. SWOT Analysis
- 16.2.4.4. Recent Developments
- 16.2.4.5. Financials (Based on Availability)
- 16.2.5 Xilinx Inc
- 16.2.5.1. Overview
- 16.2.5.2. Products
- 16.2.5.3. SWOT Analysis
- 16.2.5.4. Recent Developments
- 16.2.5.5. Financials (Based on Availability)
- 16.2.6 Dolphin Design SAS
- 16.2.6.1. Overview
- 16.2.6.2. Products
- 16.2.6.3. SWOT Analysis
- 16.2.6.4. Recent Developments
- 16.2.6.5. Financials (Based on Availability)
- 16.2.7 Arm Holdings
- 16.2.7.1. Overview
- 16.2.7.2. Products
- 16.2.7.3. SWOT Analysis
- 16.2.7.4. Recent Developments
- 16.2.7.5. Financials (Based on Availability)
- 16.2.8 Dolphin Technology Inc
- 16.2.8.1. Overview
- 16.2.8.2. Products
- 16.2.8.3. SWOT Analysis
- 16.2.8.4. Recent Developments
- 16.2.8.5. Financials (Based on Availability)
- 16.2.9 Surecore Ltd
- 16.2.9.1. Overview
- 16.2.9.2. Products
- 16.2.9.3. SWOT Analysis
- 16.2.9.4. Recent Developments
- 16.2.9.5. Financials (Based on Availability)
- 16.2.10 Renesas Electronics Corporation
- 16.2.10.1. Overview
- 16.2.10.2. Products
- 16.2.10.3. SWOT Analysis
- 16.2.10.4. Recent Developments
- 16.2.10.5. Financials (Based on Availability)
- 16.2.11 Synopsys Inc
- 16.2.11.1. Overview
- 16.2.11.2. Products
- 16.2.11.3. SWOT Analysis
- 16.2.11.4. Recent Developments
- 16.2.11.5. Financials (Based on Availability)
- 16.2.12 TDK Corporation
- 16.2.12.1. Overview
- 16.2.12.2. Products
- 16.2.12.3. SWOT Analysis
- 16.2.12.4. Recent Developments
- 16.2.12.5. Financials (Based on Availability)
- 16.2.13 eMemory Technology Inc
- 16.2.13.1. Overview
- 16.2.13.2. Products
- 16.2.13.3. SWOT Analysis
- 16.2.13.4. Recent Developments
- 16.2.13.5. Financials (Based on Availability)
- 16.2.14 Mentor Graphics Corporation
- 16.2.14.1. Overview
- 16.2.14.2. Products
- 16.2.14.3. SWOT Analysis
- 16.2.14.4. Recent Developments
- 16.2.14.5. Financials (Based on Availability)
- 16.2.1 Avalanche Technology Inc
List of Figures
- Figure 1: Global Global SRAM and ROM Design IP Market Revenue Breakdown (Million, %) by Region 2024 & 2032
- Figure 2: Global Global SRAM and ROM Design IP Market Volume Breakdown (K Unit, %) by Region 2024 & 2032
- Figure 3: North America Global SRAM and ROM Design IP Market Revenue (Million), by Country 2024 & 2032
- Figure 4: North America Global SRAM and ROM Design IP Market Volume (K Unit), by Country 2024 & 2032
- Figure 5: North America Global SRAM and ROM Design IP Market Revenue Share (%), by Country 2024 & 2032
- Figure 6: North America Global SRAM and ROM Design IP Market Volume Share (%), by Country 2024 & 2032
- Figure 7: Europe Global SRAM and ROM Design IP Market Revenue (Million), by Country 2024 & 2032
- Figure 8: Europe Global SRAM and ROM Design IP Market Volume (K Unit), by Country 2024 & 2032
- Figure 9: Europe Global SRAM and ROM Design IP Market Revenue Share (%), by Country 2024 & 2032
- Figure 10: Europe Global SRAM and ROM Design IP Market Volume Share (%), by Country 2024 & 2032
- Figure 11: Asia Pacific Global SRAM and ROM Design IP Market Revenue (Million), by Country 2024 & 2032
- Figure 12: Asia Pacific Global SRAM and ROM Design IP Market Volume (K Unit), by Country 2024 & 2032
- Figure 13: Asia Pacific Global SRAM and ROM Design IP Market Revenue Share (%), by Country 2024 & 2032
- Figure 14: Asia Pacific Global SRAM and ROM Design IP Market Volume Share (%), by Country 2024 & 2032
- Figure 15: Latin America Global SRAM and ROM Design IP Market Revenue (Million), by Country 2024 & 2032
- Figure 16: Latin America Global SRAM and ROM Design IP Market Volume (K Unit), by Country 2024 & 2032
- Figure 17: Latin America Global SRAM and ROM Design IP Market Revenue Share (%), by Country 2024 & 2032
- Figure 18: Latin America Global SRAM and ROM Design IP Market Volume Share (%), by Country 2024 & 2032
- Figure 19: Middle East Global SRAM and ROM Design IP Market Revenue (Million), by Country 2024 & 2032
- Figure 20: Middle East Global SRAM and ROM Design IP Market Volume (K Unit), by Country 2024 & 2032
- Figure 21: Middle East Global SRAM and ROM Design IP Market Revenue Share (%), by Country 2024 & 2032
- Figure 22: Middle East Global SRAM and ROM Design IP Market Volume Share (%), by Country 2024 & 2032
- Figure 23: North America Global SRAM and ROM Design IP Market Revenue (Million), by Type 2024 & 2032
- Figure 24: North America Global SRAM and ROM Design IP Market Volume (K Unit), by Type 2024 & 2032
- Figure 25: North America Global SRAM and ROM Design IP Market Revenue Share (%), by Type 2024 & 2032
- Figure 26: North America Global SRAM and ROM Design IP Market Volume Share (%), by Type 2024 & 2032
- Figure 27: North America Global SRAM and ROM Design IP Market Revenue (Million), by Application 2024 & 2032
- Figure 28: North America Global SRAM and ROM Design IP Market Volume (K Unit), by Application 2024 & 2032
- Figure 29: North America Global SRAM and ROM Design IP Market Revenue Share (%), by Application 2024 & 2032
- Figure 30: North America Global SRAM and ROM Design IP Market Volume Share (%), by Application 2024 & 2032
- Figure 31: North America Global SRAM and ROM Design IP Market Revenue (Million), by Geography 2024 & 2032
- Figure 32: North America Global SRAM and ROM Design IP Market Volume (K Unit), by Geography 2024 & 2032
- Figure 33: North America Global SRAM and ROM Design IP Market Revenue Share (%), by Geography 2024 & 2032
- Figure 34: North America Global SRAM and ROM Design IP Market Volume Share (%), by Geography 2024 & 2032
- Figure 35: North America Global SRAM and ROM Design IP Market Revenue (Million), by Country 2024 & 2032
- Figure 36: North America Global SRAM and ROM Design IP Market Volume (K Unit), by Country 2024 & 2032
- Figure 37: North America Global SRAM and ROM Design IP Market Revenue Share (%), by Country 2024 & 2032
- Figure 38: North America Global SRAM and ROM Design IP Market Volume Share (%), by Country 2024 & 2032
- Figure 39: South America Global SRAM and ROM Design IP Market Revenue (Million), by Type 2024 & 2032
- Figure 40: South America Global SRAM and ROM Design IP Market Volume (K Unit), by Type 2024 & 2032
- Figure 41: South America Global SRAM and ROM Design IP Market Revenue Share (%), by Type 2024 & 2032
- Figure 42: South America Global SRAM and ROM Design IP Market Volume Share (%), by Type 2024 & 2032
- Figure 43: South America Global SRAM and ROM Design IP Market Revenue (Million), by Application 2024 & 2032
- Figure 44: South America Global SRAM and ROM Design IP Market Volume (K Unit), by Application 2024 & 2032
- Figure 45: South America Global SRAM and ROM Design IP Market Revenue Share (%), by Application 2024 & 2032
- Figure 46: South America Global SRAM and ROM Design IP Market Volume Share (%), by Application 2024 & 2032
- Figure 47: South America Global SRAM and ROM Design IP Market Revenue (Million), by Geography 2024 & 2032
- Figure 48: South America Global SRAM and ROM Design IP Market Volume (K Unit), by Geography 2024 & 2032
- Figure 49: South America Global SRAM and ROM Design IP Market Revenue Share (%), by Geography 2024 & 2032
- Figure 50: South America Global SRAM and ROM Design IP Market Volume Share (%), by Geography 2024 & 2032
- Figure 51: South America Global SRAM and ROM Design IP Market Revenue (Million), by Country 2024 & 2032
- Figure 52: South America Global SRAM and ROM Design IP Market Volume (K Unit), by Country 2024 & 2032
- Figure 53: South America Global SRAM and ROM Design IP Market Revenue Share (%), by Country 2024 & 2032
- Figure 54: South America Global SRAM and ROM Design IP Market Volume Share (%), by Country 2024 & 2032
- Figure 55: Europe Global SRAM and ROM Design IP Market Revenue (Million), by Type 2024 & 2032
- Figure 56: Europe Global SRAM and ROM Design IP Market Volume (K Unit), by Type 2024 & 2032
- Figure 57: Europe Global SRAM and ROM Design IP Market Revenue Share (%), by Type 2024 & 2032
- Figure 58: Europe Global SRAM and ROM Design IP Market Volume Share (%), by Type 2024 & 2032
- Figure 59: Europe Global SRAM and ROM Design IP Market Revenue (Million), by Application 2024 & 2032
- Figure 60: Europe Global SRAM and ROM Design IP Market Volume (K Unit), by Application 2024 & 2032
- Figure 61: Europe Global SRAM and ROM Design IP Market Revenue Share (%), by Application 2024 & 2032
- Figure 62: Europe Global SRAM and ROM Design IP Market Volume Share (%), by Application 2024 & 2032
- Figure 63: Europe Global SRAM and ROM Design IP Market Revenue (Million), by Geography 2024 & 2032
- Figure 64: Europe Global SRAM and ROM Design IP Market Volume (K Unit), by Geography 2024 & 2032
- Figure 65: Europe Global SRAM and ROM Design IP Market Revenue Share (%), by Geography 2024 & 2032
- Figure 66: Europe Global SRAM and ROM Design IP Market Volume Share (%), by Geography 2024 & 2032
- Figure 67: Europe Global SRAM and ROM Design IP Market Revenue (Million), by Country 2024 & 2032
- Figure 68: Europe Global SRAM and ROM Design IP Market Volume (K Unit), by Country 2024 & 2032
- Figure 69: Europe Global SRAM and ROM Design IP Market Revenue Share (%), by Country 2024 & 2032
- Figure 70: Europe Global SRAM and ROM Design IP Market Volume Share (%), by Country 2024 & 2032
- Figure 71: Middle East & Africa Global SRAM and ROM Design IP Market Revenue (Million), by Type 2024 & 2032
- Figure 72: Middle East & Africa Global SRAM and ROM Design IP Market Volume (K Unit), by Type 2024 & 2032
- Figure 73: Middle East & Africa Global SRAM and ROM Design IP Market Revenue Share (%), by Type 2024 & 2032
- Figure 74: Middle East & Africa Global SRAM and ROM Design IP Market Volume Share (%), by Type 2024 & 2032
- Figure 75: Middle East & Africa Global SRAM and ROM Design IP Market Revenue (Million), by Application 2024 & 2032
- Figure 76: Middle East & Africa Global SRAM and ROM Design IP Market Volume (K Unit), by Application 2024 & 2032
- Figure 77: Middle East & Africa Global SRAM and ROM Design IP Market Revenue Share (%), by Application 2024 & 2032
- Figure 78: Middle East & Africa Global SRAM and ROM Design IP Market Volume Share (%), by Application 2024 & 2032
- Figure 79: Middle East & Africa Global SRAM and ROM Design IP Market Revenue (Million), by Geography 2024 & 2032
- Figure 80: Middle East & Africa Global SRAM and ROM Design IP Market Volume (K Unit), by Geography 2024 & 2032
- Figure 81: Middle East & Africa Global SRAM and ROM Design IP Market Revenue Share (%), by Geography 2024 & 2032
- Figure 82: Middle East & Africa Global SRAM and ROM Design IP Market Volume Share (%), by Geography 2024 & 2032
- Figure 83: Middle East & Africa Global SRAM and ROM Design IP Market Revenue (Million), by Country 2024 & 2032
- Figure 84: Middle East & Africa Global SRAM and ROM Design IP Market Volume (K Unit), by Country 2024 & 2032
- Figure 85: Middle East & Africa Global SRAM and ROM Design IP Market Revenue Share (%), by Country 2024 & 2032
- Figure 86: Middle East & Africa Global SRAM and ROM Design IP Market Volume Share (%), by Country 2024 & 2032
- Figure 87: Asia Pacific Global SRAM and ROM Design IP Market Revenue (Million), by Type 2024 & 2032
- Figure 88: Asia Pacific Global SRAM and ROM Design IP Market Volume (K Unit), by Type 2024 & 2032
- Figure 89: Asia Pacific Global SRAM and ROM Design IP Market Revenue Share (%), by Type 2024 & 2032
- Figure 90: Asia Pacific Global SRAM and ROM Design IP Market Volume Share (%), by Type 2024 & 2032
- Figure 91: Asia Pacific Global SRAM and ROM Design IP Market Revenue (Million), by Application 2024 & 2032
- Figure 92: Asia Pacific Global SRAM and ROM Design IP Market Volume (K Unit), by Application 2024 & 2032
- Figure 93: Asia Pacific Global SRAM and ROM Design IP Market Revenue Share (%), by Application 2024 & 2032
- Figure 94: Asia Pacific Global SRAM and ROM Design IP Market Volume Share (%), by Application 2024 & 2032
- Figure 95: Asia Pacific Global SRAM and ROM Design IP Market Revenue (Million), by Geography 2024 & 2032
- Figure 96: Asia Pacific Global SRAM and ROM Design IP Market Volume (K Unit), by Geography 2024 & 2032
- Figure 97: Asia Pacific Global SRAM and ROM Design IP Market Revenue Share (%), by Geography 2024 & 2032
- Figure 98: Asia Pacific Global SRAM and ROM Design IP Market Volume Share (%), by Geography 2024 & 2032
- Figure 99: Asia Pacific Global SRAM and ROM Design IP Market Revenue (Million), by Country 2024 & 2032
- Figure 100: Asia Pacific Global SRAM and ROM Design IP Market Volume (K Unit), by Country 2024 & 2032
- Figure 101: Asia Pacific Global SRAM and ROM Design IP Market Revenue Share (%), by Country 2024 & 2032
- Figure 102: Asia Pacific Global SRAM and ROM Design IP Market Volume Share (%), by Country 2024 & 2032
List of Tables
- Table 1: Global SRAM and ROM Design IP Market Revenue Million Forecast, by Region 2019 & 2032
- Table 2: Global SRAM and ROM Design IP Market Volume K Unit Forecast, by Region 2019 & 2032
- Table 3: Global SRAM and ROM Design IP Market Revenue Million Forecast, by Type 2019 & 2032
- Table 4: Global SRAM and ROM Design IP Market Volume K Unit Forecast, by Type 2019 & 2032
- Table 5: Global SRAM and ROM Design IP Market Revenue Million Forecast, by Application 2019 & 2032
- Table 6: Global SRAM and ROM Design IP Market Volume K Unit Forecast, by Application 2019 & 2032
- Table 7: Global SRAM and ROM Design IP Market Revenue Million Forecast, by Geography 2019 & 2032
- Table 8: Global SRAM and ROM Design IP Market Volume K Unit Forecast, by Geography 2019 & 2032
- Table 9: Global SRAM and ROM Design IP Market Revenue Million Forecast, by Region 2019 & 2032
- Table 10: Global SRAM and ROM Design IP Market Volume K Unit Forecast, by Region 2019 & 2032
- Table 11: Global SRAM and ROM Design IP Market Revenue Million Forecast, by Country 2019 & 2032
- Table 12: Global SRAM and ROM Design IP Market Volume K Unit Forecast, by Country 2019 & 2032
- Table 13: Global SRAM and ROM Design IP Market Revenue (Million) Forecast, by Application 2019 & 2032
- Table 14: Global SRAM and ROM Design IP Market Volume (K Unit) Forecast, by Application 2019 & 2032
- Table 15: Global SRAM and ROM Design IP Market Revenue Million Forecast, by Country 2019 & 2032
- Table 16: Global SRAM and ROM Design IP Market Volume K Unit Forecast, by Country 2019 & 2032
- Table 17: Global SRAM and ROM Design IP Market Revenue (Million) Forecast, by Application 2019 & 2032
- Table 18: Global SRAM and ROM Design IP Market Volume (K Unit) Forecast, by Application 2019 & 2032
- Table 19: Global SRAM and ROM Design IP Market Revenue Million Forecast, by Country 2019 & 2032
- Table 20: Global SRAM and ROM Design IP Market Volume K Unit Forecast, by Country 2019 & 2032
- Table 21: Global SRAM and ROM Design IP Market Revenue (Million) Forecast, by Application 2019 & 2032
- Table 22: Global SRAM and ROM Design IP Market Volume (K Unit) Forecast, by Application 2019 & 2032
- Table 23: Global SRAM and ROM Design IP Market Revenue Million Forecast, by Country 2019 & 2032
- Table 24: Global SRAM and ROM Design IP Market Volume K Unit Forecast, by Country 2019 & 2032
- Table 25: Global SRAM and ROM Design IP Market Revenue (Million) Forecast, by Application 2019 & 2032
- Table 26: Global SRAM and ROM Design IP Market Volume (K Unit) Forecast, by Application 2019 & 2032
- Table 27: Global SRAM and ROM Design IP Market Revenue Million Forecast, by Country 2019 & 2032
- Table 28: Global SRAM and ROM Design IP Market Volume K Unit Forecast, by Country 2019 & 2032
- Table 29: Global SRAM and ROM Design IP Market Revenue (Million) Forecast, by Application 2019 & 2032
- Table 30: Global SRAM and ROM Design IP Market Volume (K Unit) Forecast, by Application 2019 & 2032
- Table 31: Global SRAM and ROM Design IP Market Revenue Million Forecast, by Type 2019 & 2032
- Table 32: Global SRAM and ROM Design IP Market Volume K Unit Forecast, by Type 2019 & 2032
- Table 33: Global SRAM and ROM Design IP Market Revenue Million Forecast, by Application 2019 & 2032
- Table 34: Global SRAM and ROM Design IP Market Volume K Unit Forecast, by Application 2019 & 2032
- Table 35: Global SRAM and ROM Design IP Market Revenue Million Forecast, by Geography 2019 & 2032
- Table 36: Global SRAM and ROM Design IP Market Volume K Unit Forecast, by Geography 2019 & 2032
- Table 37: Global SRAM and ROM Design IP Market Revenue Million Forecast, by Country 2019 & 2032
- Table 38: Global SRAM and ROM Design IP Market Volume K Unit Forecast, by Country 2019 & 2032
- Table 39: United States Global SRAM and ROM Design IP Market Revenue (Million) Forecast, by Application 2019 & 2032
- Table 40: United States Global SRAM and ROM Design IP Market Volume (K Unit) Forecast, by Application 2019 & 2032
- Table 41: Canada Global SRAM and ROM Design IP Market Revenue (Million) Forecast, by Application 2019 & 2032
- Table 42: Canada Global SRAM and ROM Design IP Market Volume (K Unit) Forecast, by Application 2019 & 2032
- Table 43: Mexico Global SRAM and ROM Design IP Market Revenue (Million) Forecast, by Application 2019 & 2032
- Table 44: Mexico Global SRAM and ROM Design IP Market Volume (K Unit) Forecast, by Application 2019 & 2032
- Table 45: Global SRAM and ROM Design IP Market Revenue Million Forecast, by Type 2019 & 2032
- Table 46: Global SRAM and ROM Design IP Market Volume K Unit Forecast, by Type 2019 & 2032
- Table 47: Global SRAM and ROM Design IP Market Revenue Million Forecast, by Application 2019 & 2032
- Table 48: Global SRAM and ROM Design IP Market Volume K Unit Forecast, by Application 2019 & 2032
- Table 49: Global SRAM and ROM Design IP Market Revenue Million Forecast, by Geography 2019 & 2032
- Table 50: Global SRAM and ROM Design IP Market Volume K Unit Forecast, by Geography 2019 & 2032
- Table 51: Global SRAM and ROM Design IP Market Revenue Million Forecast, by Country 2019 & 2032
- Table 52: Global SRAM and ROM Design IP Market Volume K Unit Forecast, by Country 2019 & 2032
- Table 53: Brazil Global SRAM and ROM Design IP Market Revenue (Million) Forecast, by Application 2019 & 2032
- Table 54: Brazil Global SRAM and ROM Design IP Market Volume (K Unit) Forecast, by Application 2019 & 2032
- Table 55: Argentina Global SRAM and ROM Design IP Market Revenue (Million) Forecast, by Application 2019 & 2032
- Table 56: Argentina Global SRAM and ROM Design IP Market Volume (K Unit) Forecast, by Application 2019 & 2032
- Table 57: Rest of South America Global SRAM and ROM Design IP Market Revenue (Million) Forecast, by Application 2019 & 2032
- Table 58: Rest of South America Global SRAM and ROM Design IP Market Volume (K Unit) Forecast, by Application 2019 & 2032
- Table 59: Global SRAM and ROM Design IP Market Revenue Million Forecast, by Type 2019 & 2032
- Table 60: Global SRAM and ROM Design IP Market Volume K Unit Forecast, by Type 2019 & 2032
- Table 61: Global SRAM and ROM Design IP Market Revenue Million Forecast, by Application 2019 & 2032
- Table 62: Global SRAM and ROM Design IP Market Volume K Unit Forecast, by Application 2019 & 2032
- Table 63: Global SRAM and ROM Design IP Market Revenue Million Forecast, by Geography 2019 & 2032
- Table 64: Global SRAM and ROM Design IP Market Volume K Unit Forecast, by Geography 2019 & 2032
- Table 65: Global SRAM and ROM Design IP Market Revenue Million Forecast, by Country 2019 & 2032
- Table 66: Global SRAM and ROM Design IP Market Volume K Unit Forecast, by Country 2019 & 2032
- Table 67: United Kingdom Global SRAM and ROM Design IP Market Revenue (Million) Forecast, by Application 2019 & 2032
- Table 68: United Kingdom Global SRAM and ROM Design IP Market Volume (K Unit) Forecast, by Application 2019 & 2032
- Table 69: Germany Global SRAM and ROM Design IP Market Revenue (Million) Forecast, by Application 2019 & 2032
- Table 70: Germany Global SRAM and ROM Design IP Market Volume (K Unit) Forecast, by Application 2019 & 2032
- Table 71: France Global SRAM and ROM Design IP Market Revenue (Million) Forecast, by Application 2019 & 2032
- Table 72: France Global SRAM and ROM Design IP Market Volume (K Unit) Forecast, by Application 2019 & 2032
- Table 73: Italy Global SRAM and ROM Design IP Market Revenue (Million) Forecast, by Application 2019 & 2032
- Table 74: Italy Global SRAM and ROM Design IP Market Volume (K Unit) Forecast, by Application 2019 & 2032
- Table 75: Spain Global SRAM and ROM Design IP Market Revenue (Million) Forecast, by Application 2019 & 2032
- Table 76: Spain Global SRAM and ROM Design IP Market Volume (K Unit) Forecast, by Application 2019 & 2032
- Table 77: Russia Global SRAM and ROM Design IP Market Revenue (Million) Forecast, by Application 2019 & 2032
- Table 78: Russia Global SRAM and ROM Design IP Market Volume (K Unit) Forecast, by Application 2019 & 2032
- Table 79: Benelux Global SRAM and ROM Design IP Market Revenue (Million) Forecast, by Application 2019 & 2032
- Table 80: Benelux Global SRAM and ROM Design IP Market Volume (K Unit) Forecast, by Application 2019 & 2032
- Table 81: Nordics Global SRAM and ROM Design IP Market Revenue (Million) Forecast, by Application 2019 & 2032
- Table 82: Nordics Global SRAM and ROM Design IP Market Volume (K Unit) Forecast, by Application 2019 & 2032
- Table 83: Rest of Europe Global SRAM and ROM Design IP Market Revenue (Million) Forecast, by Application 2019 & 2032
- Table 84: Rest of Europe Global SRAM and ROM Design IP Market Volume (K Unit) Forecast, by Application 2019 & 2032
- Table 85: Global SRAM and ROM Design IP Market Revenue Million Forecast, by Type 2019 & 2032
- Table 86: Global SRAM and ROM Design IP Market Volume K Unit Forecast, by Type 2019 & 2032
- Table 87: Global SRAM and ROM Design IP Market Revenue Million Forecast, by Application 2019 & 2032
- Table 88: Global SRAM and ROM Design IP Market Volume K Unit Forecast, by Application 2019 & 2032
- Table 89: Global SRAM and ROM Design IP Market Revenue Million Forecast, by Geography 2019 & 2032
- Table 90: Global SRAM and ROM Design IP Market Volume K Unit Forecast, by Geography 2019 & 2032
- Table 91: Global SRAM and ROM Design IP Market Revenue Million Forecast, by Country 2019 & 2032
- Table 92: Global SRAM and ROM Design IP Market Volume K Unit Forecast, by Country 2019 & 2032
- Table 93: Turkey Global SRAM and ROM Design IP Market Revenue (Million) Forecast, by Application 2019 & 2032
- Table 94: Turkey Global SRAM and ROM Design IP Market Volume (K Unit) Forecast, by Application 2019 & 2032
- Table 95: Israel Global SRAM and ROM Design IP Market Revenue (Million) Forecast, by Application 2019 & 2032
- Table 96: Israel Global SRAM and ROM Design IP Market Volume (K Unit) Forecast, by Application 2019 & 2032
- Table 97: GCC Global SRAM and ROM Design IP Market Revenue (Million) Forecast, by Application 2019 & 2032
- Table 98: GCC Global SRAM and ROM Design IP Market Volume (K Unit) Forecast, by Application 2019 & 2032
- Table 99: North Africa Global SRAM and ROM Design IP Market Revenue (Million) Forecast, by Application 2019 & 2032
- Table 100: North Africa Global SRAM and ROM Design IP Market Volume (K Unit) Forecast, by Application 2019 & 2032
- Table 101: South Africa Global SRAM and ROM Design IP Market Revenue (Million) Forecast, by Application 2019 & 2032
- Table 102: South Africa Global SRAM and ROM Design IP Market Volume (K Unit) Forecast, by Application 2019 & 2032
- Table 103: Rest of Middle East & Africa Global SRAM and ROM Design IP Market Revenue (Million) Forecast, by Application 2019 & 2032
- Table 104: Rest of Middle East & Africa Global SRAM and ROM Design IP Market Volume (K Unit) Forecast, by Application 2019 & 2032
- Table 105: Global SRAM and ROM Design IP Market Revenue Million Forecast, by Type 2019 & 2032
- Table 106: Global SRAM and ROM Design IP Market Volume K Unit Forecast, by Type 2019 & 2032
- Table 107: Global SRAM and ROM Design IP Market Revenue Million Forecast, by Application 2019 & 2032
- Table 108: Global SRAM and ROM Design IP Market Volume K Unit Forecast, by Application 2019 & 2032
- Table 109: Global SRAM and ROM Design IP Market Revenue Million Forecast, by Geography 2019 & 2032
- Table 110: Global SRAM and ROM Design IP Market Volume K Unit Forecast, by Geography 2019 & 2032
- Table 111: Global SRAM and ROM Design IP Market Revenue Million Forecast, by Country 2019 & 2032
- Table 112: Global SRAM and ROM Design IP Market Volume K Unit Forecast, by Country 2019 & 2032
- Table 113: China Global SRAM and ROM Design IP Market Revenue (Million) Forecast, by Application 2019 & 2032
- Table 114: China Global SRAM and ROM Design IP Market Volume (K Unit) Forecast, by Application 2019 & 2032
- Table 115: India Global SRAM and ROM Design IP Market Revenue (Million) Forecast, by Application 2019 & 2032
- Table 116: India Global SRAM and ROM Design IP Market Volume (K Unit) Forecast, by Application 2019 & 2032
- Table 117: Japan Global SRAM and ROM Design IP Market Revenue (Million) Forecast, by Application 2019 & 2032
- Table 118: Japan Global SRAM and ROM Design IP Market Volume (K Unit) Forecast, by Application 2019 & 2032
- Table 119: South Korea Global SRAM and ROM Design IP Market Revenue (Million) Forecast, by Application 2019 & 2032
- Table 120: South Korea Global SRAM and ROM Design IP Market Volume (K Unit) Forecast, by Application 2019 & 2032
- Table 121: ASEAN Global SRAM and ROM Design IP Market Revenue (Million) Forecast, by Application 2019 & 2032
- Table 122: ASEAN Global SRAM and ROM Design IP Market Volume (K Unit) Forecast, by Application 2019 & 2032
- Table 123: Oceania Global SRAM and ROM Design IP Market Revenue (Million) Forecast, by Application 2019 & 2032
- Table 124: Oceania Global SRAM and ROM Design IP Market Volume (K Unit) Forecast, by Application 2019 & 2032
- Table 125: Rest of Asia Pacific Global SRAM and ROM Design IP Market Revenue (Million) Forecast, by Application 2019 & 2032
- Table 126: Rest of Asia Pacific Global SRAM and ROM Design IP Market Volume (K Unit) Forecast, by Application 2019 & 2032
Frequently Asked Questions
1. What is the projected Compound Annual Growth Rate (CAGR) of the Global SRAM and ROM Design IP Market?
The projected CAGR is approximately -1.54%.
2. Which companies are prominent players in the Global SRAM and ROM Design IP Market?
Key companies in the market include Avalanche Technology Inc, Everspin Technologies Inc, TekStart LLC, Verisilicon Holdings Co Ltd, Xilinx Inc, Dolphin Design SAS, Arm Holdings, Dolphin Technology Inc, Surecore Ltd, Renesas Electronics Corporation, Synopsys Inc, TDK Corporation, eMemory Technology Inc, Mentor Graphics Corporation.
3. What are the main segments of the Global SRAM and ROM Design IP Market?
The market segments include Type, Application, Geography.
4. Can you provide details about the market size?
The market size is estimated to be USD XX Million as of 2022.
5. What are some drivers contributing to market growth?
Increase in Demand for Autonomous Driving Technology; Growth in Edge Analytics for IoT Application.
6. What are the notable trends driving market growth?
Increasing Demand For Enterprise Storage Applications to Drive the Growth for MRAM.
7. Are there any restraints impacting market growth?
Complexity in Design and AI Interface.
8. Can you provide examples of recent developments in the market?
N/A
9. What pricing options are available for accessing the report?
Pricing options include single-user, multi-user, and enterprise licenses priced at USD 3800, USD 4500, and USD 5800 respectively.
10. Is the market size provided in terms of value or volume?
The market size is provided in terms of value, measured in Million and volume, measured in K Unit.
11. Are there any specific market keywords associated with the report?
Yes, the market keyword associated with the report is "Global SRAM and ROM Design IP Market," which aids in identifying and referencing the specific market segment covered.
12. How do I determine which pricing option suits my needs best?
The pricing options vary based on user requirements and access needs. Individual users may opt for single-user licenses, while businesses requiring broader access may choose multi-user or enterprise licenses for cost-effective access to the report.
13. Are there any additional resources or data provided in the Global SRAM and ROM Design IP Market report?
While the report offers comprehensive insights, it's advisable to review the specific contents or supplementary materials provided to ascertain if additional resources or data are available.
14. How can I stay updated on further developments or reports in the Global SRAM and ROM Design IP Market?
To stay informed about further developments, trends, and reports in the Global SRAM and ROM Design IP Market, consider subscribing to industry newsletters, following relevant companies and organizations, or regularly checking reputable industry news sources and publications.
Methodology
Step 1 - Identification of Relevant Samples Size from Population Database


Step 2 - Approaches for Defining Global Market Size (Value, Volume* & Price*)

Note*: In applicable scenarios
Step 3 - Data Sources
Primary Research
- Web Analytics
- Survey Reports
- Research Institute
- Latest Research Reports
- Opinion Leaders
Secondary Research
- Annual Reports
- White Paper
- Latest Press Release
- Industry Association
- Paid Database
- Investor Presentations

Step 4 - Data Triangulation
Involves using different sources of information in order to increase the validity of a study
These sources are likely to be stakeholders in a program - participants, other researchers, program staff, other community members, and so on.
Then we put all data in single framework & apply various statistical tools to find out the dynamic on the market.
During the analysis stage, feedback from the stakeholder groups would be compared to determine areas of agreement as well as areas of divergence


