
Key Insights
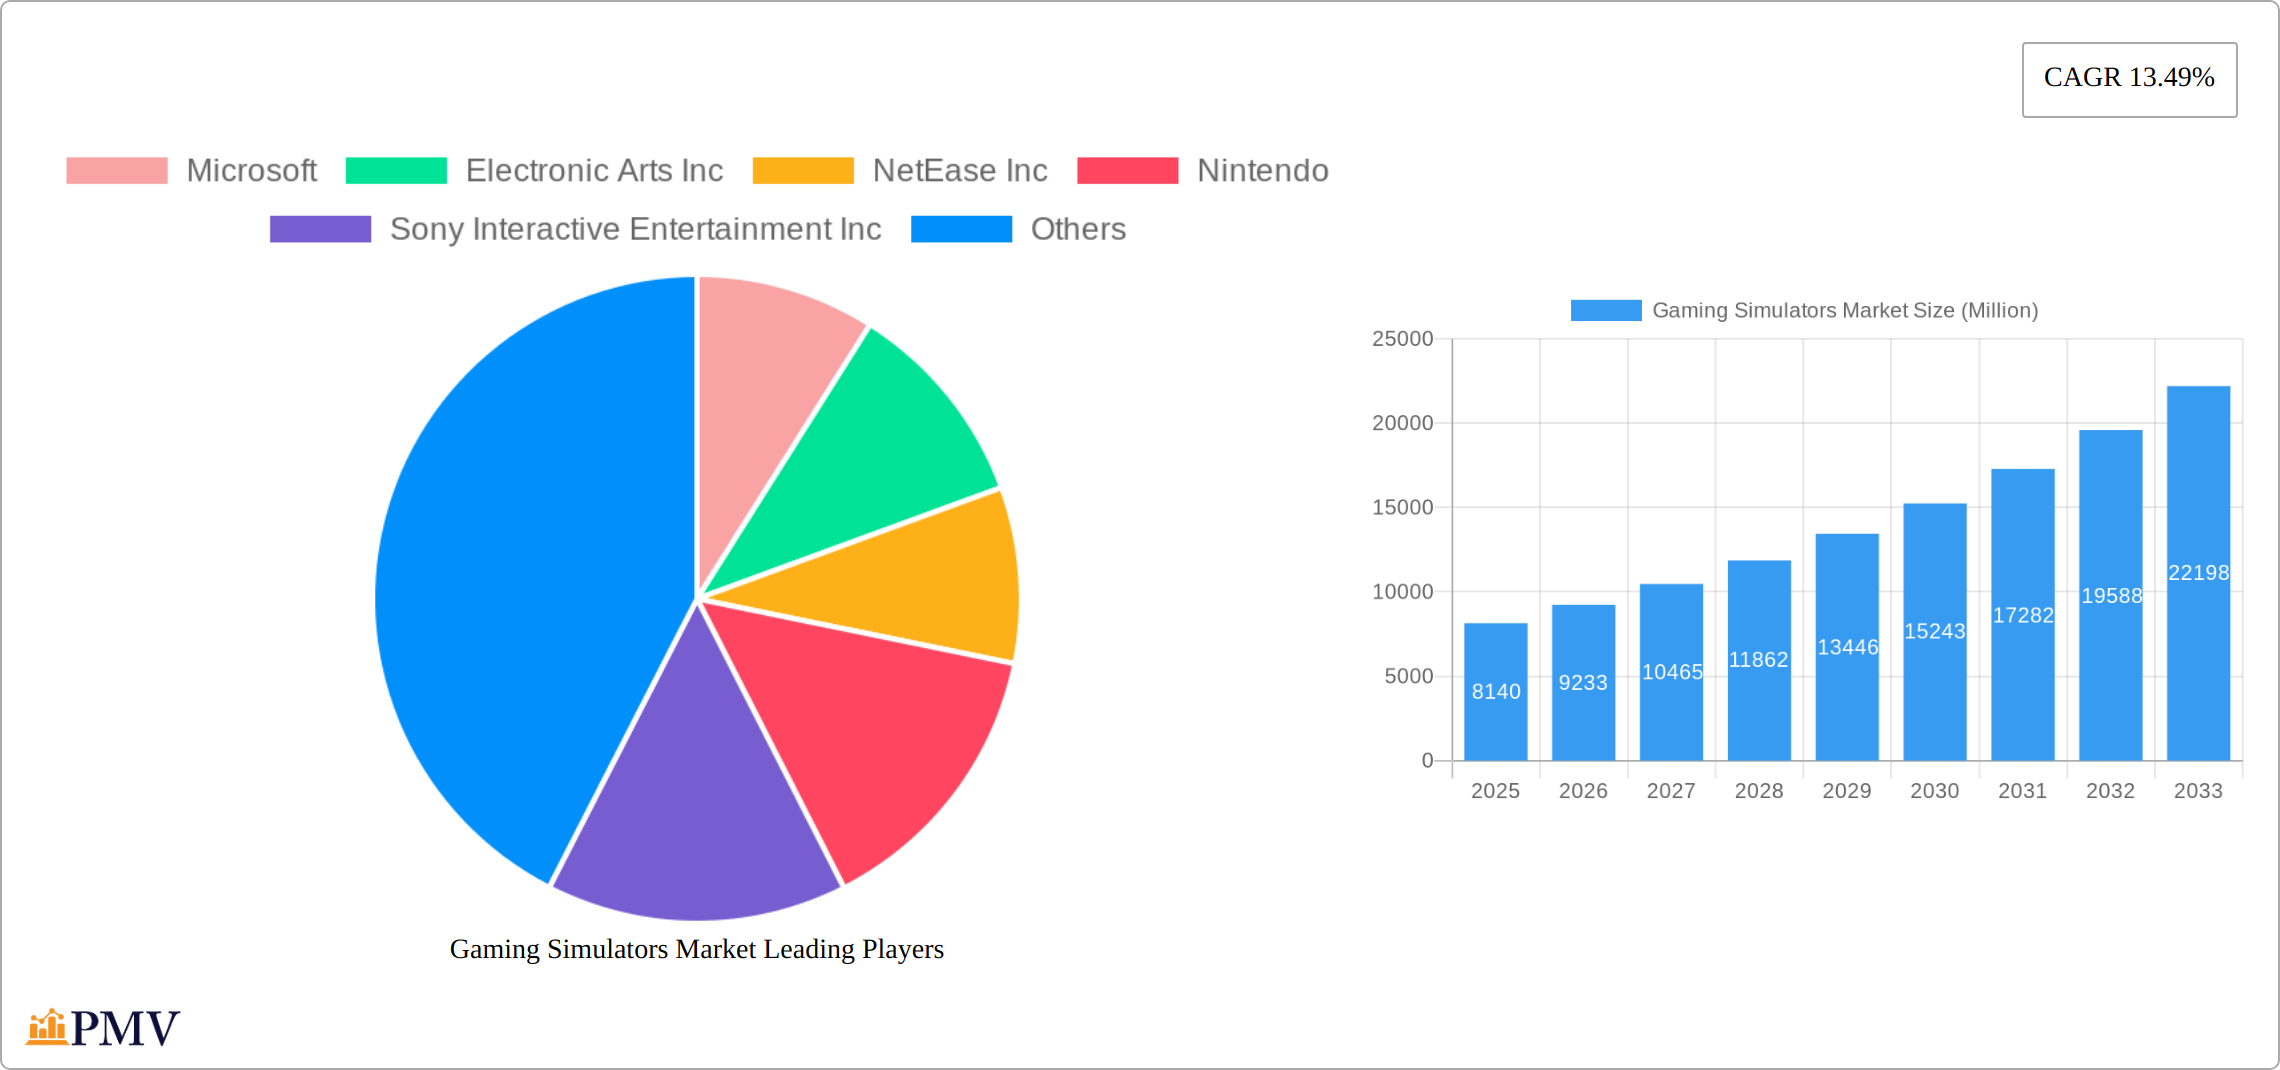
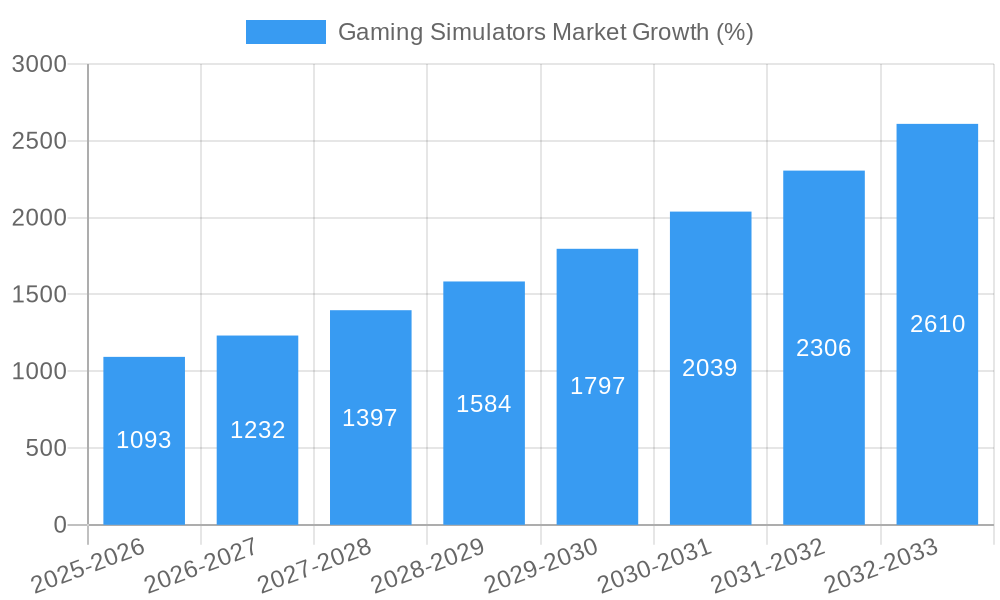
The gaming simulator market, currently valued at $8.14 billion in 2025, is projected to experience robust growth, exhibiting a Compound Annual Growth Rate (CAGR) of 13.49% from 2025 to 2033. This expansion is fueled by several key drivers. The increasing popularity of esports and competitive gaming is creating a significant demand for realistic and immersive simulation experiences. Technological advancements, such as improved graphics processing units (GPUs) and virtual reality (VR) headsets, are enhancing the realism and engagement of gaming simulators, further stimulating market growth. Moreover, the rising disposable incomes in developing economies, coupled with the increasing penetration of smartphones and high-speed internet, are expanding the market's addressable audience. The market is segmented by type (Advertising, In-App Purchase, Paid App), allowing for diverse monetization strategies and catering to varied consumer preferences. Key players such as Microsoft, Electronic Arts, and Tencent are actively investing in research and development, driving innovation and competition within the market. While potential restraints such as high initial investment costs for advanced simulators and concerns about screen time and potential health effects exist, the overall market outlook remains optimistic, driven by consistent technological progress and growing consumer interest.
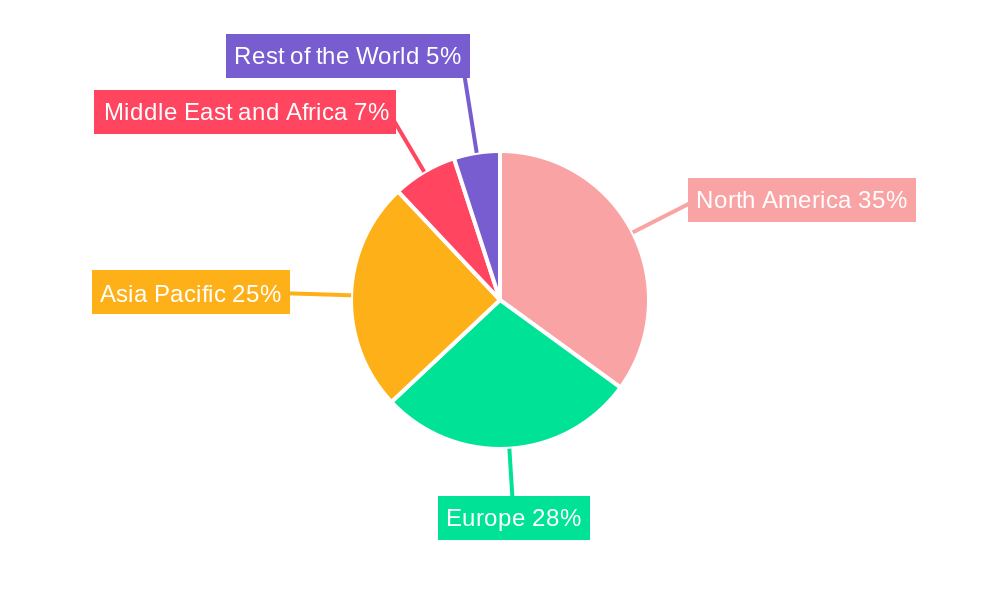
The diverse revenue streams across the different segments—advertising, in-app purchases, and paid apps—contribute to market resilience. Geographic segmentation reveals a strong presence in North America and Europe, representing established gaming markets. However, the Asia-Pacific region is anticipated to show significant growth potential due to its burgeoning gaming community and increasing smartphone penetration. This expansion is likely to be fueled by the rising popularity of mobile gaming and the increasing affordability of gaming hardware and software in these regions. The continued development of innovative features and immersive gameplay experiences, combined with strategic partnerships between gaming companies and hardware manufacturers, will further propel the market's expansion in the coming years. Competition among established players and emerging market entrants will contribute to ongoing innovation and affordability.
This detailed report provides a comprehensive analysis of the Gaming Simulators Market, offering valuable insights for industry stakeholders, investors, and market entrants. With a study period spanning 2019-2033, a base year of 2025, and a forecast period of 2025-2033, this report leverages historical data (2019-2024) to project future market trends. The report covers key market segments, competitive dynamics, technological advancements, and growth drivers, offering a complete picture of this dynamic market. Expected market size for 2025 is estimated at xx Million.
Gaming Simulators Market Market Structure & Competitive Dynamics
The Gaming Simulators Market exhibits a moderately concentrated structure, with several major players holding significant market share. Key players like Microsoft, Electronic Arts Inc, NetEase Inc, Nintendo, Sony Interactive Entertainment Inc, Activision Blizzard Inc, Tencent, Square Enix Co Ltd, Take-Two Interactive Software Inc, and Bandai Namco Entertainment Inc. dominate the landscape. However, the market also accommodates numerous smaller, niche players, fostering innovation and competition.
Market concentration is further influenced by factors like:
- Innovation Ecosystems: The market is characterized by rapid technological advancements, particularly in AI and VR/AR technologies. This drives innovation and creates opportunities for both established and emerging players.
- Regulatory Frameworks: Government regulations concerning data privacy, content restrictions, and competition can significantly influence market dynamics.
- Product Substitutes: The emergence of alternative entertainment options, such as streaming services and esports, poses a challenge to gaming simulator market growth.
- End-User Trends: Shifting consumer preferences, such as demand for realistic gaming experiences and cross-platform compatibility, affect product development and market strategies.
- M&A Activities: The Gaming Simulators Market has witnessed significant M&A activities in recent years, with deal values reaching xx Million in 2024. These mergers and acquisitions reshape the competitive landscape, consolidating market share and driving innovation. For example, the xx Million acquisition of [Company A] by [Company B] in [Year] significantly impacted market dynamics.
Gaming Simulators Market Industry Trends & Insights
The Gaming Simulators Market is experiencing robust growth, driven by several key factors. Technological advancements, including the integration of Artificial Intelligence (AI), Virtual Reality (VR), and Augmented Reality (AR), are enhancing the realism and immersion of gaming experiences, driving significant market expansion. The increasing adoption of cloud gaming services, allowing access to high-quality games without powerful hardware, is further broadening market reach. Consumer preferences are shifting towards more interactive and personalized gaming experiences, influencing product development and innovation.
The market is anticipated to register a Compound Annual Growth Rate (CAGR) of xx% during the forecast period (2025-2033), with market penetration reaching xx% by 2033. Competitive dynamics are intensifying, with major players investing heavily in research and development (R&D) to launch innovative products and enhance their market position. The growing esports industry also plays a vital role by increasing the visibility and popularity of gaming simulators.
Dominant Markets & Segments in Gaming Simulators Market
The North American region currently holds the dominant position in the Gaming Simulators Market, driven by high consumer spending on gaming and the presence of established gaming companies. Within the market segments by type, the Paid App segment currently holds the largest market share, due to its premium features and immersive gameplay. However, the In-App Purchase segment is projected to exhibit the fastest growth rate over the forecast period driven by monetization strategies.
Key Drivers for North American Dominance:
- Strong Economic Conditions: High disposable incomes and a robust economy fuel consumer spending on entertainment, including gaming simulators.
- Developed Gaming Infrastructure: Excellent internet connectivity and a well-established gaming ecosystem support the growth of the market.
- High Penetration of Gaming Consoles and PCs: The widespread availability of gaming hardware increases market access and potential.
Segment Analysis:
- Advertising: This segment relies on revenue generated from in-game advertising. While less lucrative per user compared to other models, its broad reach can lead to substantial overall revenue. Market size in 2025 is estimated to be xx Million.
- In-App Purchase: This segment offers a freemium model where users purchase add-ons or upgrades within the game. It has proven to be a highly successful monetization method, leading to high growth potential. Market size in 2025 is estimated to be xx Million.
- Paid App: This model operates on a direct purchase basis, with users paying upfront for the full gaming experience. While initial investment is required from the consumer, it provides a stable revenue stream. Market size in 2025 is estimated to be xx Million.
Gaming Simulators Market Product Innovations
Recent innovations in gaming simulators include advancements in AI-powered opponents, enhancing the realism and challenge of gameplay. Integration of VR/AR technologies is creating more immersive and interactive gaming experiences. Cross-platform compatibility is becoming increasingly prevalent, allowing players to seamlessly transition between devices. These innovations are catering to evolving consumer preferences, fostering stronger market penetration and driving market expansion.
Report Segmentation & Scope
This report segments the Gaming Simulators Market by type: Advertising, In-App Purchase, and Paid App. Each segment is analyzed in detail, considering growth projections, market size (in Millions), and competitive dynamics. The report projects significant growth across all segments, with In-App Purchases anticipated to lead in growth rate due to its flexible and highly monetizable nature. Paid Apps, though currently larger, will experience steady growth fueled by continued demand for premium gaming experiences.
Key Drivers of Gaming Simulators Market Growth
The Gaming Simulators Market is propelled by several key factors, including technological advancements (like AI and VR/AR integration), increasing internet penetration, rising disposable incomes globally, and the growing popularity of esports. Government initiatives promoting the gaming industry and relaxed regulations in some regions further stimulate market growth. Furthermore, the release of high-quality gaming titles consistently drives demand.
Challenges in the Gaming Simulators Market Sector
The Gaming Simulators Market faces several challenges, including the high cost of development and marketing, increasing competition from other entertainment options, and potential regulatory hurdles regarding content and data privacy. Supply chain disruptions can also impact production and distribution, and fluctuations in global economic conditions can affect consumer spending patterns. These factors can collectively impact revenue projections and market stability.
Leading Players in the Gaming Simulators Market Market
- Microsoft
- Electronic Arts Inc
- NetEase Inc
- Nintendo
- Sony Interactive Entertainment Inc
- Activision Blizzard Inc
- Tencent
- Square Enix Co Ltd
- Take-Two Interactive Software Inc
- Bandai Namco Entertainment Inc
Key Developments in Gaming Simulators Market Sector
- February 2022: Gran Turismo SophyTM, a superhuman AI agent, was announced, marking a significant advancement in AI-powered gaming experiences.
- February 2022: Nautilus Mobile secured a USD 5.4 Million investment, highlighting growing interest in mobile gaming development, particularly in emerging markets.
Strategic Gaming Simulators Market Market Outlook
The Gaming Simulators Market presents significant opportunities for future growth, driven by ongoing technological innovation, expanding global internet access, and the increasing popularity of gaming as a form of entertainment. Strategic partnerships, focusing on innovation and market expansion into emerging economies, will be crucial for companies to maintain a competitive edge. The continued integration of advanced technologies, such as AI and VR/AR, presents significant potential for enhanced realism and gameplay, attracting a broader audience and driving market expansion.
Gaming Simulators Market Segmentation
-
1. Type
- 1.1. Advertising
- 1.2. In-App Purchase
- 1.3. Paid App
Gaming Simulators Market Segmentation By Geography
- 1. North America
- 2. Europe
- 3. Asia
- 4. Middle East and Africa
- 5. Latin America
Gaming Simulators Market REPORT HIGHLIGHTS
| Aspects | Details |
|---|---|
| Study Period | 2019-2033 |
| Base Year | 2024 |
| Estimated Year | 2025 |
| Forecast Period | 2025-2033 |
| Historical Period | 2019-2024 |
| Growth Rate | CAGR of 13.49% from 2019-2033 |
| Segmentation |
|
Table of Contents
- 1. Introduction
- 1.1. Research Scope
- 1.2. Market Segmentation
- 1.3. Research Methodology
- 1.4. Definitions and Assumptions
- 2. Executive Summary
- 2.1. Introduction
- 3. Market Dynamics
- 3.1. Introduction
- 3.2. Market Drivers
- 3.2.1. Increased Adoption of Smartphones; Increased Utilization of Gaming Simulation for Training and Analysis Across a Variety of Fields; Growing Demand for VR Headsets
- 3.3. Market Restrains
- 3.3.1. Need for Expensive Graphic Cards
- 3.4. Market Trends
- 3.4.1. Increased Adoption of Smartphones is Expected to Drive the Market Growth
- 4. Market Factor Analysis
- 4.1. Porters Five Forces
- 4.2. Supply/Value Chain
- 4.3. PESTEL analysis
- 4.4. Market Entropy
- 4.5. Patent/Trademark Analysis
- 5. Global Gaming Simulators Market Analysis, Insights and Forecast, 2019-2031
- 5.1. Market Analysis, Insights and Forecast - by Type
- 5.1.1. Advertising
- 5.1.2. In-App Purchase
- 5.1.3. Paid App
- 5.2. Market Analysis, Insights and Forecast - by Region
- 5.2.1. North America
- 5.2.2. Europe
- 5.2.3. Asia
- 5.2.4. Middle East and Africa
- 5.2.5. Latin America
- 5.1. Market Analysis, Insights and Forecast - by Type
- 6. North America Gaming Simulators Market Analysis, Insights and Forecast, 2019-2031
- 6.1. Market Analysis, Insights and Forecast - by Type
- 6.1.1. Advertising
- 6.1.2. In-App Purchase
- 6.1.3. Paid App
- 6.1. Market Analysis, Insights and Forecast - by Type
- 7. Europe Gaming Simulators Market Analysis, Insights and Forecast, 2019-2031
- 7.1. Market Analysis, Insights and Forecast - by Type
- 7.1.1. Advertising
- 7.1.2. In-App Purchase
- 7.1.3. Paid App
- 7.1. Market Analysis, Insights and Forecast - by Type
- 8. Asia Gaming Simulators Market Analysis, Insights and Forecast, 2019-2031
- 8.1. Market Analysis, Insights and Forecast - by Type
- 8.1.1. Advertising
- 8.1.2. In-App Purchase
- 8.1.3. Paid App
- 8.1. Market Analysis, Insights and Forecast - by Type
- 9. Middle East and Africa Gaming Simulators Market Analysis, Insights and Forecast, 2019-2031
- 9.1. Market Analysis, Insights and Forecast - by Type
- 9.1.1. Advertising
- 9.1.2. In-App Purchase
- 9.1.3. Paid App
- 9.1. Market Analysis, Insights and Forecast - by Type
- 10. Latin America Gaming Simulators Market Analysis, Insights and Forecast, 2019-2031
- 10.1. Market Analysis, Insights and Forecast - by Type
- 10.1.1. Advertising
- 10.1.2. In-App Purchase
- 10.1.3. Paid App
- 10.1. Market Analysis, Insights and Forecast - by Type
- 11. North America Gaming Simulators Market Analysis, Insights and Forecast, 2019-2031
- 11.1. Market Analysis, Insights and Forecast - By Country/Sub-region
- 11.1.1.
- 12. Europe Gaming Simulators Market Analysis, Insights and Forecast, 2019-2031
- 12.1. Market Analysis, Insights and Forecast - By Country/Sub-region
- 12.1.1.
- 13. Asia Pacific Gaming Simulators Market Analysis, Insights and Forecast, 2019-2031
- 13.1. Market Analysis, Insights and Forecast - By Country/Sub-region
- 13.1.1.
- 14. Middle East and Africa Gaming Simulators Market Analysis, Insights and Forecast, 2019-2031
- 14.1. Market Analysis, Insights and Forecast - By Country/Sub-region
- 14.1.1.
- 15. Rest of the World Gaming Simulators Market Analysis, Insights and Forecast, 2019-2031
- 15.1. Market Analysis, Insights and Forecast - By Country/Sub-region
- 15.1.1.
- 16. Competitive Analysis
- 16.1. Global Market Share Analysis 2024
- 16.2. Company Profiles
- 16.2.1 Microsoft
- 16.2.1.1. Overview
- 16.2.1.2. Products
- 16.2.1.3. SWOT Analysis
- 16.2.1.4. Recent Developments
- 16.2.1.5. Financials (Based on Availability)
- 16.2.2 Electronic Arts Inc
- 16.2.2.1. Overview
- 16.2.2.2. Products
- 16.2.2.3. SWOT Analysis
- 16.2.2.4. Recent Developments
- 16.2.2.5. Financials (Based on Availability)
- 16.2.3 NetEase Inc
- 16.2.3.1. Overview
- 16.2.3.2. Products
- 16.2.3.3. SWOT Analysis
- 16.2.3.4. Recent Developments
- 16.2.3.5. Financials (Based on Availability)
- 16.2.4 Nintendo
- 16.2.4.1. Overview
- 16.2.4.2. Products
- 16.2.4.3. SWOT Analysis
- 16.2.4.4. Recent Developments
- 16.2.4.5. Financials (Based on Availability)
- 16.2.5 Sony Interactive Entertainment Inc
- 16.2.5.1. Overview
- 16.2.5.2. Products
- 16.2.5.3. SWOT Analysis
- 16.2.5.4. Recent Developments
- 16.2.5.5. Financials (Based on Availability)
- 16.2.6 Activision Blizzard Inc
- 16.2.6.1. Overview
- 16.2.6.2. Products
- 16.2.6.3. SWOT Analysis
- 16.2.6.4. Recent Developments
- 16.2.6.5. Financials (Based on Availability)
- 16.2.7 Tencent
- 16.2.7.1. Overview
- 16.2.7.2. Products
- 16.2.7.3. SWOT Analysis
- 16.2.7.4. Recent Developments
- 16.2.7.5. Financials (Based on Availability)
- 16.2.8 Square Enix Co Ltd *List Not Exhaustive
- 16.2.8.1. Overview
- 16.2.8.2. Products
- 16.2.8.3. SWOT Analysis
- 16.2.8.4. Recent Developments
- 16.2.8.5. Financials (Based on Availability)
- 16.2.9 Take-Two Interactive Software Inc
- 16.2.9.1. Overview
- 16.2.9.2. Products
- 16.2.9.3. SWOT Analysis
- 16.2.9.4. Recent Developments
- 16.2.9.5. Financials (Based on Availability)
- 16.2.10 Bandai Namco Entertainment Inc
- 16.2.10.1. Overview
- 16.2.10.2. Products
- 16.2.10.3. SWOT Analysis
- 16.2.10.4. Recent Developments
- 16.2.10.5. Financials (Based on Availability)
- 16.2.1 Microsoft
List of Figures
- Figure 1: Global Gaming Simulators Market Revenue Breakdown (Million, %) by Region 2024 & 2032
- Figure 2: North America Gaming Simulators Market Revenue (Million), by Country 2024 & 2032
- Figure 3: North America Gaming Simulators Market Revenue Share (%), by Country 2024 & 2032
- Figure 4: Europe Gaming Simulators Market Revenue (Million), by Country 2024 & 2032
- Figure 5: Europe Gaming Simulators Market Revenue Share (%), by Country 2024 & 2032
- Figure 6: Asia Pacific Gaming Simulators Market Revenue (Million), by Country 2024 & 2032
- Figure 7: Asia Pacific Gaming Simulators Market Revenue Share (%), by Country 2024 & 2032
- Figure 8: Middle East and Africa Gaming Simulators Market Revenue (Million), by Country 2024 & 2032
- Figure 9: Middle East and Africa Gaming Simulators Market Revenue Share (%), by Country 2024 & 2032
- Figure 10: Rest of the World Gaming Simulators Market Revenue (Million), by Country 2024 & 2032
- Figure 11: Rest of the World Gaming Simulators Market Revenue Share (%), by Country 2024 & 2032
- Figure 12: North America Gaming Simulators Market Revenue (Million), by Type 2024 & 2032
- Figure 13: North America Gaming Simulators Market Revenue Share (%), by Type 2024 & 2032
- Figure 14: North America Gaming Simulators Market Revenue (Million), by Country 2024 & 2032
- Figure 15: North America Gaming Simulators Market Revenue Share (%), by Country 2024 & 2032
- Figure 16: Europe Gaming Simulators Market Revenue (Million), by Type 2024 & 2032
- Figure 17: Europe Gaming Simulators Market Revenue Share (%), by Type 2024 & 2032
- Figure 18: Europe Gaming Simulators Market Revenue (Million), by Country 2024 & 2032
- Figure 19: Europe Gaming Simulators Market Revenue Share (%), by Country 2024 & 2032
- Figure 20: Asia Gaming Simulators Market Revenue (Million), by Type 2024 & 2032
- Figure 21: Asia Gaming Simulators Market Revenue Share (%), by Type 2024 & 2032
- Figure 22: Asia Gaming Simulators Market Revenue (Million), by Country 2024 & 2032
- Figure 23: Asia Gaming Simulators Market Revenue Share (%), by Country 2024 & 2032
- Figure 24: Middle East and Africa Gaming Simulators Market Revenue (Million), by Type 2024 & 2032
- Figure 25: Middle East and Africa Gaming Simulators Market Revenue Share (%), by Type 2024 & 2032
- Figure 26: Middle East and Africa Gaming Simulators Market Revenue (Million), by Country 2024 & 2032
- Figure 27: Middle East and Africa Gaming Simulators Market Revenue Share (%), by Country 2024 & 2032
- Figure 28: Latin America Gaming Simulators Market Revenue (Million), by Type 2024 & 2032
- Figure 29: Latin America Gaming Simulators Market Revenue Share (%), by Type 2024 & 2032
- Figure 30: Latin America Gaming Simulators Market Revenue (Million), by Country 2024 & 2032
- Figure 31: Latin America Gaming Simulators Market Revenue Share (%), by Country 2024 & 2032
List of Tables
- Table 1: Global Gaming Simulators Market Revenue Million Forecast, by Region 2019 & 2032
- Table 2: Global Gaming Simulators Market Revenue Million Forecast, by Type 2019 & 2032
- Table 3: Global Gaming Simulators Market Revenue Million Forecast, by Region 2019 & 2032
- Table 4: Global Gaming Simulators Market Revenue Million Forecast, by Country 2019 & 2032
- Table 5: Gaming Simulators Market Revenue (Million) Forecast, by Application 2019 & 2032
- Table 6: Global Gaming Simulators Market Revenue Million Forecast, by Country 2019 & 2032
- Table 7: Gaming Simulators Market Revenue (Million) Forecast, by Application 2019 & 2032
- Table 8: Global Gaming Simulators Market Revenue Million Forecast, by Country 2019 & 2032
- Table 9: Gaming Simulators Market Revenue (Million) Forecast, by Application 2019 & 2032
- Table 10: Global Gaming Simulators Market Revenue Million Forecast, by Country 2019 & 2032
- Table 11: Gaming Simulators Market Revenue (Million) Forecast, by Application 2019 & 2032
- Table 12: Global Gaming Simulators Market Revenue Million Forecast, by Country 2019 & 2032
- Table 13: Gaming Simulators Market Revenue (Million) Forecast, by Application 2019 & 2032
- Table 14: Global Gaming Simulators Market Revenue Million Forecast, by Type 2019 & 2032
- Table 15: Global Gaming Simulators Market Revenue Million Forecast, by Country 2019 & 2032
- Table 16: Global Gaming Simulators Market Revenue Million Forecast, by Type 2019 & 2032
- Table 17: Global Gaming Simulators Market Revenue Million Forecast, by Country 2019 & 2032
- Table 18: Global Gaming Simulators Market Revenue Million Forecast, by Type 2019 & 2032
- Table 19: Global Gaming Simulators Market Revenue Million Forecast, by Country 2019 & 2032
- Table 20: Global Gaming Simulators Market Revenue Million Forecast, by Type 2019 & 2032
- Table 21: Global Gaming Simulators Market Revenue Million Forecast, by Country 2019 & 2032
- Table 22: Global Gaming Simulators Market Revenue Million Forecast, by Type 2019 & 2032
- Table 23: Global Gaming Simulators Market Revenue Million Forecast, by Country 2019 & 2032
Frequently Asked Questions
1. What is the projected Compound Annual Growth Rate (CAGR) of the Gaming Simulators Market?
The projected CAGR is approximately 13.49%.
2. Which companies are prominent players in the Gaming Simulators Market?
Key companies in the market include Microsoft, Electronic Arts Inc, NetEase Inc, Nintendo, Sony Interactive Entertainment Inc, Activision Blizzard Inc, Tencent, Square Enix Co Ltd *List Not Exhaustive, Take-Two Interactive Software Inc, Bandai Namco Entertainment Inc.
3. What are the main segments of the Gaming Simulators Market?
The market segments include Type.
4. Can you provide details about the market size?
The market size is estimated to be USD 8.14 Million as of 2022.
5. What are some drivers contributing to market growth?
Increased Adoption of Smartphones; Increased Utilization of Gaming Simulation for Training and Analysis Across a Variety of Fields; Growing Demand for VR Headsets.
6. What are the notable trends driving market growth?
Increased Adoption of Smartphones is Expected to Drive the Market Growth.
7. Are there any restraints impacting market growth?
Need for Expensive Graphic Cards.
8. Can you provide examples of recent developments in the market?
February 2022 - Gran Turismo SophyTM, the first superhuman AI agent to exceed the world's prominent drivers in the realistic PlayStation 4 racing simulation game Gran Turismo Sport, was announced by Polyphony Digital Inc. (PDI), and Sony Interactive Entertainment (SIE). Gamers all across the world will be able to access AI-powered gaming experiences delivered by GT Sophy.
9. What pricing options are available for accessing the report?
Pricing options include single-user, multi-user, and enterprise licenses priced at USD 4750, USD 5250, and USD 8750 respectively.
10. Is the market size provided in terms of value or volume?
The market size is provided in terms of value, measured in Million.
11. Are there any specific market keywords associated with the report?
Yes, the market keyword associated with the report is "Gaming Simulators Market," which aids in identifying and referencing the specific market segment covered.
12. How do I determine which pricing option suits my needs best?
The pricing options vary based on user requirements and access needs. Individual users may opt for single-user licenses, while businesses requiring broader access may choose multi-user or enterprise licenses for cost-effective access to the report.
13. Are there any additional resources or data provided in the Gaming Simulators Market report?
While the report offers comprehensive insights, it's advisable to review the specific contents or supplementary materials provided to ascertain if additional resources or data are available.
14. How can I stay updated on further developments or reports in the Gaming Simulators Market?
To stay informed about further developments, trends, and reports in the Gaming Simulators Market, consider subscribing to industry newsletters, following relevant companies and organizations, or regularly checking reputable industry news sources and publications.
Methodology
Step 1 - Identification of Relevant Samples Size from Population Database


Step 2 - Approaches for Defining Global Market Size (Value, Volume* & Price*)

Note*: In applicable scenarios
Step 3 - Data Sources
Primary Research
- Web Analytics
- Survey Reports
- Research Institute
- Latest Research Reports
- Opinion Leaders
Secondary Research
- Annual Reports
- White Paper
- Latest Press Release
- Industry Association
- Paid Database
- Investor Presentations

Step 4 - Data Triangulation
Involves using different sources of information in order to increase the validity of a study
These sources are likely to be stakeholders in a program - participants, other researchers, program staff, other community members, and so on.
Then we put all data in single framework & apply various statistical tools to find out the dynamic on the market.
During the analysis stage, feedback from the stakeholder groups would be compared to determine areas of agreement as well as areas of divergence


