
Key Insights
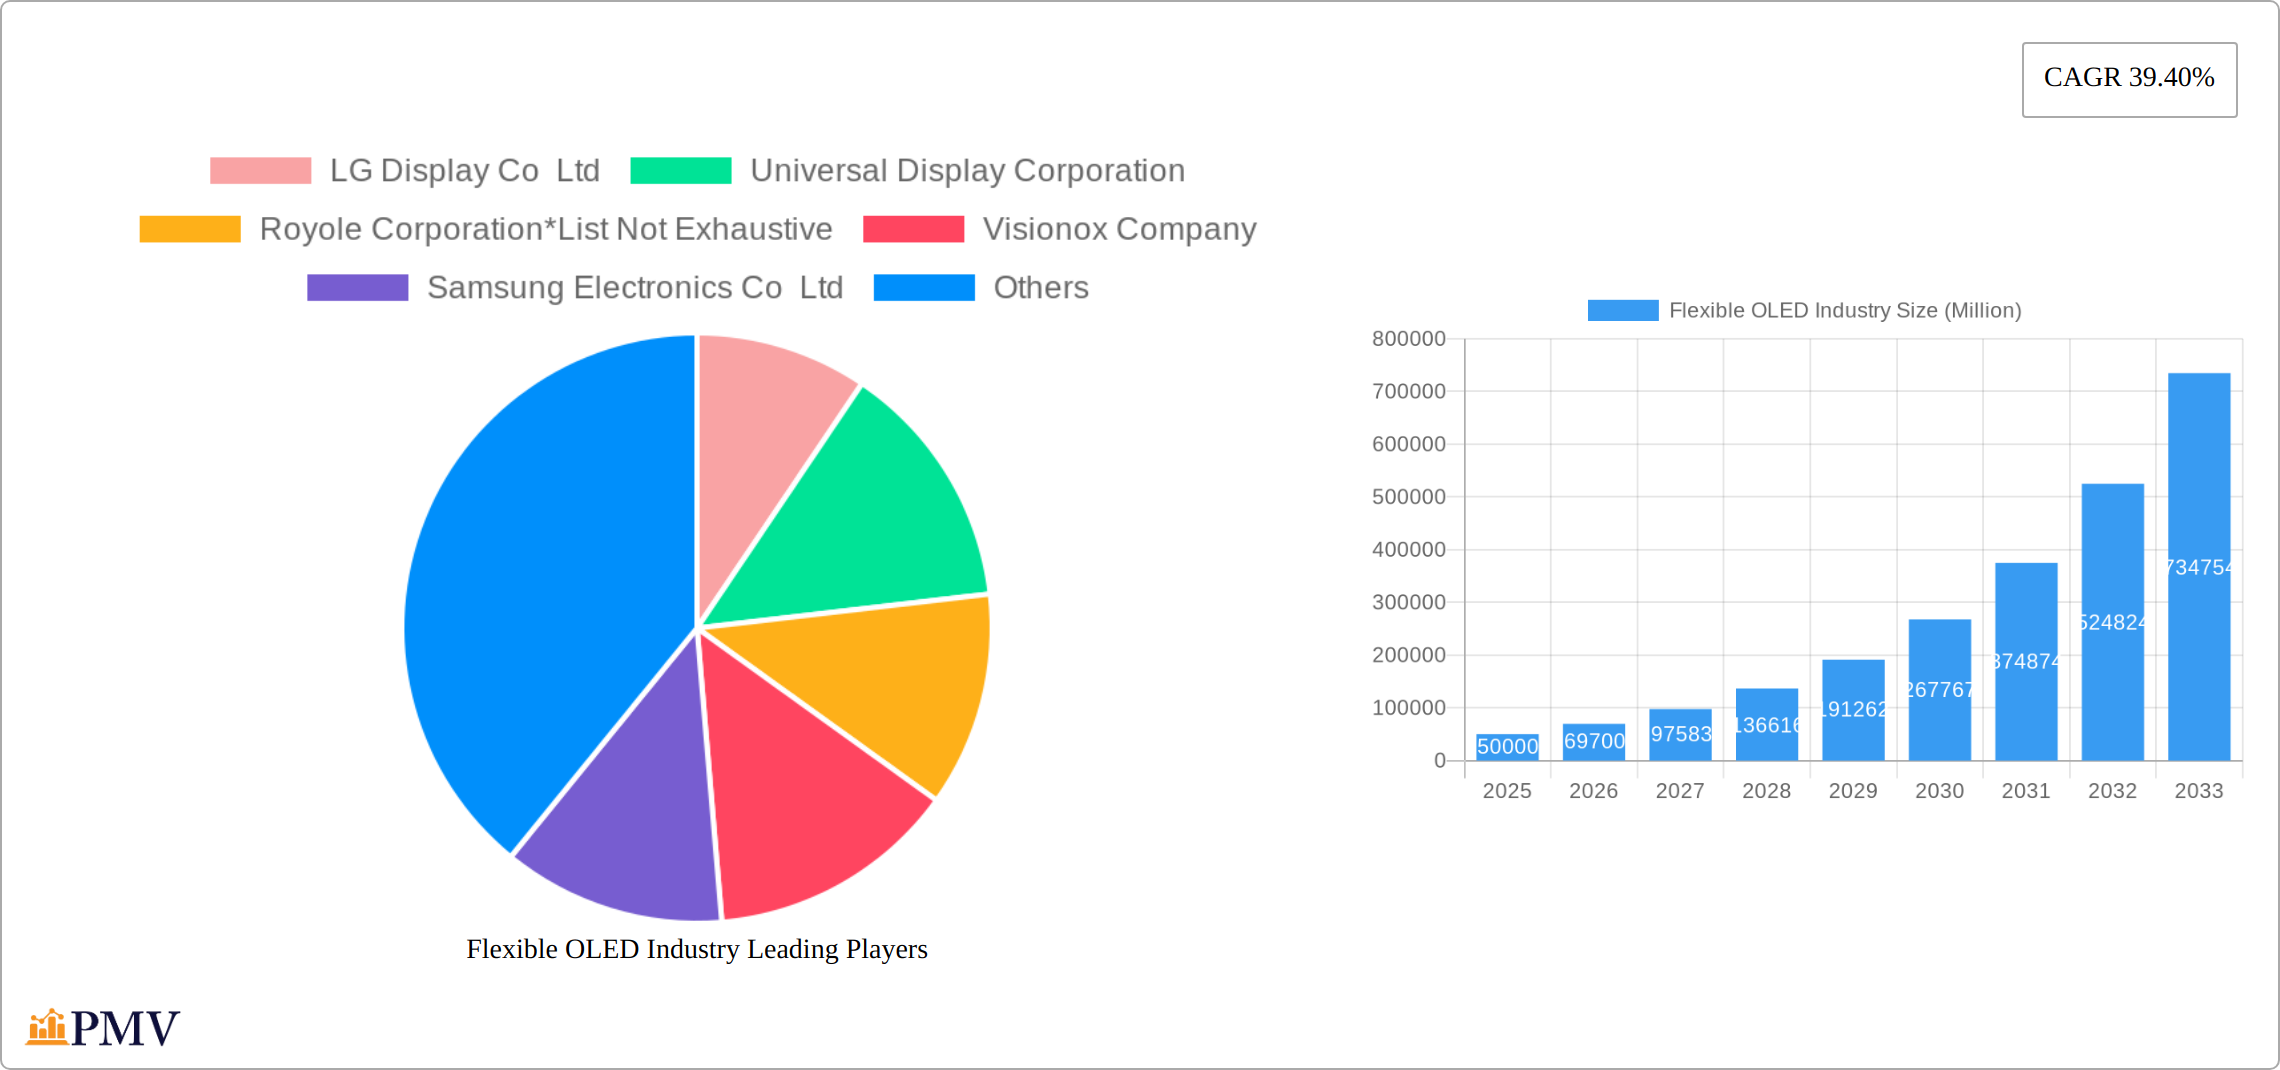
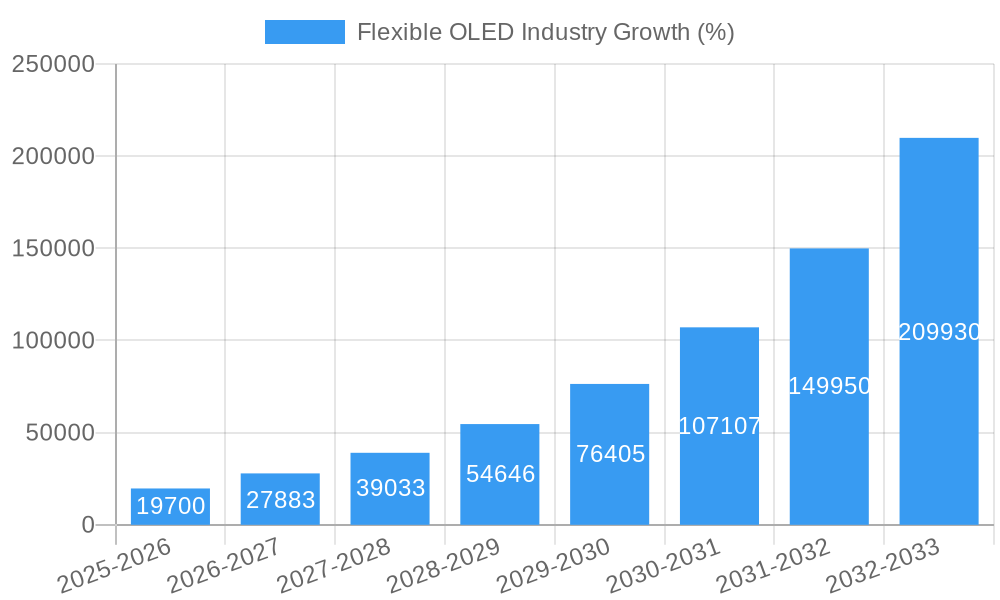
The flexible OLED market is experiencing explosive growth, driven by the increasing demand for foldable smartphones, flexible displays in wearables, and the adoption of advanced display technologies in various consumer electronics. The market's 39.40% CAGR from 2019 to 2024 indicates a significant upward trajectory, projected to continue throughout the forecast period (2025-2033). Key drivers include advancements in AMOLED and PMOLED technologies, resulting in thinner, lighter, and more energy-efficient displays. The rising popularity of foldable smartphones and the growing adoption of wearables are significantly boosting market demand. While challenges remain, such as the relatively higher manufacturing costs compared to traditional LCDs and potential supply chain constraints, technological advancements and economies of scale are expected to mitigate these issues. Segmentation reveals that the mobile and tablet segment currently holds the largest market share, followed by monitors and TVs and wearables. However, the wearables segment is anticipated to experience the fastest growth due to the increasing demand for smartwatches, fitness trackers, and other wearable devices featuring flexible displays. Major players like Samsung, LG Display, BOE Technology, and Universal Display Corporation are actively investing in R&D and expanding their production capacities to meet the surging market demand, leading to increased competition and innovation.
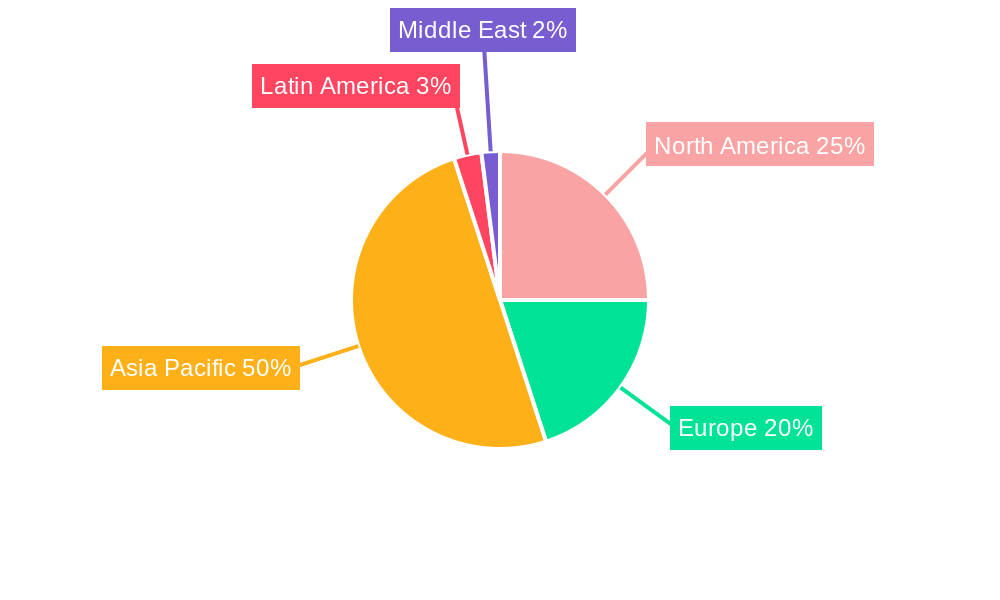
The Asia Pacific region is expected to dominate the flexible OLED market due to its robust manufacturing base, high consumer electronics demand, and a strong presence of key players. North America and Europe also contribute significantly, driven by the high adoption rate of advanced technologies and the presence of established consumer electronics markets. While precise regional market share data is not provided, logical estimations based on current market dynamics suggest that Asia Pacific holds the largest share, followed by North America and Europe. The "Other Applications" segment, which includes automotive displays and other niche applications, is anticipated to grow steadily as flexible OLED technology gains wider adoption in diverse sectors. The continuous innovation in flexible display technologies and the expanding applications across various industries collectively indicate a bright future for the flexible OLED market, with substantial growth potential over the next decade.
Flexible OLED Industry: A Comprehensive Market Report (2019-2033)
This in-depth report provides a comprehensive analysis of the Flexible OLED industry, encompassing market size, growth projections, competitive landscape, technological advancements, and key industry trends from 2019 to 2033. The study covers key segments, including AMOLED and PMOLED technologies and applications spanning mobiles & tablets, monitors & TVs, wearables, and other sectors. With a base year of 2025 and a forecast period extending to 2033, this report is an invaluable resource for businesses, investors, and researchers seeking to understand and navigate this dynamic market. The report projects a market value of xx Million by 2033, exhibiting a CAGR of xx% during the forecast period.
Flexible OLED Industry Market Structure & Competitive Dynamics
The flexible OLED market exhibits a moderately concentrated structure, with several key players dominating a significant portion of the global market share. Leading companies like LG Display Co Ltd, Samsung Electronics Co Ltd, BOE Technology Group, and Universal Display Corporation hold substantial influence, collectively accounting for an estimated [Insert Updated Percentage]% of the global market in 2024. This dynamic landscape is fueled by a robust innovation ecosystem, constantly advancing display technologies such as AMOLED and PMOLED. The regulatory environment varies across different regions, influencing manufacturing processes and international trade. While substitute products, primarily LCDs, present ongoing competitive pressure, the superior visual quality, flexibility, and increasingly cost-effective production of flexible OLEDs are driving significant market adoption. Strong end-user demand, particularly for foldable smartphones and high-resolution displays, is a key growth catalyst. Mergers and acquisitions (M&A) activity has been moderate, with deal values totaling an estimated [Insert Updated Value] million in the period 2019-2024, largely focused on strategic acquisitions designed to bolster technology portfolios and expand market reach. This activity reflects a competitive drive for technological leadership and market share expansion.
- Market Concentration: High ([Insert Updated Percentage]% held by top 5 players)
- Innovation Ecosystems: Robust, focusing on AMOLED and PMOLED advancements, including improvements in brightness, efficiency, and durability.
- Regulatory Frameworks: Regionally diverse, impacting manufacturing, trade, and material sourcing.
- Product Substitutes: LCDs present competitive pressure, but flexible OLED's superior features are driving a shift in market preference.
- End-User Trends: Strong demand driven by foldable devices, high-resolution displays, and the increasing demand for superior visual experiences.
- M&A Activity: Moderate activity ([Insert Updated Value] million total deal value, 2019-2024), driven by strategic acquisitions.
Flexible OLED Industry Industry Trends & Insights
The Flexible OLED industry is experiencing significant growth driven by several factors. The increasing demand for flexible and foldable displays in consumer electronics is a primary driver. Technological advancements, including improved energy efficiency and enhanced color reproduction in AMOLED displays and the development of low-power PMOLED technologies (like Visionox's 1Hz AMOLED), are further accelerating market expansion. Consumer preference for sleek, visually appealing devices fuels this trend. The competitive landscape is dynamic, with companies investing heavily in R&D to differentiate their products and gain market share. This is leading to a continuous improvement in display quality, reduced costs, and expanded applications. The market is witnessing a surge in the adoption of AMOLED technology due to its superior performance characteristics. The projected CAGR for the Flexible OLED market during the forecast period (2025-2033) is xx%, and market penetration is expected to reach xx% by 2033.
Dominant Markets & Segments in Flexible OLED Industry
The Asia-Pacific region reigns as the dominant market for flexible OLEDs, fueled by substantial consumer electronics demand and robust manufacturing capabilities. Within this region, China and South Korea are leading contributors due to their large-scale production facilities and strong domestic demand. However, other regions are experiencing increasing growth, indicating a global expansion of the market.
By Technology:
- AMOLED: Continues to dominate the market due to its superior visual quality, flexibility, and increasingly competitive pricing. Key drivers include ongoing advancements in manufacturing processes that lead to cost reductions, improved energy efficiency, and enhanced color reproduction.
- PMOLED: Represents a smaller, yet growing, segment, particularly attractive for low-power applications in wearables and other niche markets. Key drivers include advancements in power efficiency, miniaturization, and the growing demand for smaller, more power-efficient displays.
By Application:
- Mobiles and Tablets: Remains the largest application segment, driven by the booming popularity of foldable smartphones and high-resolution tablets. Key drivers include consumer preference for slim designs, enhanced user experiences, and the ability to create more immersive interfaces.
- Monitors and TVs: Experiencing rapid growth due to the increasing availability and affordability of high-quality flexible OLED TVs that deliver superior image clarity and an immersive viewing experience. Key drivers include the demand for larger screen sizes and superior picture quality compared to traditional technologies.
- Wearables: A substantial and expanding segment, driven by the integration of flexible OLEDs into smartwatches, fitness trackers, and other wearable technologies. Key drivers include the rising popularity of wearables and ongoing technological advancements leading to slimmer, more energy-efficient designs.
- Automotive and Other Applications: This segment encompasses automotive displays, medical devices, and other niche applications, showcasing steady growth potential. Key drivers include technological advancements, increasing adoption across various industries, and the demand for high-quality displays in diverse applications.
Flexible OLED Industry Product Innovations
Recent product innovations focus on improving efficiency, brightness, and flexibility. The introduction of high-refresh-rate AMOLED displays and low-power PMOLED technologies like Visionox's 1Hz display demonstrates a push for improved power efficiency and user experience. New manufacturing techniques also enable larger, more flexible displays, expanding potential applications. These innovations are driving market expansion by enhancing product appeal and usability.
Report Segmentation & Scope
This report segments the Flexible OLED market by technology (AMOLED and PMOLED) and application (Mobiles and Tablets, Monitors and TVs, Wearables, and Other Applications). Each segment is analyzed in detail, providing market size, growth projections, competitive dynamics, and key drivers. For instance, the AMOLED segment is expected to show higher growth compared to PMOLED due to superior image quality and widespread adoption in high-end smartphones. The Mobiles and Tablets segment is expected to remain the largest in terms of revenue throughout the forecast period.
Key Drivers of Flexible OLED Industry Growth
The Flexible OLED industry's growth is driven by several key factors:
- Technological advancements: Improvements in display technology, leading to higher resolution, enhanced color accuracy, and increased flexibility.
- Increasing demand for flexible displays: The rising popularity of foldable smartphones and other flexible consumer electronics is a major driver.
- Favorable government policies: Policies promoting the development and adoption of advanced display technologies in certain regions.
Challenges in the Flexible OLED Industry Sector
The flexible OLED industry faces several key challenges:
- High manufacturing costs: While decreasing, production costs remain relatively high compared to alternative display technologies, impacting market accessibility and affordability.
- Supply chain vulnerabilities: The global supply chain remains susceptible to disruptions, impacting production volumes and market stability. Geopolitical factors and material shortages can significantly affect the industry.
- Intense competition: The market's highly competitive nature creates price pressure and necessitates continuous innovation to maintain a competitive edge.
- Technological hurdles: Further advancements are needed to address issues such as burn-in, increased lifespan, and improved energy efficiency.
Leading Players in the Flexible OLED Industry Market
- LG Display Co Ltd
- Universal Display Corporation
- Royole Corporation
- Visionox Company
- Samsung Electronics Co Ltd
- BOE Technology UK Limited
- Ritdisplay Corporation
- AUO Corporation
- WiseChip Semiconductor Inc
Key Developments in Flexible OLED Industry Sector
- [Insert Year]: [Insert Company] launched [Insert Product] with [Insert Key Features and Improvements].
- [Insert Year]: [Insert Company] announced [Insert Significant Development or Partnership].
- [Insert Year]: [Insert significant technological breakthrough, such as improved yield rates or new material development].
Strategic Flexible OLED Industry Market Outlook
The flexible OLED market is projected for substantial growth, driven by continuous technological advancements, increasing consumer demand for visually superior displays, and expanding applications across diverse industries. Strategic opportunities exist for companies focusing on developing innovative products with enhanced features, optimizing manufacturing processes for cost efficiency and higher yields, and expanding into emerging markets. The market's future trajectory hinges on manufacturers' ability to address the remaining cost challenges, continually enhance product capabilities, meet the evolving needs of consumers, and navigate the complexities of the global supply chain.
Flexible OLED Industry Segmentation
-
1. Technology
- 1.1. AMOLED
- 1.2. PMOLED
-
2. Application
- 2.1. Mobiles and Tablets
- 2.2. Monitors and TVs
- 2.3. Wearables
- 2.4. Other Applications
Flexible OLED Industry Segmentation By Geography
- 1. North America
- 2. Europe
- 3. Asia Pacific
- 4. Latin America
- 5. Middle East
Flexible OLED Industry REPORT HIGHLIGHTS
| Aspects | Details |
|---|---|
| Study Period | 2019-2033 |
| Base Year | 2024 |
| Estimated Year | 2025 |
| Forecast Period | 2025-2033 |
| Historical Period | 2019-2024 |
| Growth Rate | CAGR of 39.40% from 2019-2033 |
| Segmentation |
|
Table of Contents
- 1. Introduction
- 1.1. Research Scope
- 1.2. Market Segmentation
- 1.3. Research Methodology
- 1.4. Definitions and Assumptions
- 2. Executive Summary
- 2.1. Introduction
- 3. Market Dynamics
- 3.1. Introduction
- 3.2. Market Drivers
- 3.2.1. Increasing Demand for OLED in Smartphone Panels; Technological Advancements in Display Market
- 3.3. Market Restrains
- 3.3.1. ; Competition with Existing Display Technologies
- 3.4. Market Trends
- 3.4.1. Mobiles and Televisions to Witness Significant Growth
- 4. Market Factor Analysis
- 4.1. Porters Five Forces
- 4.2. Supply/Value Chain
- 4.3. PESTEL analysis
- 4.4. Market Entropy
- 4.5. Patent/Trademark Analysis
- 5. Global Flexible OLED Industry Analysis, Insights and Forecast, 2019-2031
- 5.1. Market Analysis, Insights and Forecast - by Technology
- 5.1.1. AMOLED
- 5.1.2. PMOLED
- 5.2. Market Analysis, Insights and Forecast - by Application
- 5.2.1. Mobiles and Tablets
- 5.2.2. Monitors and TVs
- 5.2.3. Wearables
- 5.2.4. Other Applications
- 5.3. Market Analysis, Insights and Forecast - by Region
- 5.3.1. North America
- 5.3.2. Europe
- 5.3.3. Asia Pacific
- 5.3.4. Latin America
- 5.3.5. Middle East
- 5.1. Market Analysis, Insights and Forecast - by Technology
- 6. North America Flexible OLED Industry Analysis, Insights and Forecast, 2019-2031
- 6.1. Market Analysis, Insights and Forecast - by Technology
- 6.1.1. AMOLED
- 6.1.2. PMOLED
- 6.2. Market Analysis, Insights and Forecast - by Application
- 6.2.1. Mobiles and Tablets
- 6.2.2. Monitors and TVs
- 6.2.3. Wearables
- 6.2.4. Other Applications
- 6.1. Market Analysis, Insights and Forecast - by Technology
- 7. Europe Flexible OLED Industry Analysis, Insights and Forecast, 2019-2031
- 7.1. Market Analysis, Insights and Forecast - by Technology
- 7.1.1. AMOLED
- 7.1.2. PMOLED
- 7.2. Market Analysis, Insights and Forecast - by Application
- 7.2.1. Mobiles and Tablets
- 7.2.2. Monitors and TVs
- 7.2.3. Wearables
- 7.2.4. Other Applications
- 7.1. Market Analysis, Insights and Forecast - by Technology
- 8. Asia Pacific Flexible OLED Industry Analysis, Insights and Forecast, 2019-2031
- 8.1. Market Analysis, Insights and Forecast - by Technology
- 8.1.1. AMOLED
- 8.1.2. PMOLED
- 8.2. Market Analysis, Insights and Forecast - by Application
- 8.2.1. Mobiles and Tablets
- 8.2.2. Monitors and TVs
- 8.2.3. Wearables
- 8.2.4. Other Applications
- 8.1. Market Analysis, Insights and Forecast - by Technology
- 9. Latin America Flexible OLED Industry Analysis, Insights and Forecast, 2019-2031
- 9.1. Market Analysis, Insights and Forecast - by Technology
- 9.1.1. AMOLED
- 9.1.2. PMOLED
- 9.2. Market Analysis, Insights and Forecast - by Application
- 9.2.1. Mobiles and Tablets
- 9.2.2. Monitors and TVs
- 9.2.3. Wearables
- 9.2.4. Other Applications
- 9.1. Market Analysis, Insights and Forecast - by Technology
- 10. Middle East Flexible OLED Industry Analysis, Insights and Forecast, 2019-2031
- 10.1. Market Analysis, Insights and Forecast - by Technology
- 10.1.1. AMOLED
- 10.1.2. PMOLED
- 10.2. Market Analysis, Insights and Forecast - by Application
- 10.2.1. Mobiles and Tablets
- 10.2.2. Monitors and TVs
- 10.2.3. Wearables
- 10.2.4. Other Applications
- 10.1. Market Analysis, Insights and Forecast - by Technology
- 11. North America Flexible OLED Industry Analysis, Insights and Forecast, 2019-2031
- 11.1. Market Analysis, Insights and Forecast - By Country/Sub-region
- 11.1.1.
- 12. Europe Flexible OLED Industry Analysis, Insights and Forecast, 2019-2031
- 12.1. Market Analysis, Insights and Forecast - By Country/Sub-region
- 12.1.1.
- 13. Asia Pacific Flexible OLED Industry Analysis, Insights and Forecast, 2019-2031
- 13.1. Market Analysis, Insights and Forecast - By Country/Sub-region
- 13.1.1.
- 14. Latin America Flexible OLED Industry Analysis, Insights and Forecast, 2019-2031
- 14.1. Market Analysis, Insights and Forecast - By Country/Sub-region
- 14.1.1.
- 15. Middle East Flexible OLED Industry Analysis, Insights and Forecast, 2019-2031
- 15.1. Market Analysis, Insights and Forecast - By Country/Sub-region
- 15.1.1.
- 16. Competitive Analysis
- 16.1. Global Market Share Analysis 2024
- 16.2. Company Profiles
- 16.2.1 LG Display Co Ltd
- 16.2.1.1. Overview
- 16.2.1.2. Products
- 16.2.1.3. SWOT Analysis
- 16.2.1.4. Recent Developments
- 16.2.1.5. Financials (Based on Availability)
- 16.2.2 Universal Display Corporation
- 16.2.2.1. Overview
- 16.2.2.2. Products
- 16.2.2.3. SWOT Analysis
- 16.2.2.4. Recent Developments
- 16.2.2.5. Financials (Based on Availability)
- 16.2.3 Royole Corporation*List Not Exhaustive
- 16.2.3.1. Overview
- 16.2.3.2. Products
- 16.2.3.3. SWOT Analysis
- 16.2.3.4. Recent Developments
- 16.2.3.5. Financials (Based on Availability)
- 16.2.4 Visionox Company
- 16.2.4.1. Overview
- 16.2.4.2. Products
- 16.2.4.3. SWOT Analysis
- 16.2.4.4. Recent Developments
- 16.2.4.5. Financials (Based on Availability)
- 16.2.5 Samsung Electronics Co Ltd
- 16.2.5.1. Overview
- 16.2.5.2. Products
- 16.2.5.3. SWOT Analysis
- 16.2.5.4. Recent Developments
- 16.2.5.5. Financials (Based on Availability)
- 16.2.6 BOE Technology UK Limited
- 16.2.6.1. Overview
- 16.2.6.2. Products
- 16.2.6.3. SWOT Analysis
- 16.2.6.4. Recent Developments
- 16.2.6.5. Financials (Based on Availability)
- 16.2.7 Ritdisplay Corporation
- 16.2.7.1. Overview
- 16.2.7.2. Products
- 16.2.7.3. SWOT Analysis
- 16.2.7.4. Recent Developments
- 16.2.7.5. Financials (Based on Availability)
- 16.2.8 AUO Corporation
- 16.2.8.1. Overview
- 16.2.8.2. Products
- 16.2.8.3. SWOT Analysis
- 16.2.8.4. Recent Developments
- 16.2.8.5. Financials (Based on Availability)
- 16.2.9 WiseChip Semiconductor Inc
- 16.2.9.1. Overview
- 16.2.9.2. Products
- 16.2.9.3. SWOT Analysis
- 16.2.9.4. Recent Developments
- 16.2.9.5. Financials (Based on Availability)
- 16.2.1 LG Display Co Ltd
List of Figures
- Figure 1: Global Flexible OLED Industry Revenue Breakdown (Million, %) by Region 2024 & 2032
- Figure 2: North America Flexible OLED Industry Revenue (Million), by Country 2024 & 2032
- Figure 3: North America Flexible OLED Industry Revenue Share (%), by Country 2024 & 2032
- Figure 4: Europe Flexible OLED Industry Revenue (Million), by Country 2024 & 2032
- Figure 5: Europe Flexible OLED Industry Revenue Share (%), by Country 2024 & 2032
- Figure 6: Asia Pacific Flexible OLED Industry Revenue (Million), by Country 2024 & 2032
- Figure 7: Asia Pacific Flexible OLED Industry Revenue Share (%), by Country 2024 & 2032
- Figure 8: Latin America Flexible OLED Industry Revenue (Million), by Country 2024 & 2032
- Figure 9: Latin America Flexible OLED Industry Revenue Share (%), by Country 2024 & 2032
- Figure 10: Middle East Flexible OLED Industry Revenue (Million), by Country 2024 & 2032
- Figure 11: Middle East Flexible OLED Industry Revenue Share (%), by Country 2024 & 2032
- Figure 12: North America Flexible OLED Industry Revenue (Million), by Technology 2024 & 2032
- Figure 13: North America Flexible OLED Industry Revenue Share (%), by Technology 2024 & 2032
- Figure 14: North America Flexible OLED Industry Revenue (Million), by Application 2024 & 2032
- Figure 15: North America Flexible OLED Industry Revenue Share (%), by Application 2024 & 2032
- Figure 16: North America Flexible OLED Industry Revenue (Million), by Country 2024 & 2032
- Figure 17: North America Flexible OLED Industry Revenue Share (%), by Country 2024 & 2032
- Figure 18: Europe Flexible OLED Industry Revenue (Million), by Technology 2024 & 2032
- Figure 19: Europe Flexible OLED Industry Revenue Share (%), by Technology 2024 & 2032
- Figure 20: Europe Flexible OLED Industry Revenue (Million), by Application 2024 & 2032
- Figure 21: Europe Flexible OLED Industry Revenue Share (%), by Application 2024 & 2032
- Figure 22: Europe Flexible OLED Industry Revenue (Million), by Country 2024 & 2032
- Figure 23: Europe Flexible OLED Industry Revenue Share (%), by Country 2024 & 2032
- Figure 24: Asia Pacific Flexible OLED Industry Revenue (Million), by Technology 2024 & 2032
- Figure 25: Asia Pacific Flexible OLED Industry Revenue Share (%), by Technology 2024 & 2032
- Figure 26: Asia Pacific Flexible OLED Industry Revenue (Million), by Application 2024 & 2032
- Figure 27: Asia Pacific Flexible OLED Industry Revenue Share (%), by Application 2024 & 2032
- Figure 28: Asia Pacific Flexible OLED Industry Revenue (Million), by Country 2024 & 2032
- Figure 29: Asia Pacific Flexible OLED Industry Revenue Share (%), by Country 2024 & 2032
- Figure 30: Latin America Flexible OLED Industry Revenue (Million), by Technology 2024 & 2032
- Figure 31: Latin America Flexible OLED Industry Revenue Share (%), by Technology 2024 & 2032
- Figure 32: Latin America Flexible OLED Industry Revenue (Million), by Application 2024 & 2032
- Figure 33: Latin America Flexible OLED Industry Revenue Share (%), by Application 2024 & 2032
- Figure 34: Latin America Flexible OLED Industry Revenue (Million), by Country 2024 & 2032
- Figure 35: Latin America Flexible OLED Industry Revenue Share (%), by Country 2024 & 2032
- Figure 36: Middle East Flexible OLED Industry Revenue (Million), by Technology 2024 & 2032
- Figure 37: Middle East Flexible OLED Industry Revenue Share (%), by Technology 2024 & 2032
- Figure 38: Middle East Flexible OLED Industry Revenue (Million), by Application 2024 & 2032
- Figure 39: Middle East Flexible OLED Industry Revenue Share (%), by Application 2024 & 2032
- Figure 40: Middle East Flexible OLED Industry Revenue (Million), by Country 2024 & 2032
- Figure 41: Middle East Flexible OLED Industry Revenue Share (%), by Country 2024 & 2032
List of Tables
- Table 1: Global Flexible OLED Industry Revenue Million Forecast, by Region 2019 & 2032
- Table 2: Global Flexible OLED Industry Revenue Million Forecast, by Technology 2019 & 2032
- Table 3: Global Flexible OLED Industry Revenue Million Forecast, by Application 2019 & 2032
- Table 4: Global Flexible OLED Industry Revenue Million Forecast, by Region 2019 & 2032
- Table 5: Global Flexible OLED Industry Revenue Million Forecast, by Country 2019 & 2032
- Table 6: Flexible OLED Industry Revenue (Million) Forecast, by Application 2019 & 2032
- Table 7: Global Flexible OLED Industry Revenue Million Forecast, by Country 2019 & 2032
- Table 8: Flexible OLED Industry Revenue (Million) Forecast, by Application 2019 & 2032
- Table 9: Global Flexible OLED Industry Revenue Million Forecast, by Country 2019 & 2032
- Table 10: Flexible OLED Industry Revenue (Million) Forecast, by Application 2019 & 2032
- Table 11: Global Flexible OLED Industry Revenue Million Forecast, by Country 2019 & 2032
- Table 12: Flexible OLED Industry Revenue (Million) Forecast, by Application 2019 & 2032
- Table 13: Global Flexible OLED Industry Revenue Million Forecast, by Country 2019 & 2032
- Table 14: Flexible OLED Industry Revenue (Million) Forecast, by Application 2019 & 2032
- Table 15: Global Flexible OLED Industry Revenue Million Forecast, by Technology 2019 & 2032
- Table 16: Global Flexible OLED Industry Revenue Million Forecast, by Application 2019 & 2032
- Table 17: Global Flexible OLED Industry Revenue Million Forecast, by Country 2019 & 2032
- Table 18: Global Flexible OLED Industry Revenue Million Forecast, by Technology 2019 & 2032
- Table 19: Global Flexible OLED Industry Revenue Million Forecast, by Application 2019 & 2032
- Table 20: Global Flexible OLED Industry Revenue Million Forecast, by Country 2019 & 2032
- Table 21: Global Flexible OLED Industry Revenue Million Forecast, by Technology 2019 & 2032
- Table 22: Global Flexible OLED Industry Revenue Million Forecast, by Application 2019 & 2032
- Table 23: Global Flexible OLED Industry Revenue Million Forecast, by Country 2019 & 2032
- Table 24: Global Flexible OLED Industry Revenue Million Forecast, by Technology 2019 & 2032
- Table 25: Global Flexible OLED Industry Revenue Million Forecast, by Application 2019 & 2032
- Table 26: Global Flexible OLED Industry Revenue Million Forecast, by Country 2019 & 2032
- Table 27: Global Flexible OLED Industry Revenue Million Forecast, by Technology 2019 & 2032
- Table 28: Global Flexible OLED Industry Revenue Million Forecast, by Application 2019 & 2032
- Table 29: Global Flexible OLED Industry Revenue Million Forecast, by Country 2019 & 2032
Frequently Asked Questions
1. What is the projected Compound Annual Growth Rate (CAGR) of the Flexible OLED Industry?
The projected CAGR is approximately 39.40%.
2. Which companies are prominent players in the Flexible OLED Industry?
Key companies in the market include LG Display Co Ltd, Universal Display Corporation, Royole Corporation*List Not Exhaustive, Visionox Company, Samsung Electronics Co Ltd, BOE Technology UK Limited, Ritdisplay Corporation, AUO Corporation, WiseChip Semiconductor Inc.
3. What are the main segments of the Flexible OLED Industry?
The market segments include Technology, Application.
4. Can you provide details about the market size?
The market size is estimated to be USD XX Million as of 2022.
5. What are some drivers contributing to market growth?
Increasing Demand for OLED in Smartphone Panels; Technological Advancements in Display Market.
6. What are the notable trends driving market growth?
Mobiles and Televisions to Witness Significant Growth.
7. Are there any restraints impacting market growth?
; Competition with Existing Display Technologies.
8. Can you provide examples of recent developments in the market?
June 2022 - LG Display creates new markets with cutting-edge OLED solutions. The company launched upgraded versions of G2& C2 televisions. Both versions are making use of upgraded OLED technology to create even better visuals. This technology enables the displays to deliver higher brightness with greater clarity and detail. The new sizes of the G2 series are introduced alongside three other sizes (55", 65", and 77"). The C2 series gets a total of 6 display sizes.
9. What pricing options are available for accessing the report?
Pricing options include single-user, multi-user, and enterprise licenses priced at USD 4750, USD 5250, and USD 8750 respectively.
10. Is the market size provided in terms of value or volume?
The market size is provided in terms of value, measured in Million.
11. Are there any specific market keywords associated with the report?
Yes, the market keyword associated with the report is "Flexible OLED Industry," which aids in identifying and referencing the specific market segment covered.
12. How do I determine which pricing option suits my needs best?
The pricing options vary based on user requirements and access needs. Individual users may opt for single-user licenses, while businesses requiring broader access may choose multi-user or enterprise licenses for cost-effective access to the report.
13. Are there any additional resources or data provided in the Flexible OLED Industry report?
While the report offers comprehensive insights, it's advisable to review the specific contents or supplementary materials provided to ascertain if additional resources or data are available.
14. How can I stay updated on further developments or reports in the Flexible OLED Industry?
To stay informed about further developments, trends, and reports in the Flexible OLED Industry, consider subscribing to industry newsletters, following relevant companies and organizations, or regularly checking reputable industry news sources and publications.
Methodology
Step 1 - Identification of Relevant Samples Size from Population Database


Step 2 - Approaches for Defining Global Market Size (Value, Volume* & Price*)

Note*: In applicable scenarios
Step 3 - Data Sources
Primary Research
- Web Analytics
- Survey Reports
- Research Institute
- Latest Research Reports
- Opinion Leaders
Secondary Research
- Annual Reports
- White Paper
- Latest Press Release
- Industry Association
- Paid Database
- Investor Presentations

Step 4 - Data Triangulation
Involves using different sources of information in order to increase the validity of a study
These sources are likely to be stakeholders in a program - participants, other researchers, program staff, other community members, and so on.
Then we put all data in single framework & apply various statistical tools to find out the dynamic on the market.
During the analysis stage, feedback from the stakeholder groups would be compared to determine areas of agreement as well as areas of divergence


