
Key Insights
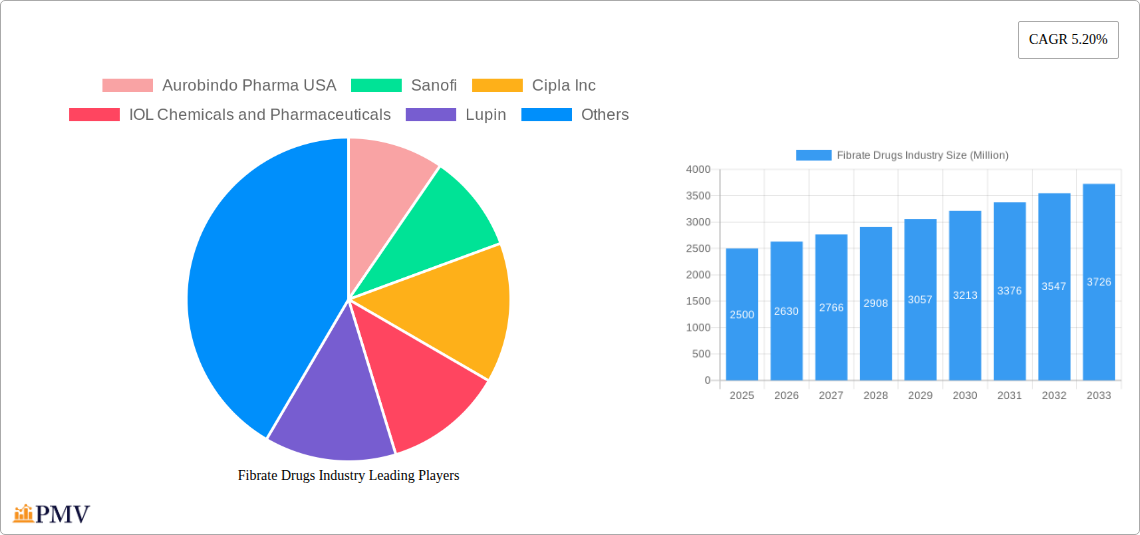
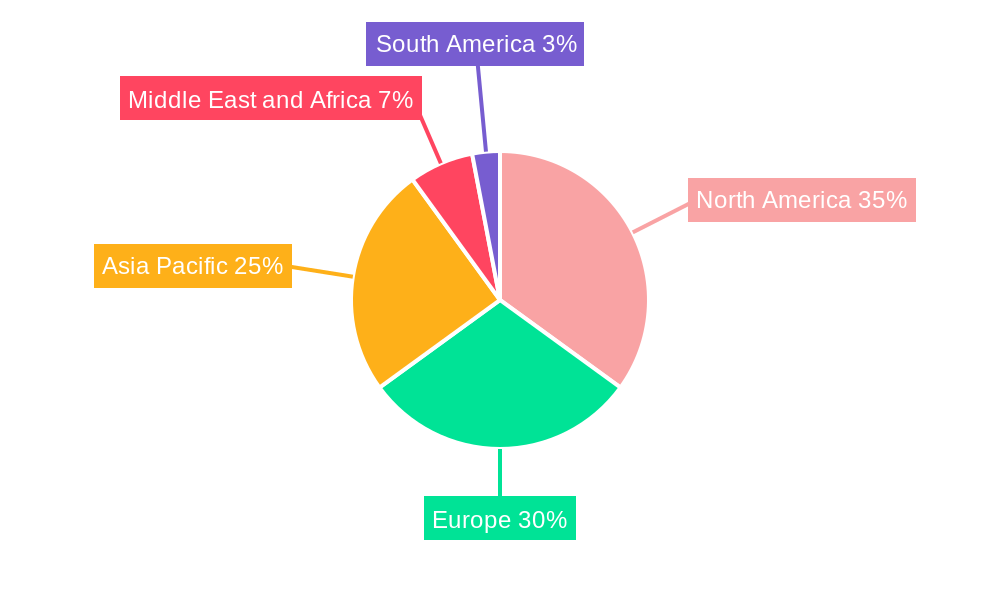
The Fibrate Drugs market, encompassing medications like clofibrate, gemfibrozil, and fenofibrate, is experiencing steady growth, projected at a 5.20% CAGR from 2025 to 2033. This growth is driven by an aging global population with increasing prevalence of dyslipidemia and cardiovascular diseases, necessitating effective lipid-lowering therapies. The market is segmented by distribution channel (hospital and retail pharmacies, online pharmacies), drug type (clofibrate, gemfibrozil, fenofibrate, and others), and product type (branded and generic). Generic fibrates are gaining significant market share due to their affordability compared to branded options, a trend expected to continue throughout the forecast period. While the market faces restraints such as the emergence of newer lipid-lowering agents (statins and PCSK9 inhibitors) and potential side effects associated with fibrate use, the substantial patient population requiring lipid management ensures continued market demand. The geographic distribution shows a strong presence across North America and Europe, reflecting established healthcare infrastructure and higher prevalence rates of target diseases. Asia Pacific is also anticipated to exhibit significant growth due to rising healthcare expenditure and increasing awareness of cardiovascular health. Major players like Aurobindo Pharma USA, Sanofi, Cipla Inc, and others are actively engaged in market competition, driving innovation and ensuring product availability across various regions and distribution channels. The market's future hinges on managing the balance between cost-effective generic options and the development of safer, more targeted therapies for dyslipidemia.
The competitive landscape is characterized by both established multinational pharmaceutical companies and emerging generic manufacturers. The strategic focus is shifting towards expanding into emerging markets, increasing generic drug production to meet the growing demand, and focusing on improving the safety profile of existing formulations. Further research and development efforts are directed toward optimizing drug delivery systems and exploring combination therapies to enhance treatment efficacy and reduce side effects. Regulatory approvals and pricing strategies play significant roles in influencing market dynamics. The increasing adoption of online pharmacies further contributes to market expansion, particularly in regions with improved internet penetration and digital healthcare infrastructure. Predicting precise market size figures requires more granular data, but given the CAGR and market trends, a reasonable estimation for the 2025 market size would be in the range of several billion dollars, considering the various segments and geographical markets involved.
Fibrate Drugs Industry Market Report: 2019-2033
This comprehensive report provides a detailed analysis of the global Fibrate Drugs market, offering invaluable insights for industry stakeholders, investors, and researchers. With a study period spanning 2019-2033, a base year of 2025, and an estimated and forecast period of 2025-2033, this report delivers a robust understanding of past performance, current market dynamics, and future growth projections. The report encompasses a thorough examination of market segmentation by distribution channel (Hospital and Retail Pharmacy, Online Pharmacy), drug type (Clofibrate, Gemfibrozil, Fenofibrate, Other Drugs), and product type (Branded, Generic). Key players like Aurobindo Pharma USA, Sanofi, Cipla Inc, IOL Chemicals and Pharmaceuticals, Lupin, Mylan Inc, Abbott, Sun Pharmaceutical Industries Ltd, Macleods Pharmaceuticals Ltd, Zydus Cadila, Socosur Chem, and Unnati Pharmaceuticals Pvt Ltd are analyzed in detail. The report projects a market size of xx Million by 2033.
Fibrate Drugs Industry Market Structure & Competitive Dynamics
The Fibrate Drugs market exhibits a moderately concentrated structure, with several large multinational pharmaceutical companies holding significant market share. The competitive landscape is characterized by intense rivalry, driven by factors such as brand loyalty, pricing strategies, and product differentiation. Innovation plays a crucial role, with companies continuously striving to develop novel formulations and delivery systems. Regulatory frameworks, including FDA approvals and pricing regulations, significantly impact market dynamics. The presence of substitute drugs and the evolving preferences of end-users (physicians and patients) further shape the competitive environment. Mergers and acquisitions (M&A) activities have played a significant role in market consolidation, with deal values reaching xx Million in recent years. For instance, [Insert example of an M&A deal if available, including deal value]. Market share data indicates that [mention the market share of top 3-5 players if available, otherwise use estimated values like "Top 3 players hold approximately 60% of the market share"].
- Market Concentration: Moderately Concentrated
- Innovation Ecosystems: Active R&D and Formulation Development
- Regulatory Frameworks: Stringent approvals and pricing regulations
- Product Substitutes: Statins and other lipid-lowering agents
- End-User Trends: Growing demand for convenient and effective treatments
- M&A Activities: Significant consolidation through acquisitions, deal values reaching xx Million annually.
Fibrate Drugs Industry Industry Trends & Insights
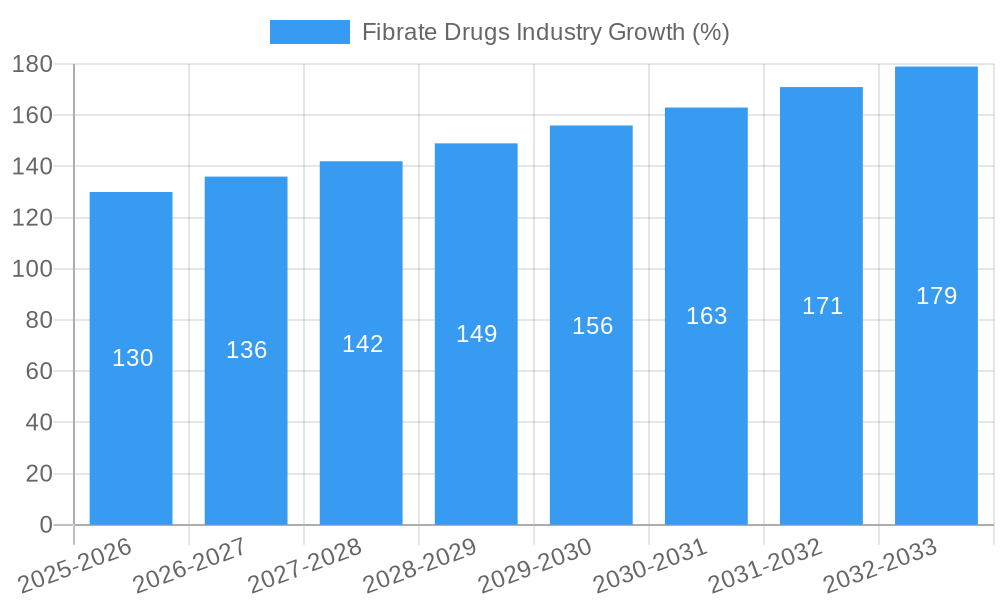
The Fibrate Drugs market is witnessing robust growth, driven by a surge in cardiovascular diseases globally. The increasing prevalence of hyperlipidemia, a major risk factor for heart disease, fuels the demand for effective lipid-lowering therapies. Technological advancements, including novel drug delivery systems and personalized medicine approaches, are further propelling market expansion. Consumer preferences are shifting towards branded drugs with improved efficacy and safety profiles, while the growing adoption of online pharmacies is transforming the distribution landscape. The market is projected to witness a CAGR of xx% during the forecast period (2025-2033), with market penetration expected to reach xx% by 2033. Competitive dynamics remain intense, with companies focusing on strategic partnerships, product diversification, and expansion into new markets to maintain their market share. The increasing focus on cost-effectiveness and the growing adoption of generic fibrate drugs are also influencing market trends.
Dominant Markets & Segments in Fibrate Drugs Industry
The North American region currently holds the largest market share in the Fibrate Drugs industry, driven by factors such as high prevalence of cardiovascular diseases, robust healthcare infrastructure, and high per capita healthcare expenditure. Within North America, the United States is the dominant market.
- Key Drivers in North America:
- High prevalence of cardiovascular diseases
- Well-developed healthcare infrastructure
- High per capita healthcare expenditure
- Strong regulatory framework supporting drug development and approval
- High adoption of branded drugs
- Dominant Drug Segment: Gemfibrozil holds a significant market share due to its established efficacy and relatively lower cost compared to other fibrate drugs.
- Dominant Distribution Channel: Hospital and Retail Pharmacy still hold the largest share in the distribution channel however online pharmacy segment is growing rapidly.
- Dominant Product Type: The Generic segment holds a larger share of the market owing to its cost-effectiveness.
Fibrate Drugs Industry Product Innovations
Recent product innovations in the fibrate drugs market focus on enhancing efficacy, improving safety profiles, and developing novel delivery systems. Technological advancements in drug formulation and targeted drug delivery are leading to improved patient outcomes and convenience. Companies are focusing on developing combination therapies that integrate fibrates with other lipid-lowering agents to provide a comprehensive approach to managing hyperlipidemia. These innovations are crucial for maintaining market competitiveness and capturing a larger market share.
Report Segmentation & Scope
This report segments the Fibrate Drugs market based on distribution channel (Hospital and Retail Pharmacy, Online Pharmacy), drug type (Clofibrate, Gemfibrozil, Fenofibrate, Other Drugs), and product type (Branded, Generic). Each segment's growth projections, market size, and competitive dynamics are analyzed in detail. The Hospital and Retail Pharmacy channel currently dominates, but the Online Pharmacy segment is experiencing rapid growth due to increased internet penetration and convenience. Gemfibrozil holds a large share in the drug type segment. The generic segment is rapidly expanding due to cost advantages, with branded drugs commanding higher prices based on their efficacy and brand recognition.
Key Drivers of Fibrate Drugs Industry Growth
The Fibrate Drugs market is propelled by several key factors, including the rising prevalence of cardiovascular diseases worldwide, particularly hyperlipidemia, and an aging global population. Technological advancements in drug formulation, delivery, and personalized medicine are also driving market growth. Favorable regulatory environments in several regions and the growing awareness about the importance of lipid management contribute to market expansion. Increased investments in R&D by pharmaceutical companies for developing novel therapies further fuel market growth.
Challenges in the Fibrate Drugs Industry Sector
The Fibrate Drugs market faces challenges such as stringent regulatory hurdles for drug approvals and increasing generic competition. Supply chain disruptions and fluctuating raw material prices can also impact profitability. The development of new and improved lipid-lowering therapies represents a key challenge for fibrate drug manufacturers. Intense competition from other lipid-lowering drugs, especially statins, creates competitive pressures on market share and pricing. These challenges require strategic planning and innovation to overcome.
Leading Players in the Fibrate Drugs Industry Market
- Aurobindo Pharma USA
- Sanofi
- Cipla Inc
- IOL Chemicals and Pharmaceuticals
- Lupin
- Mylan Inc
- Abbott
- Sun Pharmaceutical Industries Ltd
- Macleods Pharmaceuticals Ltd
- Zydus Cadila
- Socosur Chem
- Unnati Pharmaceuticals Pvt Ltd
Key Developments in Fibrate Drugs Industry Sector
- December 2022: Esperion announced that the landmark Cholesterol lowering via NEXLETOL Bempedoic acid, fibrate drugs, an ACL-inhibiting Regimen outcomes trial, has been accepted as a late-breaking clinical trial at ACC.23/WCC. This development signifies a potential advancement in fibrate-based therapies for cholesterol management.
- October 2022: United Therapeutics Corporation announced top-line data from the EXPEDITE study of Remodulin induction before Orenitram therapy. Co-administration of Orenitram and the CYP2C8 enzyme inhibitor gemfibrozil increased exposure to teprostinil. This finding highlights potential drug interactions and emphasizes the need for careful clinical management when prescribing gemfibrozil alongside other medications.
Strategic Fibrate Drugs Industry Market Outlook
The Fibrate Drugs market holds significant future potential, driven by continued growth in the prevalence of cardiovascular diseases and the development of innovative therapies. Strategic opportunities lie in focusing on personalized medicine approaches, developing combination therapies, and expanding into emerging markets. Companies that invest in R&D and adapt to changing regulatory landscapes will be well-positioned for success in this dynamic market. The increasing demand for cost-effective treatment options presents an opportunity for generic drug manufacturers to expand their market share.
Fibrate Drugs Industry Segmentation
-
1. Drug
- 1.1. Clofibrate
- 1.2. Gemfibrozil
- 1.3. Fenofibrate
- 1.4. Other Drugs
-
2. Product type
- 2.1. Branded
- 2.2. Generic
-
3. Distribution channel
- 3.1. Hospital and Retail Pharmacy
- 3.2. Online pharmacy
Fibrate Drugs Industry Segmentation By Geography
-
1. North America
- 1.1. United States
- 1.2. Canada
- 1.3. Mexico
-
2. Europe
- 2.1. Germany
- 2.2. United Kingdom
- 2.3. France
- 2.4. Italy
- 2.5. Spain
- 2.6. Rest of Europe
-
3. Asia Pacific
- 3.1. China
- 3.2. Japan
- 3.3. India
- 3.4. Australia
- 3.5. South Korea
- 3.6. Rest of Asia Pacific
-
4. Middle East and Africa
- 4.1. GCC
- 4.2. South Africa
- 4.3. Rest of Middle East and Africa
-
5. South America
- 5.1. Brazil
- 5.2. Argentina
- 5.3. Rest of South America
Fibrate Drugs Industry REPORT HIGHLIGHTS
| Aspects | Details |
|---|---|
| Study Period | 2019-2033 |
| Base Year | 2024 |
| Estimated Year | 2025 |
| Forecast Period | 2025-2033 |
| Historical Period | 2019-2024 |
| Growth Rate | CAGR of 5.20% from 2019-2033 |
| Segmentation |
|
Table of Contents
- 1. Introduction
- 1.1. Research Scope
- 1.2. Market Segmentation
- 1.3. Research Methodology
- 1.4. Definitions and Assumptions
- 2. Executive Summary
- 2.1. Introduction
- 3. Market Dynamics
- 3.1. Introduction
- 3.2. Market Drivers
- 3.2.1. Increasing Prevalence of Cardiovascular Diseases Cases; High Investment in the Research and Development of Drugs
- 3.3. Market Restrains
- 3.3.1. Frequent Product Recalls/Discontinuation; Stringent Regulatory Framework
- 3.4. Market Trends
- 3.4.1. Fenofibrate Segment is Expected to Hold Major Market Share Over the Forecast Period
- 4. Market Factor Analysis
- 4.1. Porters Five Forces
- 4.2. Supply/Value Chain
- 4.3. PESTEL analysis
- 4.4. Market Entropy
- 4.5. Patent/Trademark Analysis
- 5. Global Fibrate Drugs Industry Analysis, Insights and Forecast, 2019-2031
- 5.1. Market Analysis, Insights and Forecast - by Drug
- 5.1.1. Clofibrate
- 5.1.2. Gemfibrozil
- 5.1.3. Fenofibrate
- 5.1.4. Other Drugs
- 5.2. Market Analysis, Insights and Forecast - by Product type
- 5.2.1. Branded
- 5.2.2. Generic
- 5.3. Market Analysis, Insights and Forecast - by Distribution channel
- 5.3.1. Hospital and Retail Pharmacy
- 5.3.2. Online pharmacy
- 5.4. Market Analysis, Insights and Forecast - by Region
- 5.4.1. North America
- 5.4.2. Europe
- 5.4.3. Asia Pacific
- 5.4.4. Middle East and Africa
- 5.4.5. South America
- 5.1. Market Analysis, Insights and Forecast - by Drug
- 6. North America Fibrate Drugs Industry Analysis, Insights and Forecast, 2019-2031
- 6.1. Market Analysis, Insights and Forecast - by Drug
- 6.1.1. Clofibrate
- 6.1.2. Gemfibrozil
- 6.1.3. Fenofibrate
- 6.1.4. Other Drugs
- 6.2. Market Analysis, Insights and Forecast - by Product type
- 6.2.1. Branded
- 6.2.2. Generic
- 6.3. Market Analysis, Insights and Forecast - by Distribution channel
- 6.3.1. Hospital and Retail Pharmacy
- 6.3.2. Online pharmacy
- 6.1. Market Analysis, Insights and Forecast - by Drug
- 7. Europe Fibrate Drugs Industry Analysis, Insights and Forecast, 2019-2031
- 7.1. Market Analysis, Insights and Forecast - by Drug
- 7.1.1. Clofibrate
- 7.1.2. Gemfibrozil
- 7.1.3. Fenofibrate
- 7.1.4. Other Drugs
- 7.2. Market Analysis, Insights and Forecast - by Product type
- 7.2.1. Branded
- 7.2.2. Generic
- 7.3. Market Analysis, Insights and Forecast - by Distribution channel
- 7.3.1. Hospital and Retail Pharmacy
- 7.3.2. Online pharmacy
- 7.1. Market Analysis, Insights and Forecast - by Drug
- 8. Asia Pacific Fibrate Drugs Industry Analysis, Insights and Forecast, 2019-2031
- 8.1. Market Analysis, Insights and Forecast - by Drug
- 8.1.1. Clofibrate
- 8.1.2. Gemfibrozil
- 8.1.3. Fenofibrate
- 8.1.4. Other Drugs
- 8.2. Market Analysis, Insights and Forecast - by Product type
- 8.2.1. Branded
- 8.2.2. Generic
- 8.3. Market Analysis, Insights and Forecast - by Distribution channel
- 8.3.1. Hospital and Retail Pharmacy
- 8.3.2. Online pharmacy
- 8.1. Market Analysis, Insights and Forecast - by Drug
- 9. Middle East and Africa Fibrate Drugs Industry Analysis, Insights and Forecast, 2019-2031
- 9.1. Market Analysis, Insights and Forecast - by Drug
- 9.1.1. Clofibrate
- 9.1.2. Gemfibrozil
- 9.1.3. Fenofibrate
- 9.1.4. Other Drugs
- 9.2. Market Analysis, Insights and Forecast - by Product type
- 9.2.1. Branded
- 9.2.2. Generic
- 9.3. Market Analysis, Insights and Forecast - by Distribution channel
- 9.3.1. Hospital and Retail Pharmacy
- 9.3.2. Online pharmacy
- 9.1. Market Analysis, Insights and Forecast - by Drug
- 10. South America Fibrate Drugs Industry Analysis, Insights and Forecast, 2019-2031
- 10.1. Market Analysis, Insights and Forecast - by Drug
- 10.1.1. Clofibrate
- 10.1.2. Gemfibrozil
- 10.1.3. Fenofibrate
- 10.1.4. Other Drugs
- 10.2. Market Analysis, Insights and Forecast - by Product type
- 10.2.1. Branded
- 10.2.2. Generic
- 10.3. Market Analysis, Insights and Forecast - by Distribution channel
- 10.3.1. Hospital and Retail Pharmacy
- 10.3.2. Online pharmacy
- 10.1. Market Analysis, Insights and Forecast - by Drug
- 11. North America Fibrate Drugs Industry Analysis, Insights and Forecast, 2019-2031
- 11.1. Market Analysis, Insights and Forecast - By Country/Sub-region
- 11.1.1. undefined
- 12. Europe Fibrate Drugs Industry Analysis, Insights and Forecast, 2019-2031
- 12.1. Market Analysis, Insights and Forecast - By Country/Sub-region
- 12.1.1. undefined
- 13. Asia Pacific Fibrate Drugs Industry Analysis, Insights and Forecast, 2019-2031
- 13.1. Market Analysis, Insights and Forecast - By Country/Sub-region
- 13.1.1. undefined
- 14. Middle East and Africa Fibrate Drugs Industry Analysis, Insights and Forecast, 2019-2031
- 14.1. Market Analysis, Insights and Forecast - By Country/Sub-region
- 14.1.1. undefined
- 15. South America Fibrate Drugs Industry Analysis, Insights and Forecast, 2019-2031
- 15.1. Market Analysis, Insights and Forecast - By Country/Sub-region
- 15.1.1. undefined
- 16. Competitive Analysis
- 16.1. Global Market Share Analysis 2024
- 16.2. Company Profiles
- 16.2.1 Aurobindo Pharma USA
- 16.2.1.1. Overview
- 16.2.1.2. Products
- 16.2.1.3. SWOT Analysis
- 16.2.1.4. Recent Developments
- 16.2.1.5. Financials (Based on Availability)
- 16.2.2 Sanofi
- 16.2.2.1. Overview
- 16.2.2.2. Products
- 16.2.2.3. SWOT Analysis
- 16.2.2.4. Recent Developments
- 16.2.2.5. Financials (Based on Availability)
- 16.2.3 Cipla Inc
- 16.2.3.1. Overview
- 16.2.3.2. Products
- 16.2.3.3. SWOT Analysis
- 16.2.3.4. Recent Developments
- 16.2.3.5. Financials (Based on Availability)
- 16.2.4 IOL Chemicals and Pharmaceuticals
- 16.2.4.1. Overview
- 16.2.4.2. Products
- 16.2.4.3. SWOT Analysis
- 16.2.4.4. Recent Developments
- 16.2.4.5. Financials (Based on Availability)
- 16.2.5 Lupin
- 16.2.5.1. Overview
- 16.2.5.2. Products
- 16.2.5.3. SWOT Analysis
- 16.2.5.4. Recent Developments
- 16.2.5.5. Financials (Based on Availability)
- 16.2.6 Mylan Inc
- 16.2.6.1. Overview
- 16.2.6.2. Products
- 16.2.6.3. SWOT Analysis
- 16.2.6.4. Recent Developments
- 16.2.6.5. Financials (Based on Availability)
- 16.2.7 Abbott
- 16.2.7.1. Overview
- 16.2.7.2. Products
- 16.2.7.3. SWOT Analysis
- 16.2.7.4. Recent Developments
- 16.2.7.5. Financials (Based on Availability)
- 16.2.8 Sun Pharmaceutical Industries Ltd
- 16.2.8.1. Overview
- 16.2.8.2. Products
- 16.2.8.3. SWOT Analysis
- 16.2.8.4. Recent Developments
- 16.2.8.5. Financials (Based on Availability)
- 16.2.9 Macleods Pharmaceuticals Ltd
- 16.2.9.1. Overview
- 16.2.9.2. Products
- 16.2.9.3. SWOT Analysis
- 16.2.9.4. Recent Developments
- 16.2.9.5. Financials (Based on Availability)
- 16.2.10 Zydus Cadila
- 16.2.10.1. Overview
- 16.2.10.2. Products
- 16.2.10.3. SWOT Analysis
- 16.2.10.4. Recent Developments
- 16.2.10.5. Financials (Based on Availability)
- 16.2.11 Socosur Chem
- 16.2.11.1. Overview
- 16.2.11.2. Products
- 16.2.11.3. SWOT Analysis
- 16.2.11.4. Recent Developments
- 16.2.11.5. Financials (Based on Availability)
- 16.2.12 Unnati Pharmaceuticals Pvt Ltd
- 16.2.12.1. Overview
- 16.2.12.2. Products
- 16.2.12.3. SWOT Analysis
- 16.2.12.4. Recent Developments
- 16.2.12.5. Financials (Based on Availability)
- 16.2.1 Aurobindo Pharma USA
List of Figures
- Figure 1: Global Fibrate Drugs Industry Revenue Breakdown (Million, %) by Region 2024 & 2032
- Figure 2: Global Fibrate Drugs Industry Volume Breakdown (K Unit, %) by Region 2024 & 2032
- Figure 3: North America Fibrate Drugs Industry Revenue (Million), by Country 2024 & 2032
- Figure 4: North America Fibrate Drugs Industry Volume (K Unit), by Country 2024 & 2032
- Figure 5: North America Fibrate Drugs Industry Revenue Share (%), by Country 2024 & 2032
- Figure 6: North America Fibrate Drugs Industry Volume Share (%), by Country 2024 & 2032
- Figure 7: Europe Fibrate Drugs Industry Revenue (Million), by Country 2024 & 2032
- Figure 8: Europe Fibrate Drugs Industry Volume (K Unit), by Country 2024 & 2032
- Figure 9: Europe Fibrate Drugs Industry Revenue Share (%), by Country 2024 & 2032
- Figure 10: Europe Fibrate Drugs Industry Volume Share (%), by Country 2024 & 2032
- Figure 11: Asia Pacific Fibrate Drugs Industry Revenue (Million), by Country 2024 & 2032
- Figure 12: Asia Pacific Fibrate Drugs Industry Volume (K Unit), by Country 2024 & 2032
- Figure 13: Asia Pacific Fibrate Drugs Industry Revenue Share (%), by Country 2024 & 2032
- Figure 14: Asia Pacific Fibrate Drugs Industry Volume Share (%), by Country 2024 & 2032
- Figure 15: Middle East and Africa Fibrate Drugs Industry Revenue (Million), by Country 2024 & 2032
- Figure 16: Middle East and Africa Fibrate Drugs Industry Volume (K Unit), by Country 2024 & 2032
- Figure 17: Middle East and Africa Fibrate Drugs Industry Revenue Share (%), by Country 2024 & 2032
- Figure 18: Middle East and Africa Fibrate Drugs Industry Volume Share (%), by Country 2024 & 2032
- Figure 19: South America Fibrate Drugs Industry Revenue (Million), by Country 2024 & 2032
- Figure 20: South America Fibrate Drugs Industry Volume (K Unit), by Country 2024 & 2032
- Figure 21: South America Fibrate Drugs Industry Revenue Share (%), by Country 2024 & 2032
- Figure 22: South America Fibrate Drugs Industry Volume Share (%), by Country 2024 & 2032
- Figure 23: North America Fibrate Drugs Industry Revenue (Million), by Drug 2024 & 2032
- Figure 24: North America Fibrate Drugs Industry Volume (K Unit), by Drug 2024 & 2032
- Figure 25: North America Fibrate Drugs Industry Revenue Share (%), by Drug 2024 & 2032
- Figure 26: North America Fibrate Drugs Industry Volume Share (%), by Drug 2024 & 2032
- Figure 27: North America Fibrate Drugs Industry Revenue (Million), by Product type 2024 & 2032
- Figure 28: North America Fibrate Drugs Industry Volume (K Unit), by Product type 2024 & 2032
- Figure 29: North America Fibrate Drugs Industry Revenue Share (%), by Product type 2024 & 2032
- Figure 30: North America Fibrate Drugs Industry Volume Share (%), by Product type 2024 & 2032
- Figure 31: North America Fibrate Drugs Industry Revenue (Million), by Distribution channel 2024 & 2032
- Figure 32: North America Fibrate Drugs Industry Volume (K Unit), by Distribution channel 2024 & 2032
- Figure 33: North America Fibrate Drugs Industry Revenue Share (%), by Distribution channel 2024 & 2032
- Figure 34: North America Fibrate Drugs Industry Volume Share (%), by Distribution channel 2024 & 2032
- Figure 35: North America Fibrate Drugs Industry Revenue (Million), by Country 2024 & 2032
- Figure 36: North America Fibrate Drugs Industry Volume (K Unit), by Country 2024 & 2032
- Figure 37: North America Fibrate Drugs Industry Revenue Share (%), by Country 2024 & 2032
- Figure 38: North America Fibrate Drugs Industry Volume Share (%), by Country 2024 & 2032
- Figure 39: Europe Fibrate Drugs Industry Revenue (Million), by Drug 2024 & 2032
- Figure 40: Europe Fibrate Drugs Industry Volume (K Unit), by Drug 2024 & 2032
- Figure 41: Europe Fibrate Drugs Industry Revenue Share (%), by Drug 2024 & 2032
- Figure 42: Europe Fibrate Drugs Industry Volume Share (%), by Drug 2024 & 2032
- Figure 43: Europe Fibrate Drugs Industry Revenue (Million), by Product type 2024 & 2032
- Figure 44: Europe Fibrate Drugs Industry Volume (K Unit), by Product type 2024 & 2032
- Figure 45: Europe Fibrate Drugs Industry Revenue Share (%), by Product type 2024 & 2032
- Figure 46: Europe Fibrate Drugs Industry Volume Share (%), by Product type 2024 & 2032
- Figure 47: Europe Fibrate Drugs Industry Revenue (Million), by Distribution channel 2024 & 2032
- Figure 48: Europe Fibrate Drugs Industry Volume (K Unit), by Distribution channel 2024 & 2032
- Figure 49: Europe Fibrate Drugs Industry Revenue Share (%), by Distribution channel 2024 & 2032
- Figure 50: Europe Fibrate Drugs Industry Volume Share (%), by Distribution channel 2024 & 2032
- Figure 51: Europe Fibrate Drugs Industry Revenue (Million), by Country 2024 & 2032
- Figure 52: Europe Fibrate Drugs Industry Volume (K Unit), by Country 2024 & 2032
- Figure 53: Europe Fibrate Drugs Industry Revenue Share (%), by Country 2024 & 2032
- Figure 54: Europe Fibrate Drugs Industry Volume Share (%), by Country 2024 & 2032
- Figure 55: Asia Pacific Fibrate Drugs Industry Revenue (Million), by Drug 2024 & 2032
- Figure 56: Asia Pacific Fibrate Drugs Industry Volume (K Unit), by Drug 2024 & 2032
- Figure 57: Asia Pacific Fibrate Drugs Industry Revenue Share (%), by Drug 2024 & 2032
- Figure 58: Asia Pacific Fibrate Drugs Industry Volume Share (%), by Drug 2024 & 2032
- Figure 59: Asia Pacific Fibrate Drugs Industry Revenue (Million), by Product type 2024 & 2032
- Figure 60: Asia Pacific Fibrate Drugs Industry Volume (K Unit), by Product type 2024 & 2032
- Figure 61: Asia Pacific Fibrate Drugs Industry Revenue Share (%), by Product type 2024 & 2032
- Figure 62: Asia Pacific Fibrate Drugs Industry Volume Share (%), by Product type 2024 & 2032
- Figure 63: Asia Pacific Fibrate Drugs Industry Revenue (Million), by Distribution channel 2024 & 2032
- Figure 64: Asia Pacific Fibrate Drugs Industry Volume (K Unit), by Distribution channel 2024 & 2032
- Figure 65: Asia Pacific Fibrate Drugs Industry Revenue Share (%), by Distribution channel 2024 & 2032
- Figure 66: Asia Pacific Fibrate Drugs Industry Volume Share (%), by Distribution channel 2024 & 2032
- Figure 67: Asia Pacific Fibrate Drugs Industry Revenue (Million), by Country 2024 & 2032
- Figure 68: Asia Pacific Fibrate Drugs Industry Volume (K Unit), by Country 2024 & 2032
- Figure 69: Asia Pacific Fibrate Drugs Industry Revenue Share (%), by Country 2024 & 2032
- Figure 70: Asia Pacific Fibrate Drugs Industry Volume Share (%), by Country 2024 & 2032
- Figure 71: Middle East and Africa Fibrate Drugs Industry Revenue (Million), by Drug 2024 & 2032
- Figure 72: Middle East and Africa Fibrate Drugs Industry Volume (K Unit), by Drug 2024 & 2032
- Figure 73: Middle East and Africa Fibrate Drugs Industry Revenue Share (%), by Drug 2024 & 2032
- Figure 74: Middle East and Africa Fibrate Drugs Industry Volume Share (%), by Drug 2024 & 2032
- Figure 75: Middle East and Africa Fibrate Drugs Industry Revenue (Million), by Product type 2024 & 2032
- Figure 76: Middle East and Africa Fibrate Drugs Industry Volume (K Unit), by Product type 2024 & 2032
- Figure 77: Middle East and Africa Fibrate Drugs Industry Revenue Share (%), by Product type 2024 & 2032
- Figure 78: Middle East and Africa Fibrate Drugs Industry Volume Share (%), by Product type 2024 & 2032
- Figure 79: Middle East and Africa Fibrate Drugs Industry Revenue (Million), by Distribution channel 2024 & 2032
- Figure 80: Middle East and Africa Fibrate Drugs Industry Volume (K Unit), by Distribution channel 2024 & 2032
- Figure 81: Middle East and Africa Fibrate Drugs Industry Revenue Share (%), by Distribution channel 2024 & 2032
- Figure 82: Middle East and Africa Fibrate Drugs Industry Volume Share (%), by Distribution channel 2024 & 2032
- Figure 83: Middle East and Africa Fibrate Drugs Industry Revenue (Million), by Country 2024 & 2032
- Figure 84: Middle East and Africa Fibrate Drugs Industry Volume (K Unit), by Country 2024 & 2032
- Figure 85: Middle East and Africa Fibrate Drugs Industry Revenue Share (%), by Country 2024 & 2032
- Figure 86: Middle East and Africa Fibrate Drugs Industry Volume Share (%), by Country 2024 & 2032
- Figure 87: South America Fibrate Drugs Industry Revenue (Million), by Drug 2024 & 2032
- Figure 88: South America Fibrate Drugs Industry Volume (K Unit), by Drug 2024 & 2032
- Figure 89: South America Fibrate Drugs Industry Revenue Share (%), by Drug 2024 & 2032
- Figure 90: South America Fibrate Drugs Industry Volume Share (%), by Drug 2024 & 2032
- Figure 91: South America Fibrate Drugs Industry Revenue (Million), by Product type 2024 & 2032
- Figure 92: South America Fibrate Drugs Industry Volume (K Unit), by Product type 2024 & 2032
- Figure 93: South America Fibrate Drugs Industry Revenue Share (%), by Product type 2024 & 2032
- Figure 94: South America Fibrate Drugs Industry Volume Share (%), by Product type 2024 & 2032
- Figure 95: South America Fibrate Drugs Industry Revenue (Million), by Distribution channel 2024 & 2032
- Figure 96: South America Fibrate Drugs Industry Volume (K Unit), by Distribution channel 2024 & 2032
- Figure 97: South America Fibrate Drugs Industry Revenue Share (%), by Distribution channel 2024 & 2032
- Figure 98: South America Fibrate Drugs Industry Volume Share (%), by Distribution channel 2024 & 2032
- Figure 99: South America Fibrate Drugs Industry Revenue (Million), by Country 2024 & 2032
- Figure 100: South America Fibrate Drugs Industry Volume (K Unit), by Country 2024 & 2032
- Figure 101: South America Fibrate Drugs Industry Revenue Share (%), by Country 2024 & 2032
- Figure 102: South America Fibrate Drugs Industry Volume Share (%), by Country 2024 & 2032
List of Tables
- Table 1: Global Fibrate Drugs Industry Revenue Million Forecast, by Region 2019 & 2032
- Table 2: Global Fibrate Drugs Industry Volume K Unit Forecast, by Region 2019 & 2032
- Table 3: Global Fibrate Drugs Industry Revenue Million Forecast, by Drug 2019 & 2032
- Table 4: Global Fibrate Drugs Industry Volume K Unit Forecast, by Drug 2019 & 2032
- Table 5: Global Fibrate Drugs Industry Revenue Million Forecast, by Product type 2019 & 2032
- Table 6: Global Fibrate Drugs Industry Volume K Unit Forecast, by Product type 2019 & 2032
- Table 7: Global Fibrate Drugs Industry Revenue Million Forecast, by Distribution channel 2019 & 2032
- Table 8: Global Fibrate Drugs Industry Volume K Unit Forecast, by Distribution channel 2019 & 2032
- Table 9: Global Fibrate Drugs Industry Revenue Million Forecast, by Region 2019 & 2032
- Table 10: Global Fibrate Drugs Industry Volume K Unit Forecast, by Region 2019 & 2032
- Table 11: Global Fibrate Drugs Industry Revenue Million Forecast, by Country 2019 & 2032
- Table 12: Global Fibrate Drugs Industry Volume K Unit Forecast, by Country 2019 & 2032
- Table 13: Global Fibrate Drugs Industry Revenue Million Forecast, by Country 2019 & 2032
- Table 14: Global Fibrate Drugs Industry Volume K Unit Forecast, by Country 2019 & 2032
- Table 15: Global Fibrate Drugs Industry Revenue Million Forecast, by Country 2019 & 2032
- Table 16: Global Fibrate Drugs Industry Volume K Unit Forecast, by Country 2019 & 2032
- Table 17: Global Fibrate Drugs Industry Revenue Million Forecast, by Country 2019 & 2032
- Table 18: Global Fibrate Drugs Industry Volume K Unit Forecast, by Country 2019 & 2032
- Table 19: Global Fibrate Drugs Industry Revenue Million Forecast, by Country 2019 & 2032
- Table 20: Global Fibrate Drugs Industry Volume K Unit Forecast, by Country 2019 & 2032
- Table 21: Global Fibrate Drugs Industry Revenue Million Forecast, by Drug 2019 & 2032
- Table 22: Global Fibrate Drugs Industry Volume K Unit Forecast, by Drug 2019 & 2032
- Table 23: Global Fibrate Drugs Industry Revenue Million Forecast, by Product type 2019 & 2032
- Table 24: Global Fibrate Drugs Industry Volume K Unit Forecast, by Product type 2019 & 2032
- Table 25: Global Fibrate Drugs Industry Revenue Million Forecast, by Distribution channel 2019 & 2032
- Table 26: Global Fibrate Drugs Industry Volume K Unit Forecast, by Distribution channel 2019 & 2032
- Table 27: Global Fibrate Drugs Industry Revenue Million Forecast, by Country 2019 & 2032
- Table 28: Global Fibrate Drugs Industry Volume K Unit Forecast, by Country 2019 & 2032
- Table 29: United States Fibrate Drugs Industry Revenue (Million) Forecast, by Application 2019 & 2032
- Table 30: United States Fibrate Drugs Industry Volume (K Unit) Forecast, by Application 2019 & 2032
- Table 31: Canada Fibrate Drugs Industry Revenue (Million) Forecast, by Application 2019 & 2032
- Table 32: Canada Fibrate Drugs Industry Volume (K Unit) Forecast, by Application 2019 & 2032
- Table 33: Mexico Fibrate Drugs Industry Revenue (Million) Forecast, by Application 2019 & 2032
- Table 34: Mexico Fibrate Drugs Industry Volume (K Unit) Forecast, by Application 2019 & 2032
- Table 35: Global Fibrate Drugs Industry Revenue Million Forecast, by Drug 2019 & 2032
- Table 36: Global Fibrate Drugs Industry Volume K Unit Forecast, by Drug 2019 & 2032
- Table 37: Global Fibrate Drugs Industry Revenue Million Forecast, by Product type 2019 & 2032
- Table 38: Global Fibrate Drugs Industry Volume K Unit Forecast, by Product type 2019 & 2032
- Table 39: Global Fibrate Drugs Industry Revenue Million Forecast, by Distribution channel 2019 & 2032
- Table 40: Global Fibrate Drugs Industry Volume K Unit Forecast, by Distribution channel 2019 & 2032
- Table 41: Global Fibrate Drugs Industry Revenue Million Forecast, by Country 2019 & 2032
- Table 42: Global Fibrate Drugs Industry Volume K Unit Forecast, by Country 2019 & 2032
- Table 43: Germany Fibrate Drugs Industry Revenue (Million) Forecast, by Application 2019 & 2032
- Table 44: Germany Fibrate Drugs Industry Volume (K Unit) Forecast, by Application 2019 & 2032
- Table 45: United Kingdom Fibrate Drugs Industry Revenue (Million) Forecast, by Application 2019 & 2032
- Table 46: United Kingdom Fibrate Drugs Industry Volume (K Unit) Forecast, by Application 2019 & 2032
- Table 47: France Fibrate Drugs Industry Revenue (Million) Forecast, by Application 2019 & 2032
- Table 48: France Fibrate Drugs Industry Volume (K Unit) Forecast, by Application 2019 & 2032
- Table 49: Italy Fibrate Drugs Industry Revenue (Million) Forecast, by Application 2019 & 2032
- Table 50: Italy Fibrate Drugs Industry Volume (K Unit) Forecast, by Application 2019 & 2032
- Table 51: Spain Fibrate Drugs Industry Revenue (Million) Forecast, by Application 2019 & 2032
- Table 52: Spain Fibrate Drugs Industry Volume (K Unit) Forecast, by Application 2019 & 2032
- Table 53: Rest of Europe Fibrate Drugs Industry Revenue (Million) Forecast, by Application 2019 & 2032
- Table 54: Rest of Europe Fibrate Drugs Industry Volume (K Unit) Forecast, by Application 2019 & 2032
- Table 55: Global Fibrate Drugs Industry Revenue Million Forecast, by Drug 2019 & 2032
- Table 56: Global Fibrate Drugs Industry Volume K Unit Forecast, by Drug 2019 & 2032
- Table 57: Global Fibrate Drugs Industry Revenue Million Forecast, by Product type 2019 & 2032
- Table 58: Global Fibrate Drugs Industry Volume K Unit Forecast, by Product type 2019 & 2032
- Table 59: Global Fibrate Drugs Industry Revenue Million Forecast, by Distribution channel 2019 & 2032
- Table 60: Global Fibrate Drugs Industry Volume K Unit Forecast, by Distribution channel 2019 & 2032
- Table 61: Global Fibrate Drugs Industry Revenue Million Forecast, by Country 2019 & 2032
- Table 62: Global Fibrate Drugs Industry Volume K Unit Forecast, by Country 2019 & 2032
- Table 63: China Fibrate Drugs Industry Revenue (Million) Forecast, by Application 2019 & 2032
- Table 64: China Fibrate Drugs Industry Volume (K Unit) Forecast, by Application 2019 & 2032
- Table 65: Japan Fibrate Drugs Industry Revenue (Million) Forecast, by Application 2019 & 2032
- Table 66: Japan Fibrate Drugs Industry Volume (K Unit) Forecast, by Application 2019 & 2032
- Table 67: India Fibrate Drugs Industry Revenue (Million) Forecast, by Application 2019 & 2032
- Table 68: India Fibrate Drugs Industry Volume (K Unit) Forecast, by Application 2019 & 2032
- Table 69: Australia Fibrate Drugs Industry Revenue (Million) Forecast, by Application 2019 & 2032
- Table 70: Australia Fibrate Drugs Industry Volume (K Unit) Forecast, by Application 2019 & 2032
- Table 71: South Korea Fibrate Drugs Industry Revenue (Million) Forecast, by Application 2019 & 2032
- Table 72: South Korea Fibrate Drugs Industry Volume (K Unit) Forecast, by Application 2019 & 2032
- Table 73: Rest of Asia Pacific Fibrate Drugs Industry Revenue (Million) Forecast, by Application 2019 & 2032
- Table 74: Rest of Asia Pacific Fibrate Drugs Industry Volume (K Unit) Forecast, by Application 2019 & 2032
- Table 75: Global Fibrate Drugs Industry Revenue Million Forecast, by Drug 2019 & 2032
- Table 76: Global Fibrate Drugs Industry Volume K Unit Forecast, by Drug 2019 & 2032
- Table 77: Global Fibrate Drugs Industry Revenue Million Forecast, by Product type 2019 & 2032
- Table 78: Global Fibrate Drugs Industry Volume K Unit Forecast, by Product type 2019 & 2032
- Table 79: Global Fibrate Drugs Industry Revenue Million Forecast, by Distribution channel 2019 & 2032
- Table 80: Global Fibrate Drugs Industry Volume K Unit Forecast, by Distribution channel 2019 & 2032
- Table 81: Global Fibrate Drugs Industry Revenue Million Forecast, by Country 2019 & 2032
- Table 82: Global Fibrate Drugs Industry Volume K Unit Forecast, by Country 2019 & 2032
- Table 83: GCC Fibrate Drugs Industry Revenue (Million) Forecast, by Application 2019 & 2032
- Table 84: GCC Fibrate Drugs Industry Volume (K Unit) Forecast, by Application 2019 & 2032
- Table 85: South Africa Fibrate Drugs Industry Revenue (Million) Forecast, by Application 2019 & 2032
- Table 86: South Africa Fibrate Drugs Industry Volume (K Unit) Forecast, by Application 2019 & 2032
- Table 87: Rest of Middle East and Africa Fibrate Drugs Industry Revenue (Million) Forecast, by Application 2019 & 2032
- Table 88: Rest of Middle East and Africa Fibrate Drugs Industry Volume (K Unit) Forecast, by Application 2019 & 2032
- Table 89: Global Fibrate Drugs Industry Revenue Million Forecast, by Drug 2019 & 2032
- Table 90: Global Fibrate Drugs Industry Volume K Unit Forecast, by Drug 2019 & 2032
- Table 91: Global Fibrate Drugs Industry Revenue Million Forecast, by Product type 2019 & 2032
- Table 92: Global Fibrate Drugs Industry Volume K Unit Forecast, by Product type 2019 & 2032
- Table 93: Global Fibrate Drugs Industry Revenue Million Forecast, by Distribution channel 2019 & 2032
- Table 94: Global Fibrate Drugs Industry Volume K Unit Forecast, by Distribution channel 2019 & 2032
- Table 95: Global Fibrate Drugs Industry Revenue Million Forecast, by Country 2019 & 2032
- Table 96: Global Fibrate Drugs Industry Volume K Unit Forecast, by Country 2019 & 2032
- Table 97: Brazil Fibrate Drugs Industry Revenue (Million) Forecast, by Application 2019 & 2032
- Table 98: Brazil Fibrate Drugs Industry Volume (K Unit) Forecast, by Application 2019 & 2032
- Table 99: Argentina Fibrate Drugs Industry Revenue (Million) Forecast, by Application 2019 & 2032
- Table 100: Argentina Fibrate Drugs Industry Volume (K Unit) Forecast, by Application 2019 & 2032
- Table 101: Rest of South America Fibrate Drugs Industry Revenue (Million) Forecast, by Application 2019 & 2032
- Table 102: Rest of South America Fibrate Drugs Industry Volume (K Unit) Forecast, by Application 2019 & 2032
Frequently Asked Questions
1. What is the projected Compound Annual Growth Rate (CAGR) of the Fibrate Drugs Industry?
The projected CAGR is approximately 5.20%.
2. Which companies are prominent players in the Fibrate Drugs Industry?
Key companies in the market include Aurobindo Pharma USA, Sanofi, Cipla Inc, IOL Chemicals and Pharmaceuticals, Lupin, Mylan Inc, Abbott, Sun Pharmaceutical Industries Ltd, Macleods Pharmaceuticals Ltd, Zydus Cadila, Socosur Chem, Unnati Pharmaceuticals Pvt Ltd.
3. What are the main segments of the Fibrate Drugs Industry?
The market segments include Drug, Product type, Distribution channel.
4. Can you provide details about the market size?
The market size is estimated to be USD XX Million as of 2022.
5. What are some drivers contributing to market growth?
Increasing Prevalence of Cardiovascular Diseases Cases; High Investment in the Research and Development of Drugs.
6. What are the notable trends driving market growth?
Fenofibrate Segment is Expected to Hold Major Market Share Over the Forecast Period.
7. Are there any restraints impacting market growth?
Frequent Product Recalls/Discontinuation; Stringent Regulatory Framework.
8. Can you provide examples of recent developments in the market?
In December 2022, Esperion announced that the landmark Cholesterol lowering via NEXLETOL Bempedoic acid, fibrate drugs, an ACL-inhibiting Regimen outcomes trial, has been accepted as a late-breaking clinical trial at ACC.23/WCC.
9. What pricing options are available for accessing the report?
Pricing options include single-user, multi-user, and enterprise licenses priced at USD 4750, USD 5250, and USD 8750 respectively.
10. Is the market size provided in terms of value or volume?
The market size is provided in terms of value, measured in Million and volume, measured in K Unit.
11. Are there any specific market keywords associated with the report?
Yes, the market keyword associated with the report is "Fibrate Drugs Industry," which aids in identifying and referencing the specific market segment covered.
12. How do I determine which pricing option suits my needs best?
The pricing options vary based on user requirements and access needs. Individual users may opt for single-user licenses, while businesses requiring broader access may choose multi-user or enterprise licenses for cost-effective access to the report.
13. Are there any additional resources or data provided in the Fibrate Drugs Industry report?
While the report offers comprehensive insights, it's advisable to review the specific contents or supplementary materials provided to ascertain if additional resources or data are available.
14. How can I stay updated on further developments or reports in the Fibrate Drugs Industry?
To stay informed about further developments, trends, and reports in the Fibrate Drugs Industry, consider subscribing to industry newsletters, following relevant companies and organizations, or regularly checking reputable industry news sources and publications.
Methodology
Step 1 - Identification of Relevant Samples Size from Population Database


Step 2 - Approaches for Defining Global Market Size (Value, Volume* & Price*)

Note*: In applicable scenarios
Step 3 - Data Sources
Primary Research
- Web Analytics
- Survey Reports
- Research Institute
- Latest Research Reports
- Opinion Leaders
Secondary Research
- Annual Reports
- White Paper
- Latest Press Release
- Industry Association
- Paid Database
- Investor Presentations

Step 4 - Data Triangulation
Involves using different sources of information in order to increase the validity of a study
These sources are likely to be stakeholders in a program - participants, other researchers, program staff, other community members, and so on.
Then we put all data in single framework & apply various statistical tools to find out the dynamic on the market.
During the analysis stage, feedback from the stakeholder groups would be compared to determine areas of agreement as well as areas of divergence


