
Key Insights
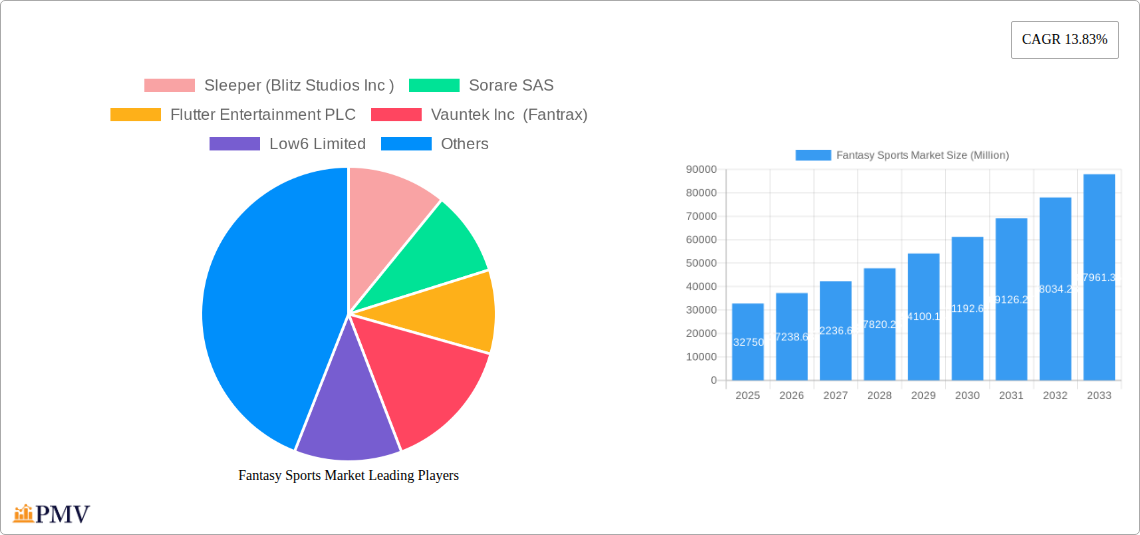
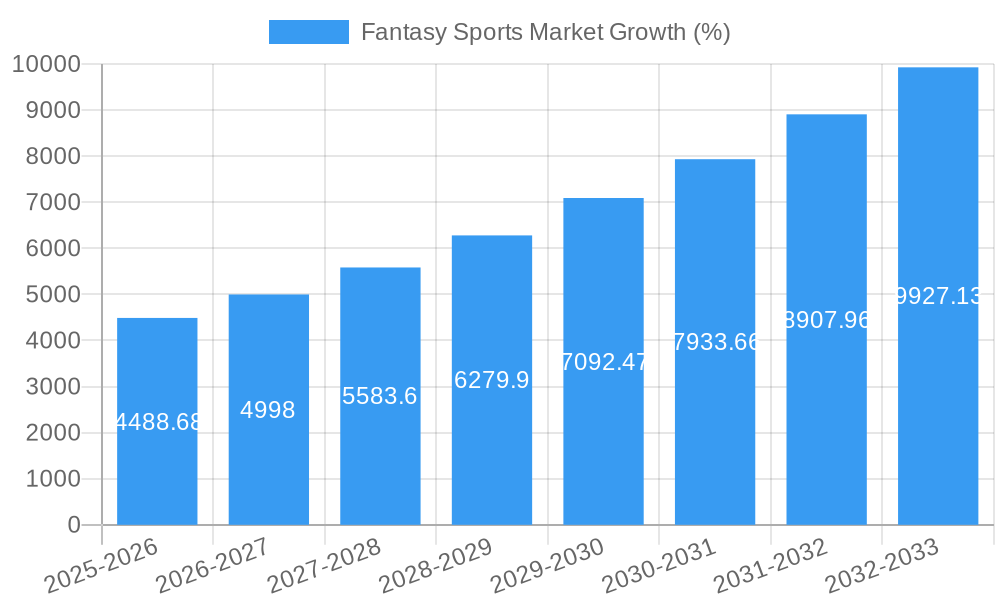
The global fantasy sports market is experiencing robust growth, projected to reach a market size of $32.75 billion in 2025, exhibiting a Compound Annual Growth Rate (CAGR) of 13.83%. This expansion is driven by several key factors. Increasing smartphone penetration and readily available high-speed internet access have broadened the reach of fantasy sports platforms, making them easily accessible to a wider demographic. Furthermore, the rise in popularity of esports and the integration of fantasy elements within traditional sports leagues are contributing to the market's growth. The engagement of younger audiences, particularly those under 25, fuels this expansion, with the mobile application platform proving to be particularly impactful. The diverse range of sports covered, including football, baseball, cricket, basketball, and car racing, caters to a global audience with varying sporting interests. Competition is fierce among established players like DraftKings, FanDuel, and Sleeper, alongside emerging companies vying for market share, leading to continuous innovation in game mechanics and user experience. The market is segmented by application (individual vs. team competition), sport type, platform (website vs. mobile app), and demographics, allowing for targeted marketing strategies and platform optimization.
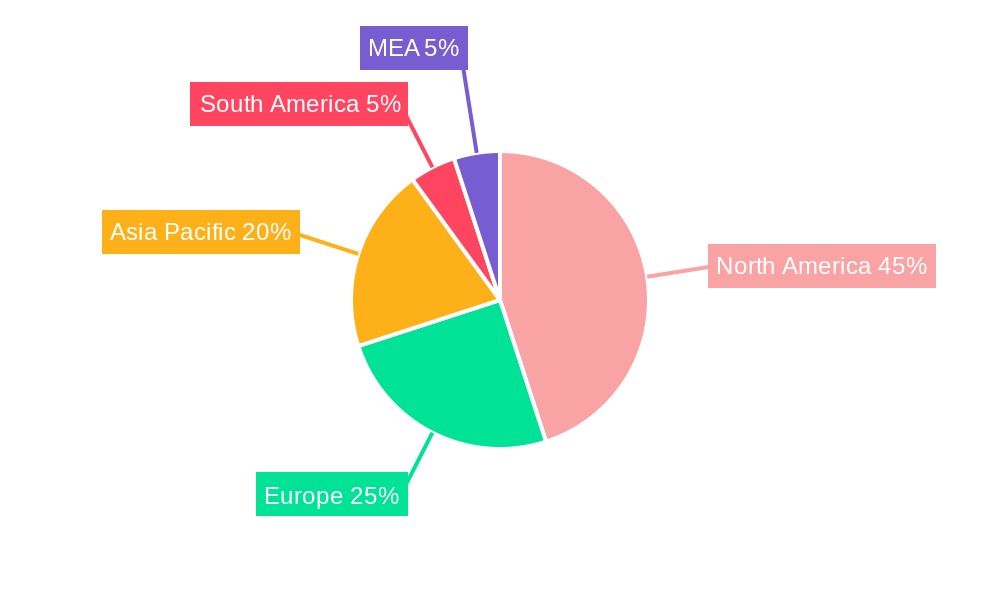
Geographic distribution reveals a significant concentration of the market in North America, fueled by the established presence of major fantasy sports platforms and a strong sporting culture. However, significant growth potential exists in Asia-Pacific regions like India and Southeast Asia, given the burgeoning popularity of mobile gaming and a passionate fan base for various sports. While regulatory hurdles and concerns regarding responsible gaming remain potential restraints, the industry is proactively addressing these concerns through improved user controls and responsible gambling initiatives. This proactive approach, combined with the inherent entertainment value and social interaction offered by fantasy sports, positions the market for sustained growth in the coming years. The forecast period of 2025-2033 promises further expansion as technological advancements and evolving consumer preferences continue to shape the industry's trajectory.
This in-depth report provides a comprehensive analysis of the Fantasy Sports Market, encompassing historical data (2019-2024), the base year (2025), and a forecast period (2025-2033). The report delves into market structure, competitive dynamics, industry trends, key segments, and future growth potential, offering valuable insights for industry stakeholders. The market is projected to reach xx Million by 2033, demonstrating significant growth opportunities.
Fantasy Sports Market Market Structure & Competitive Dynamics
The Fantasy Sports Market exhibits a moderately concentrated structure, with several major players holding significant market share. However, the presence of numerous smaller players and startups indicates a dynamic competitive landscape. Innovation within the fantasy sports ecosystem is driven by technological advancements, particularly in mobile app development, data analytics, and gamification. Regulatory frameworks vary significantly across geographies, impacting market access and operational strategies. The market sees constant evolution of product substitutes, such as eSports and traditional sports betting, increasing competition. End-user trends, notably the increasing mobile penetration and the preference for personalized experiences, are shaping market growth.
Mergers and acquisitions (M&A) activity is prevalent, reflecting consolidation and expansion strategies within the sector. For example, the Fantasy Akhada deal in January 2023, valued at USD 160-175 Million, illustrates significant investment interest.
- Market Concentration: Moderately concentrated, with several dominant players.
- Innovation Ecosystems: Focus on mobile app development, data analytics, and gamification.
- Regulatory Frameworks: Vary widely by region, affecting market access.
- Product Substitutes: eSports, traditional sports betting, posing competitive threats.
- End-User Trends: Increased mobile usage and demand for personalized experiences.
- M&A Activity: Significant M&A activity, with deal values in the hundreds of Millions.
Fantasy Sports Market Industry Trends & Insights
The Fantasy Sports Market is experiencing robust growth, driven by factors such as increasing smartphone penetration, growing interest in sports, and the rise of daily fantasy sports. Technological advancements in mobile app development, AI-powered predictive analytics, and immersive gaming experiences further fuel this growth. Consumer preferences are shifting towards more engaging and interactive fantasy platforms, with personalized features and social interaction becoming increasingly important.
The market's competitive dynamics are characterized by intense rivalry among established players and the emergence of innovative startups. Competition focuses on user acquisition, product differentiation, and technological innovation. The Compound Annual Growth Rate (CAGR) during the forecast period is estimated at xx%, indicating substantial market expansion. Market penetration, particularly in emerging markets, is expected to increase significantly.
Dominant Markets & Segments in Fantasy Sports Market
The North American market currently holds the largest share of the Fantasy Sports Market, driven by strong consumer interest and established industry players. However, significant growth potential exists in emerging markets across Asia and Europe.
By Application:
- Individual Competition: This segment dominates, fueled by the ease of access and individual participation.
- Team Competition: Shows strong growth potential, attracting larger audiences and higher engagement.
By Type:
- Football: Remains the most popular fantasy sport globally, with a massive and devoted following.
- Baseball, Basketball, Cricket: These sports also contribute significantly to the market.
- Car Racing, Others: Show niche appeal and steady growth.
By Platform:
- Mobile Application: Dominates, with convenient accessibility and user-friendly interfaces.
- Website: Retains a significant share, catering to a diverse user base.
By Demographics:
- Between 25 and 40 Years: This age group represents the core user base.
- Under 25 Years: Shows substantial growth potential with increasing digital engagement.
- Above 40 Years: While a smaller segment, it demonstrates consistent participation.
Key drivers for regional dominance include factors like strong sporting culture, high internet/smartphone penetration, favorable regulatory environments, and robust economic conditions.
Fantasy Sports Market Product Innovations
Recent innovations in fantasy sports include the integration of AI for enhanced prediction capabilities, the development of more engaging user interfaces, and the introduction of innovative game formats that focus on real-time engagement and interactive gameplay. These innovations aim to improve user experience, increase engagement, and drive higher monetization. The market sees a move toward personalized experiences, social features, and unique game mechanics.
Report Segmentation & Scope
The report segments the Fantasy Sports Market by application (individual vs. team competition), sport type (football, baseball, cricket, basketball, car racing, others), platform (website vs. mobile application), and demographics (under 25, 25-40, above 40). Each segment includes growth projections, market size estimations (in Millions), and an analysis of competitive dynamics. The report provides detailed insights into market trends, growth drivers, and challenges for each segment, presenting a comprehensive understanding of the market landscape.
Key Drivers of Fantasy Sports Market Growth
Several factors drive the growth of the Fantasy Sports Market. Technological advancements in mobile apps, data analytics, and gamification enhance user engagement and experience. The rising popularity of sports and a large user base, particularly among younger demographics, fuels market expansion. Favorable regulatory environments in several regions also contribute to market growth. Examples include DraftKings' expansion into new markets.
Challenges in the Fantasy Sports Market Sector
The Fantasy Sports Market faces challenges, including regulatory hurdles in some jurisdictions, concerns regarding responsible gaming, and intense competition among numerous players. Supply chain disruptions and the need for continuous product innovation to stay ahead of the competition also pose considerable challenges. The fluctuating economic conditions can also impact user spending and market growth. Addressing these challenges will be crucial for sustained market growth.
Leading Players in the Fantasy Sports Market Market
- Sleeper (Blitz Studios Inc)
- Sorare SAS
- Flutter Entertainment PLC
- Vauntek Inc (Fantrax)
- Low6 Limited
- FanDuel Group
- NFL Enterprises LLC
- ESPN Sports Media Ltd
- RealTime Fantasy Sports Inc
- CBS Sports Digital
- Bovada
- DraftKings Inc
- Dream Sports Group
- Yahoo Fantasy Sports LLC
Key Developments in Fantasy Sports Market Sector
- March 2023: DraftKings Inc. announced plans to launch its online sportsbook in Massachusetts, expanding its market reach.
- January 2023: Fantasy Akhada secured a significant investment from GMR Sports, indicating investor confidence in the fantasy gaming sector.
- May 2022: FSport partnered with TV4 in Sweden, showcasing the growing integration of fantasy sports with traditional media.
Strategic Fantasy Sports Market Market Outlook
The future of the Fantasy Sports Market looks promising, with continued growth driven by technological innovation, expanding user bases, and increasing market penetration in emerging regions. Strategic opportunities exist for companies to focus on personalized user experiences, integrate advanced data analytics, and develop innovative game formats to enhance engagement and monetization. The market's future success will depend on adapting to evolving consumer preferences, navigating regulatory landscapes, and maintaining a competitive edge through continuous innovation.
Fantasy Sports Market Segmentation
-
1. Type
- 1.1. Football
- 1.2. Baseball
- 1.3. Cricket
- 1.4. Basketball
- 1.5. Car Racing
- 1.6. Other Types
-
2. Platform
- 2.1. Website
- 2.2. Mobile Application
-
3. Demographics
- 3.1. Under 25 Years
- 3.2. Between 25 and 40 Years
- 3.3. Above 40 Years
-
4. Application
- 4.1. Individual Competition
- 4.2. Team Competition
Fantasy Sports Market Segmentation By Geography
- 1. North America
- 2. Europe
- 3. Asia
- 4. Australia and New Zealand
- 5. Latin America
- 6. Middle East and Africa
Fantasy Sports Market REPORT HIGHLIGHTS
| Aspects | Details |
|---|---|
| Study Period | 2019-2033 |
| Base Year | 2024 |
| Estimated Year | 2025 |
| Forecast Period | 2025-2033 |
| Historical Period | 2019-2024 |
| Growth Rate | CAGR of 13.83% from 2019-2033 |
| Segmentation |
|
Table of Contents
- 1. Introduction
- 1.1. Research Scope
- 1.2. Market Segmentation
- 1.3. Research Methodology
- 1.4. Definitions and Assumptions
- 2. Executive Summary
- 2.1. Introduction
- 3. Market Dynamics
- 3.1. Introduction
- 3.2. Market Drivers
- 3.2.1. Increasing Sports Fan Engagement; Technological Advancements might Drive the Market Growth
- 3.3. Market Restrains
- 3.3.1. Low Awareness and Regulatory Framework; Competition from Traditional Sports Betting
- 3.4. Market Trends
- 3.4.1. Increasing Sports Fan Engagement may Drive the Market Growth
- 4. Market Factor Analysis
- 4.1. Porters Five Forces
- 4.2. Supply/Value Chain
- 4.3. PESTEL analysis
- 4.4. Market Entropy
- 4.5. Patent/Trademark Analysis
- 5. Global Fantasy Sports Market Analysis, Insights and Forecast, 2019-2031
- 5.1. Market Analysis, Insights and Forecast - by Type
- 5.1.1. Football
- 5.1.2. Baseball
- 5.1.3. Cricket
- 5.1.4. Basketball
- 5.1.5. Car Racing
- 5.1.6. Other Types
- 5.2. Market Analysis, Insights and Forecast - by Platform
- 5.2.1. Website
- 5.2.2. Mobile Application
- 5.3. Market Analysis, Insights and Forecast - by Demographics
- 5.3.1. Under 25 Years
- 5.3.2. Between 25 and 40 Years
- 5.3.3. Above 40 Years
- 5.4. Market Analysis, Insights and Forecast - by Application
- 5.4.1. Individual Competition
- 5.4.2. Team Competition
- 5.5. Market Analysis, Insights and Forecast - by Region
- 5.5.1. North America
- 5.5.2. Europe
- 5.5.3. Asia
- 5.5.4. Australia and New Zealand
- 5.5.5. Latin America
- 5.5.6. Middle East and Africa
- 5.1. Market Analysis, Insights and Forecast - by Type
- 6. North America Fantasy Sports Market Analysis, Insights and Forecast, 2019-2031
- 6.1. Market Analysis, Insights and Forecast - by Type
- 6.1.1. Football
- 6.1.2. Baseball
- 6.1.3. Cricket
- 6.1.4. Basketball
- 6.1.5. Car Racing
- 6.1.6. Other Types
- 6.2. Market Analysis, Insights and Forecast - by Platform
- 6.2.1. Website
- 6.2.2. Mobile Application
- 6.3. Market Analysis, Insights and Forecast - by Demographics
- 6.3.1. Under 25 Years
- 6.3.2. Between 25 and 40 Years
- 6.3.3. Above 40 Years
- 6.4. Market Analysis, Insights and Forecast - by Application
- 6.4.1. Individual Competition
- 6.4.2. Team Competition
- 6.1. Market Analysis, Insights and Forecast - by Type
- 7. Europe Fantasy Sports Market Analysis, Insights and Forecast, 2019-2031
- 7.1. Market Analysis, Insights and Forecast - by Type
- 7.1.1. Football
- 7.1.2. Baseball
- 7.1.3. Cricket
- 7.1.4. Basketball
- 7.1.5. Car Racing
- 7.1.6. Other Types
- 7.2. Market Analysis, Insights and Forecast - by Platform
- 7.2.1. Website
- 7.2.2. Mobile Application
- 7.3. Market Analysis, Insights and Forecast - by Demographics
- 7.3.1. Under 25 Years
- 7.3.2. Between 25 and 40 Years
- 7.3.3. Above 40 Years
- 7.4. Market Analysis, Insights and Forecast - by Application
- 7.4.1. Individual Competition
- 7.4.2. Team Competition
- 7.1. Market Analysis, Insights and Forecast - by Type
- 8. Asia Fantasy Sports Market Analysis, Insights and Forecast, 2019-2031
- 8.1. Market Analysis, Insights and Forecast - by Type
- 8.1.1. Football
- 8.1.2. Baseball
- 8.1.3. Cricket
- 8.1.4. Basketball
- 8.1.5. Car Racing
- 8.1.6. Other Types
- 8.2. Market Analysis, Insights and Forecast - by Platform
- 8.2.1. Website
- 8.2.2. Mobile Application
- 8.3. Market Analysis, Insights and Forecast - by Demographics
- 8.3.1. Under 25 Years
- 8.3.2. Between 25 and 40 Years
- 8.3.3. Above 40 Years
- 8.4. Market Analysis, Insights and Forecast - by Application
- 8.4.1. Individual Competition
- 8.4.2. Team Competition
- 8.1. Market Analysis, Insights and Forecast - by Type
- 9. Australia and New Zealand Fantasy Sports Market Analysis, Insights and Forecast, 2019-2031
- 9.1. Market Analysis, Insights and Forecast - by Type
- 9.1.1. Football
- 9.1.2. Baseball
- 9.1.3. Cricket
- 9.1.4. Basketball
- 9.1.5. Car Racing
- 9.1.6. Other Types
- 9.2. Market Analysis, Insights and Forecast - by Platform
- 9.2.1. Website
- 9.2.2. Mobile Application
- 9.3. Market Analysis, Insights and Forecast - by Demographics
- 9.3.1. Under 25 Years
- 9.3.2. Between 25 and 40 Years
- 9.3.3. Above 40 Years
- 9.4. Market Analysis, Insights and Forecast - by Application
- 9.4.1. Individual Competition
- 9.4.2. Team Competition
- 9.1. Market Analysis, Insights and Forecast - by Type
- 10. Latin America Fantasy Sports Market Analysis, Insights and Forecast, 2019-2031
- 10.1. Market Analysis, Insights and Forecast - by Type
- 10.1.1. Football
- 10.1.2. Baseball
- 10.1.3. Cricket
- 10.1.4. Basketball
- 10.1.5. Car Racing
- 10.1.6. Other Types
- 10.2. Market Analysis, Insights and Forecast - by Platform
- 10.2.1. Website
- 10.2.2. Mobile Application
- 10.3. Market Analysis, Insights and Forecast - by Demographics
- 10.3.1. Under 25 Years
- 10.3.2. Between 25 and 40 Years
- 10.3.3. Above 40 Years
- 10.4. Market Analysis, Insights and Forecast - by Application
- 10.4.1. Individual Competition
- 10.4.2. Team Competition
- 10.1. Market Analysis, Insights and Forecast - by Type
- 11. Middle East and Africa Fantasy Sports Market Analysis, Insights and Forecast, 2019-2031
- 11.1. Market Analysis, Insights and Forecast - by Type
- 11.1.1. Football
- 11.1.2. Baseball
- 11.1.3. Cricket
- 11.1.4. Basketball
- 11.1.5. Car Racing
- 11.1.6. Other Types
- 11.2. Market Analysis, Insights and Forecast - by Platform
- 11.2.1. Website
- 11.2.2. Mobile Application
- 11.3. Market Analysis, Insights and Forecast - by Demographics
- 11.3.1. Under 25 Years
- 11.3.2. Between 25 and 40 Years
- 11.3.3. Above 40 Years
- 11.4. Market Analysis, Insights and Forecast - by Application
- 11.4.1. Individual Competition
- 11.4.2. Team Competition
- 11.1. Market Analysis, Insights and Forecast - by Type
- 12. North America Fantasy Sports Market Analysis, Insights and Forecast, 2019-2031
- 12.1. Market Analysis, Insights and Forecast - By Country/Sub-region
- 12.1.1 United States
- 12.1.2 Canada
- 12.1.3 Mexico
- 13. Europe Fantasy Sports Market Analysis, Insights and Forecast, 2019-2031
- 13.1. Market Analysis, Insights and Forecast - By Country/Sub-region
- 13.1.1 Germany
- 13.1.2 United Kingdom
- 13.1.3 France
- 13.1.4 Spain
- 13.1.5 Italy
- 13.1.6 Spain
- 13.1.7 Belgium
- 13.1.8 Netherland
- 13.1.9 Nordics
- 13.1.10 Rest of Europe
- 14. Asia Pacific Fantasy Sports Market Analysis, Insights and Forecast, 2019-2031
- 14.1. Market Analysis, Insights and Forecast - By Country/Sub-region
- 14.1.1 China
- 14.1.2 Japan
- 14.1.3 India
- 14.1.4 South Korea
- 14.1.5 Southeast Asia
- 14.1.6 Australia
- 14.1.7 Indonesia
- 14.1.8 Phillipes
- 14.1.9 Singapore
- 14.1.10 Thailandc
- 14.1.11 Rest of Asia Pacific
- 15. South America Fantasy Sports Market Analysis, Insights and Forecast, 2019-2031
- 15.1. Market Analysis, Insights and Forecast - By Country/Sub-region
- 15.1.1 Brazil
- 15.1.2 Argentina
- 15.1.3 Peru
- 15.1.4 Chile
- 15.1.5 Colombia
- 15.1.6 Ecuador
- 15.1.7 Venezuela
- 15.1.8 Rest of South America
- 16. North America Fantasy Sports Market Analysis, Insights and Forecast, 2019-2031
- 16.1. Market Analysis, Insights and Forecast - By Country/Sub-region
- 16.1.1 United States
- 16.1.2 Canada
- 16.1.3 Mexico
- 17. MEA Fantasy Sports Market Analysis, Insights and Forecast, 2019-2031
- 17.1. Market Analysis, Insights and Forecast - By Country/Sub-region
- 17.1.1 United Arab Emirates
- 17.1.2 Saudi Arabia
- 17.1.3 South Africa
- 17.1.4 Rest of Middle East and Africa
- 18. Competitive Analysis
- 18.1. Global Market Share Analysis 2024
- 18.2. Company Profiles
- 18.2.1 Sleeper (Blitz Studios Inc )
- 18.2.1.1. Overview
- 18.2.1.2. Products
- 18.2.1.3. SWOT Analysis
- 18.2.1.4. Recent Developments
- 18.2.1.5. Financials (Based on Availability)
- 18.2.2 Sorare SAS
- 18.2.2.1. Overview
- 18.2.2.2. Products
- 18.2.2.3. SWOT Analysis
- 18.2.2.4. Recent Developments
- 18.2.2.5. Financials (Based on Availability)
- 18.2.3 Flutter Entertainment PLC
- 18.2.3.1. Overview
- 18.2.3.2. Products
- 18.2.3.3. SWOT Analysis
- 18.2.3.4. Recent Developments
- 18.2.3.5. Financials (Based on Availability)
- 18.2.4 Vauntek Inc (Fantrax)
- 18.2.4.1. Overview
- 18.2.4.2. Products
- 18.2.4.3. SWOT Analysis
- 18.2.4.4. Recent Developments
- 18.2.4.5. Financials (Based on Availability)
- 18.2.5 Low6 Limited
- 18.2.5.1. Overview
- 18.2.5.2. Products
- 18.2.5.3. SWOT Analysis
- 18.2.5.4. Recent Developments
- 18.2.5.5. Financials (Based on Availability)
- 18.2.6 FanDuel Group
- 18.2.6.1. Overview
- 18.2.6.2. Products
- 18.2.6.3. SWOT Analysis
- 18.2.6.4. Recent Developments
- 18.2.6.5. Financials (Based on Availability)
- 18.2.7 NFL Enterprises LLC
- 18.2.7.1. Overview
- 18.2.7.2. Products
- 18.2.7.3. SWOT Analysis
- 18.2.7.4. Recent Developments
- 18.2.7.5. Financials (Based on Availability)
- 18.2.8 ESPN Sports Media Ltd
- 18.2.8.1. Overview
- 18.2.8.2. Products
- 18.2.8.3. SWOT Analysis
- 18.2.8.4. Recent Developments
- 18.2.8.5. Financials (Based on Availability)
- 18.2.9 RealTime Fantasy Sports Inc
- 18.2.9.1. Overview
- 18.2.9.2. Products
- 18.2.9.3. SWOT Analysis
- 18.2.9.4. Recent Developments
- 18.2.9.5. Financials (Based on Availability)
- 18.2.10 CBS Sports Digital
- 18.2.10.1. Overview
- 18.2.10.2. Products
- 18.2.10.3. SWOT Analysis
- 18.2.10.4. Recent Developments
- 18.2.10.5. Financials (Based on Availability)
- 18.2.11 Bovada
- 18.2.11.1. Overview
- 18.2.11.2. Products
- 18.2.11.3. SWOT Analysis
- 18.2.11.4. Recent Developments
- 18.2.11.5. Financials (Based on Availability)
- 18.2.12 DraftKings Inc
- 18.2.12.1. Overview
- 18.2.12.2. Products
- 18.2.12.3. SWOT Analysis
- 18.2.12.4. Recent Developments
- 18.2.12.5. Financials (Based on Availability)
- 18.2.13 Dream Sports Group
- 18.2.13.1. Overview
- 18.2.13.2. Products
- 18.2.13.3. SWOT Analysis
- 18.2.13.4. Recent Developments
- 18.2.13.5. Financials (Based on Availability)
- 18.2.14 Yahoo Fantasy Sports LLC
- 18.2.14.1. Overview
- 18.2.14.2. Products
- 18.2.14.3. SWOT Analysis
- 18.2.14.4. Recent Developments
- 18.2.14.5. Financials (Based on Availability)
- 18.2.1 Sleeper (Blitz Studios Inc )
List of Figures
- Figure 1: Global Fantasy Sports Market Revenue Breakdown (Million, %) by Region 2024 & 2032
- Figure 2: Global Fantasy Sports Market Volume Breakdown (K Unit, %) by Region 2024 & 2032
- Figure 3: North America Fantasy Sports Market Revenue (Million), by Country 2024 & 2032
- Figure 4: North America Fantasy Sports Market Volume (K Unit), by Country 2024 & 2032
- Figure 5: North America Fantasy Sports Market Revenue Share (%), by Country 2024 & 2032
- Figure 6: North America Fantasy Sports Market Volume Share (%), by Country 2024 & 2032
- Figure 7: Europe Fantasy Sports Market Revenue (Million), by Country 2024 & 2032
- Figure 8: Europe Fantasy Sports Market Volume (K Unit), by Country 2024 & 2032
- Figure 9: Europe Fantasy Sports Market Revenue Share (%), by Country 2024 & 2032
- Figure 10: Europe Fantasy Sports Market Volume Share (%), by Country 2024 & 2032
- Figure 11: Asia Pacific Fantasy Sports Market Revenue (Million), by Country 2024 & 2032
- Figure 12: Asia Pacific Fantasy Sports Market Volume (K Unit), by Country 2024 & 2032
- Figure 13: Asia Pacific Fantasy Sports Market Revenue Share (%), by Country 2024 & 2032
- Figure 14: Asia Pacific Fantasy Sports Market Volume Share (%), by Country 2024 & 2032
- Figure 15: South America Fantasy Sports Market Revenue (Million), by Country 2024 & 2032
- Figure 16: South America Fantasy Sports Market Volume (K Unit), by Country 2024 & 2032
- Figure 17: South America Fantasy Sports Market Revenue Share (%), by Country 2024 & 2032
- Figure 18: South America Fantasy Sports Market Volume Share (%), by Country 2024 & 2032
- Figure 19: North America Fantasy Sports Market Revenue (Million), by Country 2024 & 2032
- Figure 20: North America Fantasy Sports Market Volume (K Unit), by Country 2024 & 2032
- Figure 21: North America Fantasy Sports Market Revenue Share (%), by Country 2024 & 2032
- Figure 22: North America Fantasy Sports Market Volume Share (%), by Country 2024 & 2032
- Figure 23: MEA Fantasy Sports Market Revenue (Million), by Country 2024 & 2032
- Figure 24: MEA Fantasy Sports Market Volume (K Unit), by Country 2024 & 2032
- Figure 25: MEA Fantasy Sports Market Revenue Share (%), by Country 2024 & 2032
- Figure 26: MEA Fantasy Sports Market Volume Share (%), by Country 2024 & 2032
- Figure 27: North America Fantasy Sports Market Revenue (Million), by Type 2024 & 2032
- Figure 28: North America Fantasy Sports Market Volume (K Unit), by Type 2024 & 2032
- Figure 29: North America Fantasy Sports Market Revenue Share (%), by Type 2024 & 2032
- Figure 30: North America Fantasy Sports Market Volume Share (%), by Type 2024 & 2032
- Figure 31: North America Fantasy Sports Market Revenue (Million), by Platform 2024 & 2032
- Figure 32: North America Fantasy Sports Market Volume (K Unit), by Platform 2024 & 2032
- Figure 33: North America Fantasy Sports Market Revenue Share (%), by Platform 2024 & 2032
- Figure 34: North America Fantasy Sports Market Volume Share (%), by Platform 2024 & 2032
- Figure 35: North America Fantasy Sports Market Revenue (Million), by Demographics 2024 & 2032
- Figure 36: North America Fantasy Sports Market Volume (K Unit), by Demographics 2024 & 2032
- Figure 37: North America Fantasy Sports Market Revenue Share (%), by Demographics 2024 & 2032
- Figure 38: North America Fantasy Sports Market Volume Share (%), by Demographics 2024 & 2032
- Figure 39: North America Fantasy Sports Market Revenue (Million), by Application 2024 & 2032
- Figure 40: North America Fantasy Sports Market Volume (K Unit), by Application 2024 & 2032
- Figure 41: North America Fantasy Sports Market Revenue Share (%), by Application 2024 & 2032
- Figure 42: North America Fantasy Sports Market Volume Share (%), by Application 2024 & 2032
- Figure 43: North America Fantasy Sports Market Revenue (Million), by Country 2024 & 2032
- Figure 44: North America Fantasy Sports Market Volume (K Unit), by Country 2024 & 2032
- Figure 45: North America Fantasy Sports Market Revenue Share (%), by Country 2024 & 2032
- Figure 46: North America Fantasy Sports Market Volume Share (%), by Country 2024 & 2032
- Figure 47: Europe Fantasy Sports Market Revenue (Million), by Type 2024 & 2032
- Figure 48: Europe Fantasy Sports Market Volume (K Unit), by Type 2024 & 2032
- Figure 49: Europe Fantasy Sports Market Revenue Share (%), by Type 2024 & 2032
- Figure 50: Europe Fantasy Sports Market Volume Share (%), by Type 2024 & 2032
- Figure 51: Europe Fantasy Sports Market Revenue (Million), by Platform 2024 & 2032
- Figure 52: Europe Fantasy Sports Market Volume (K Unit), by Platform 2024 & 2032
- Figure 53: Europe Fantasy Sports Market Revenue Share (%), by Platform 2024 & 2032
- Figure 54: Europe Fantasy Sports Market Volume Share (%), by Platform 2024 & 2032
- Figure 55: Europe Fantasy Sports Market Revenue (Million), by Demographics 2024 & 2032
- Figure 56: Europe Fantasy Sports Market Volume (K Unit), by Demographics 2024 & 2032
- Figure 57: Europe Fantasy Sports Market Revenue Share (%), by Demographics 2024 & 2032
- Figure 58: Europe Fantasy Sports Market Volume Share (%), by Demographics 2024 & 2032
- Figure 59: Europe Fantasy Sports Market Revenue (Million), by Application 2024 & 2032
- Figure 60: Europe Fantasy Sports Market Volume (K Unit), by Application 2024 & 2032
- Figure 61: Europe Fantasy Sports Market Revenue Share (%), by Application 2024 & 2032
- Figure 62: Europe Fantasy Sports Market Volume Share (%), by Application 2024 & 2032
- Figure 63: Europe Fantasy Sports Market Revenue (Million), by Country 2024 & 2032
- Figure 64: Europe Fantasy Sports Market Volume (K Unit), by Country 2024 & 2032
- Figure 65: Europe Fantasy Sports Market Revenue Share (%), by Country 2024 & 2032
- Figure 66: Europe Fantasy Sports Market Volume Share (%), by Country 2024 & 2032
- Figure 67: Asia Fantasy Sports Market Revenue (Million), by Type 2024 & 2032
- Figure 68: Asia Fantasy Sports Market Volume (K Unit), by Type 2024 & 2032
- Figure 69: Asia Fantasy Sports Market Revenue Share (%), by Type 2024 & 2032
- Figure 70: Asia Fantasy Sports Market Volume Share (%), by Type 2024 & 2032
- Figure 71: Asia Fantasy Sports Market Revenue (Million), by Platform 2024 & 2032
- Figure 72: Asia Fantasy Sports Market Volume (K Unit), by Platform 2024 & 2032
- Figure 73: Asia Fantasy Sports Market Revenue Share (%), by Platform 2024 & 2032
- Figure 74: Asia Fantasy Sports Market Volume Share (%), by Platform 2024 & 2032
- Figure 75: Asia Fantasy Sports Market Revenue (Million), by Demographics 2024 & 2032
- Figure 76: Asia Fantasy Sports Market Volume (K Unit), by Demographics 2024 & 2032
- Figure 77: Asia Fantasy Sports Market Revenue Share (%), by Demographics 2024 & 2032
- Figure 78: Asia Fantasy Sports Market Volume Share (%), by Demographics 2024 & 2032
- Figure 79: Asia Fantasy Sports Market Revenue (Million), by Application 2024 & 2032
- Figure 80: Asia Fantasy Sports Market Volume (K Unit), by Application 2024 & 2032
- Figure 81: Asia Fantasy Sports Market Revenue Share (%), by Application 2024 & 2032
- Figure 82: Asia Fantasy Sports Market Volume Share (%), by Application 2024 & 2032
- Figure 83: Asia Fantasy Sports Market Revenue (Million), by Country 2024 & 2032
- Figure 84: Asia Fantasy Sports Market Volume (K Unit), by Country 2024 & 2032
- Figure 85: Asia Fantasy Sports Market Revenue Share (%), by Country 2024 & 2032
- Figure 86: Asia Fantasy Sports Market Volume Share (%), by Country 2024 & 2032
- Figure 87: Australia and New Zealand Fantasy Sports Market Revenue (Million), by Type 2024 & 2032
- Figure 88: Australia and New Zealand Fantasy Sports Market Volume (K Unit), by Type 2024 & 2032
- Figure 89: Australia and New Zealand Fantasy Sports Market Revenue Share (%), by Type 2024 & 2032
- Figure 90: Australia and New Zealand Fantasy Sports Market Volume Share (%), by Type 2024 & 2032
- Figure 91: Australia and New Zealand Fantasy Sports Market Revenue (Million), by Platform 2024 & 2032
- Figure 92: Australia and New Zealand Fantasy Sports Market Volume (K Unit), by Platform 2024 & 2032
- Figure 93: Australia and New Zealand Fantasy Sports Market Revenue Share (%), by Platform 2024 & 2032
- Figure 94: Australia and New Zealand Fantasy Sports Market Volume Share (%), by Platform 2024 & 2032
- Figure 95: Australia and New Zealand Fantasy Sports Market Revenue (Million), by Demographics 2024 & 2032
- Figure 96: Australia and New Zealand Fantasy Sports Market Volume (K Unit), by Demographics 2024 & 2032
- Figure 97: Australia and New Zealand Fantasy Sports Market Revenue Share (%), by Demographics 2024 & 2032
- Figure 98: Australia and New Zealand Fantasy Sports Market Volume Share (%), by Demographics 2024 & 2032
- Figure 99: Australia and New Zealand Fantasy Sports Market Revenue (Million), by Application 2024 & 2032
- Figure 100: Australia and New Zealand Fantasy Sports Market Volume (K Unit), by Application 2024 & 2032
- Figure 101: Australia and New Zealand Fantasy Sports Market Revenue Share (%), by Application 2024 & 2032
- Figure 102: Australia and New Zealand Fantasy Sports Market Volume Share (%), by Application 2024 & 2032
- Figure 103: Australia and New Zealand Fantasy Sports Market Revenue (Million), by Country 2024 & 2032
- Figure 104: Australia and New Zealand Fantasy Sports Market Volume (K Unit), by Country 2024 & 2032
- Figure 105: Australia and New Zealand Fantasy Sports Market Revenue Share (%), by Country 2024 & 2032
- Figure 106: Australia and New Zealand Fantasy Sports Market Volume Share (%), by Country 2024 & 2032
- Figure 107: Latin America Fantasy Sports Market Revenue (Million), by Type 2024 & 2032
- Figure 108: Latin America Fantasy Sports Market Volume (K Unit), by Type 2024 & 2032
- Figure 109: Latin America Fantasy Sports Market Revenue Share (%), by Type 2024 & 2032
- Figure 110: Latin America Fantasy Sports Market Volume Share (%), by Type 2024 & 2032
- Figure 111: Latin America Fantasy Sports Market Revenue (Million), by Platform 2024 & 2032
- Figure 112: Latin America Fantasy Sports Market Volume (K Unit), by Platform 2024 & 2032
- Figure 113: Latin America Fantasy Sports Market Revenue Share (%), by Platform 2024 & 2032
- Figure 114: Latin America Fantasy Sports Market Volume Share (%), by Platform 2024 & 2032
- Figure 115: Latin America Fantasy Sports Market Revenue (Million), by Demographics 2024 & 2032
- Figure 116: Latin America Fantasy Sports Market Volume (K Unit), by Demographics 2024 & 2032
- Figure 117: Latin America Fantasy Sports Market Revenue Share (%), by Demographics 2024 & 2032
- Figure 118: Latin America Fantasy Sports Market Volume Share (%), by Demographics 2024 & 2032
- Figure 119: Latin America Fantasy Sports Market Revenue (Million), by Application 2024 & 2032
- Figure 120: Latin America Fantasy Sports Market Volume (K Unit), by Application 2024 & 2032
- Figure 121: Latin America Fantasy Sports Market Revenue Share (%), by Application 2024 & 2032
- Figure 122: Latin America Fantasy Sports Market Volume Share (%), by Application 2024 & 2032
- Figure 123: Latin America Fantasy Sports Market Revenue (Million), by Country 2024 & 2032
- Figure 124: Latin America Fantasy Sports Market Volume (K Unit), by Country 2024 & 2032
- Figure 125: Latin America Fantasy Sports Market Revenue Share (%), by Country 2024 & 2032
- Figure 126: Latin America Fantasy Sports Market Volume Share (%), by Country 2024 & 2032
- Figure 127: Middle East and Africa Fantasy Sports Market Revenue (Million), by Type 2024 & 2032
- Figure 128: Middle East and Africa Fantasy Sports Market Volume (K Unit), by Type 2024 & 2032
- Figure 129: Middle East and Africa Fantasy Sports Market Revenue Share (%), by Type 2024 & 2032
- Figure 130: Middle East and Africa Fantasy Sports Market Volume Share (%), by Type 2024 & 2032
- Figure 131: Middle East and Africa Fantasy Sports Market Revenue (Million), by Platform 2024 & 2032
- Figure 132: Middle East and Africa Fantasy Sports Market Volume (K Unit), by Platform 2024 & 2032
- Figure 133: Middle East and Africa Fantasy Sports Market Revenue Share (%), by Platform 2024 & 2032
- Figure 134: Middle East and Africa Fantasy Sports Market Volume Share (%), by Platform 2024 & 2032
- Figure 135: Middle East and Africa Fantasy Sports Market Revenue (Million), by Demographics 2024 & 2032
- Figure 136: Middle East and Africa Fantasy Sports Market Volume (K Unit), by Demographics 2024 & 2032
- Figure 137: Middle East and Africa Fantasy Sports Market Revenue Share (%), by Demographics 2024 & 2032
- Figure 138: Middle East and Africa Fantasy Sports Market Volume Share (%), by Demographics 2024 & 2032
- Figure 139: Middle East and Africa Fantasy Sports Market Revenue (Million), by Application 2024 & 2032
- Figure 140: Middle East and Africa Fantasy Sports Market Volume (K Unit), by Application 2024 & 2032
- Figure 141: Middle East and Africa Fantasy Sports Market Revenue Share (%), by Application 2024 & 2032
- Figure 142: Middle East and Africa Fantasy Sports Market Volume Share (%), by Application 2024 & 2032
- Figure 143: Middle East and Africa Fantasy Sports Market Revenue (Million), by Country 2024 & 2032
- Figure 144: Middle East and Africa Fantasy Sports Market Volume (K Unit), by Country 2024 & 2032
- Figure 145: Middle East and Africa Fantasy Sports Market Revenue Share (%), by Country 2024 & 2032
- Figure 146: Middle East and Africa Fantasy Sports Market Volume Share (%), by Country 2024 & 2032
List of Tables
- Table 1: Global Fantasy Sports Market Revenue Million Forecast, by Region 2019 & 2032
- Table 2: Global Fantasy Sports Market Volume K Unit Forecast, by Region 2019 & 2032
- Table 3: Global Fantasy Sports Market Revenue Million Forecast, by Type 2019 & 2032
- Table 4: Global Fantasy Sports Market Volume K Unit Forecast, by Type 2019 & 2032
- Table 5: Global Fantasy Sports Market Revenue Million Forecast, by Platform 2019 & 2032
- Table 6: Global Fantasy Sports Market Volume K Unit Forecast, by Platform 2019 & 2032
- Table 7: Global Fantasy Sports Market Revenue Million Forecast, by Demographics 2019 & 2032
- Table 8: Global Fantasy Sports Market Volume K Unit Forecast, by Demographics 2019 & 2032
- Table 9: Global Fantasy Sports Market Revenue Million Forecast, by Application 2019 & 2032
- Table 10: Global Fantasy Sports Market Volume K Unit Forecast, by Application 2019 & 2032
- Table 11: Global Fantasy Sports Market Revenue Million Forecast, by Region 2019 & 2032
- Table 12: Global Fantasy Sports Market Volume K Unit Forecast, by Region 2019 & 2032
- Table 13: Global Fantasy Sports Market Revenue Million Forecast, by Country 2019 & 2032
- Table 14: Global Fantasy Sports Market Volume K Unit Forecast, by Country 2019 & 2032
- Table 15: United States Fantasy Sports Market Revenue (Million) Forecast, by Application 2019 & 2032
- Table 16: United States Fantasy Sports Market Volume (K Unit) Forecast, by Application 2019 & 2032
- Table 17: Canada Fantasy Sports Market Revenue (Million) Forecast, by Application 2019 & 2032
- Table 18: Canada Fantasy Sports Market Volume (K Unit) Forecast, by Application 2019 & 2032
- Table 19: Mexico Fantasy Sports Market Revenue (Million) Forecast, by Application 2019 & 2032
- Table 20: Mexico Fantasy Sports Market Volume (K Unit) Forecast, by Application 2019 & 2032
- Table 21: Global Fantasy Sports Market Revenue Million Forecast, by Country 2019 & 2032
- Table 22: Global Fantasy Sports Market Volume K Unit Forecast, by Country 2019 & 2032
- Table 23: Germany Fantasy Sports Market Revenue (Million) Forecast, by Application 2019 & 2032
- Table 24: Germany Fantasy Sports Market Volume (K Unit) Forecast, by Application 2019 & 2032
- Table 25: United Kingdom Fantasy Sports Market Revenue (Million) Forecast, by Application 2019 & 2032
- Table 26: United Kingdom Fantasy Sports Market Volume (K Unit) Forecast, by Application 2019 & 2032
- Table 27: France Fantasy Sports Market Revenue (Million) Forecast, by Application 2019 & 2032
- Table 28: France Fantasy Sports Market Volume (K Unit) Forecast, by Application 2019 & 2032
- Table 29: Spain Fantasy Sports Market Revenue (Million) Forecast, by Application 2019 & 2032
- Table 30: Spain Fantasy Sports Market Volume (K Unit) Forecast, by Application 2019 & 2032
- Table 31: Italy Fantasy Sports Market Revenue (Million) Forecast, by Application 2019 & 2032
- Table 32: Italy Fantasy Sports Market Volume (K Unit) Forecast, by Application 2019 & 2032
- Table 33: Spain Fantasy Sports Market Revenue (Million) Forecast, by Application 2019 & 2032
- Table 34: Spain Fantasy Sports Market Volume (K Unit) Forecast, by Application 2019 & 2032
- Table 35: Belgium Fantasy Sports Market Revenue (Million) Forecast, by Application 2019 & 2032
- Table 36: Belgium Fantasy Sports Market Volume (K Unit) Forecast, by Application 2019 & 2032
- Table 37: Netherland Fantasy Sports Market Revenue (Million) Forecast, by Application 2019 & 2032
- Table 38: Netherland Fantasy Sports Market Volume (K Unit) Forecast, by Application 2019 & 2032
- Table 39: Nordics Fantasy Sports Market Revenue (Million) Forecast, by Application 2019 & 2032
- Table 40: Nordics Fantasy Sports Market Volume (K Unit) Forecast, by Application 2019 & 2032
- Table 41: Rest of Europe Fantasy Sports Market Revenue (Million) Forecast, by Application 2019 & 2032
- Table 42: Rest of Europe Fantasy Sports Market Volume (K Unit) Forecast, by Application 2019 & 2032
- Table 43: Global Fantasy Sports Market Revenue Million Forecast, by Country 2019 & 2032
- Table 44: Global Fantasy Sports Market Volume K Unit Forecast, by Country 2019 & 2032
- Table 45: China Fantasy Sports Market Revenue (Million) Forecast, by Application 2019 & 2032
- Table 46: China Fantasy Sports Market Volume (K Unit) Forecast, by Application 2019 & 2032
- Table 47: Japan Fantasy Sports Market Revenue (Million) Forecast, by Application 2019 & 2032
- Table 48: Japan Fantasy Sports Market Volume (K Unit) Forecast, by Application 2019 & 2032
- Table 49: India Fantasy Sports Market Revenue (Million) Forecast, by Application 2019 & 2032
- Table 50: India Fantasy Sports Market Volume (K Unit) Forecast, by Application 2019 & 2032
- Table 51: South Korea Fantasy Sports Market Revenue (Million) Forecast, by Application 2019 & 2032
- Table 52: South Korea Fantasy Sports Market Volume (K Unit) Forecast, by Application 2019 & 2032
- Table 53: Southeast Asia Fantasy Sports Market Revenue (Million) Forecast, by Application 2019 & 2032
- Table 54: Southeast Asia Fantasy Sports Market Volume (K Unit) Forecast, by Application 2019 & 2032
- Table 55: Australia Fantasy Sports Market Revenue (Million) Forecast, by Application 2019 & 2032
- Table 56: Australia Fantasy Sports Market Volume (K Unit) Forecast, by Application 2019 & 2032
- Table 57: Indonesia Fantasy Sports Market Revenue (Million) Forecast, by Application 2019 & 2032
- Table 58: Indonesia Fantasy Sports Market Volume (K Unit) Forecast, by Application 2019 & 2032
- Table 59: Phillipes Fantasy Sports Market Revenue (Million) Forecast, by Application 2019 & 2032
- Table 60: Phillipes Fantasy Sports Market Volume (K Unit) Forecast, by Application 2019 & 2032
- Table 61: Singapore Fantasy Sports Market Revenue (Million) Forecast, by Application 2019 & 2032
- Table 62: Singapore Fantasy Sports Market Volume (K Unit) Forecast, by Application 2019 & 2032
- Table 63: Thailandc Fantasy Sports Market Revenue (Million) Forecast, by Application 2019 & 2032
- Table 64: Thailandc Fantasy Sports Market Volume (K Unit) Forecast, by Application 2019 & 2032
- Table 65: Rest of Asia Pacific Fantasy Sports Market Revenue (Million) Forecast, by Application 2019 & 2032
- Table 66: Rest of Asia Pacific Fantasy Sports Market Volume (K Unit) Forecast, by Application 2019 & 2032
- Table 67: Global Fantasy Sports Market Revenue Million Forecast, by Country 2019 & 2032
- Table 68: Global Fantasy Sports Market Volume K Unit Forecast, by Country 2019 & 2032
- Table 69: Brazil Fantasy Sports Market Revenue (Million) Forecast, by Application 2019 & 2032
- Table 70: Brazil Fantasy Sports Market Volume (K Unit) Forecast, by Application 2019 & 2032
- Table 71: Argentina Fantasy Sports Market Revenue (Million) Forecast, by Application 2019 & 2032
- Table 72: Argentina Fantasy Sports Market Volume (K Unit) Forecast, by Application 2019 & 2032
- Table 73: Peru Fantasy Sports Market Revenue (Million) Forecast, by Application 2019 & 2032
- Table 74: Peru Fantasy Sports Market Volume (K Unit) Forecast, by Application 2019 & 2032
- Table 75: Chile Fantasy Sports Market Revenue (Million) Forecast, by Application 2019 & 2032
- Table 76: Chile Fantasy Sports Market Volume (K Unit) Forecast, by Application 2019 & 2032
- Table 77: Colombia Fantasy Sports Market Revenue (Million) Forecast, by Application 2019 & 2032
- Table 78: Colombia Fantasy Sports Market Volume (K Unit) Forecast, by Application 2019 & 2032
- Table 79: Ecuador Fantasy Sports Market Revenue (Million) Forecast, by Application 2019 & 2032
- Table 80: Ecuador Fantasy Sports Market Volume (K Unit) Forecast, by Application 2019 & 2032
- Table 81: Venezuela Fantasy Sports Market Revenue (Million) Forecast, by Application 2019 & 2032
- Table 82: Venezuela Fantasy Sports Market Volume (K Unit) Forecast, by Application 2019 & 2032
- Table 83: Rest of South America Fantasy Sports Market Revenue (Million) Forecast, by Application 2019 & 2032
- Table 84: Rest of South America Fantasy Sports Market Volume (K Unit) Forecast, by Application 2019 & 2032
- Table 85: Global Fantasy Sports Market Revenue Million Forecast, by Country 2019 & 2032
- Table 86: Global Fantasy Sports Market Volume K Unit Forecast, by Country 2019 & 2032
- Table 87: United States Fantasy Sports Market Revenue (Million) Forecast, by Application 2019 & 2032
- Table 88: United States Fantasy Sports Market Volume (K Unit) Forecast, by Application 2019 & 2032
- Table 89: Canada Fantasy Sports Market Revenue (Million) Forecast, by Application 2019 & 2032
- Table 90: Canada Fantasy Sports Market Volume (K Unit) Forecast, by Application 2019 & 2032
- Table 91: Mexico Fantasy Sports Market Revenue (Million) Forecast, by Application 2019 & 2032
- Table 92: Mexico Fantasy Sports Market Volume (K Unit) Forecast, by Application 2019 & 2032
- Table 93: Global Fantasy Sports Market Revenue Million Forecast, by Country 2019 & 2032
- Table 94: Global Fantasy Sports Market Volume K Unit Forecast, by Country 2019 & 2032
- Table 95: United Arab Emirates Fantasy Sports Market Revenue (Million) Forecast, by Application 2019 & 2032
- Table 96: United Arab Emirates Fantasy Sports Market Volume (K Unit) Forecast, by Application 2019 & 2032
- Table 97: Saudi Arabia Fantasy Sports Market Revenue (Million) Forecast, by Application 2019 & 2032
- Table 98: Saudi Arabia Fantasy Sports Market Volume (K Unit) Forecast, by Application 2019 & 2032
- Table 99: South Africa Fantasy Sports Market Revenue (Million) Forecast, by Application 2019 & 2032
- Table 100: South Africa Fantasy Sports Market Volume (K Unit) Forecast, by Application 2019 & 2032
- Table 101: Rest of Middle East and Africa Fantasy Sports Market Revenue (Million) Forecast, by Application 2019 & 2032
- Table 102: Rest of Middle East and Africa Fantasy Sports Market Volume (K Unit) Forecast, by Application 2019 & 2032
- Table 103: Global Fantasy Sports Market Revenue Million Forecast, by Type 2019 & 2032
- Table 104: Global Fantasy Sports Market Volume K Unit Forecast, by Type 2019 & 2032
- Table 105: Global Fantasy Sports Market Revenue Million Forecast, by Platform 2019 & 2032
- Table 106: Global Fantasy Sports Market Volume K Unit Forecast, by Platform 2019 & 2032
- Table 107: Global Fantasy Sports Market Revenue Million Forecast, by Demographics 2019 & 2032
- Table 108: Global Fantasy Sports Market Volume K Unit Forecast, by Demographics 2019 & 2032
- Table 109: Global Fantasy Sports Market Revenue Million Forecast, by Application 2019 & 2032
- Table 110: Global Fantasy Sports Market Volume K Unit Forecast, by Application 2019 & 2032
- Table 111: Global Fantasy Sports Market Revenue Million Forecast, by Country 2019 & 2032
- Table 112: Global Fantasy Sports Market Volume K Unit Forecast, by Country 2019 & 2032
- Table 113: Global Fantasy Sports Market Revenue Million Forecast, by Type 2019 & 2032
- Table 114: Global Fantasy Sports Market Volume K Unit Forecast, by Type 2019 & 2032
- Table 115: Global Fantasy Sports Market Revenue Million Forecast, by Platform 2019 & 2032
- Table 116: Global Fantasy Sports Market Volume K Unit Forecast, by Platform 2019 & 2032
- Table 117: Global Fantasy Sports Market Revenue Million Forecast, by Demographics 2019 & 2032
- Table 118: Global Fantasy Sports Market Volume K Unit Forecast, by Demographics 2019 & 2032
- Table 119: Global Fantasy Sports Market Revenue Million Forecast, by Application 2019 & 2032
- Table 120: Global Fantasy Sports Market Volume K Unit Forecast, by Application 2019 & 2032
- Table 121: Global Fantasy Sports Market Revenue Million Forecast, by Country 2019 & 2032
- Table 122: Global Fantasy Sports Market Volume K Unit Forecast, by Country 2019 & 2032
- Table 123: Global Fantasy Sports Market Revenue Million Forecast, by Type 2019 & 2032
- Table 124: Global Fantasy Sports Market Volume K Unit Forecast, by Type 2019 & 2032
- Table 125: Global Fantasy Sports Market Revenue Million Forecast, by Platform 2019 & 2032
- Table 126: Global Fantasy Sports Market Volume K Unit Forecast, by Platform 2019 & 2032
- Table 127: Global Fantasy Sports Market Revenue Million Forecast, by Demographics 2019 & 2032
- Table 128: Global Fantasy Sports Market Volume K Unit Forecast, by Demographics 2019 & 2032
- Table 129: Global Fantasy Sports Market Revenue Million Forecast, by Application 2019 & 2032
- Table 130: Global Fantasy Sports Market Volume K Unit Forecast, by Application 2019 & 2032
- Table 131: Global Fantasy Sports Market Revenue Million Forecast, by Country 2019 & 2032
- Table 132: Global Fantasy Sports Market Volume K Unit Forecast, by Country 2019 & 2032
- Table 133: Global Fantasy Sports Market Revenue Million Forecast, by Type 2019 & 2032
- Table 134: Global Fantasy Sports Market Volume K Unit Forecast, by Type 2019 & 2032
- Table 135: Global Fantasy Sports Market Revenue Million Forecast, by Platform 2019 & 2032
- Table 136: Global Fantasy Sports Market Volume K Unit Forecast, by Platform 2019 & 2032
- Table 137: Global Fantasy Sports Market Revenue Million Forecast, by Demographics 2019 & 2032
- Table 138: Global Fantasy Sports Market Volume K Unit Forecast, by Demographics 2019 & 2032
- Table 139: Global Fantasy Sports Market Revenue Million Forecast, by Application 2019 & 2032
- Table 140: Global Fantasy Sports Market Volume K Unit Forecast, by Application 2019 & 2032
- Table 141: Global Fantasy Sports Market Revenue Million Forecast, by Country 2019 & 2032
- Table 142: Global Fantasy Sports Market Volume K Unit Forecast, by Country 2019 & 2032
- Table 143: Global Fantasy Sports Market Revenue Million Forecast, by Type 2019 & 2032
- Table 144: Global Fantasy Sports Market Volume K Unit Forecast, by Type 2019 & 2032
- Table 145: Global Fantasy Sports Market Revenue Million Forecast, by Platform 2019 & 2032
- Table 146: Global Fantasy Sports Market Volume K Unit Forecast, by Platform 2019 & 2032
- Table 147: Global Fantasy Sports Market Revenue Million Forecast, by Demographics 2019 & 2032
- Table 148: Global Fantasy Sports Market Volume K Unit Forecast, by Demographics 2019 & 2032
- Table 149: Global Fantasy Sports Market Revenue Million Forecast, by Application 2019 & 2032
- Table 150: Global Fantasy Sports Market Volume K Unit Forecast, by Application 2019 & 2032
- Table 151: Global Fantasy Sports Market Revenue Million Forecast, by Country 2019 & 2032
- Table 152: Global Fantasy Sports Market Volume K Unit Forecast, by Country 2019 & 2032
- Table 153: Global Fantasy Sports Market Revenue Million Forecast, by Type 2019 & 2032
- Table 154: Global Fantasy Sports Market Volume K Unit Forecast, by Type 2019 & 2032
- Table 155: Global Fantasy Sports Market Revenue Million Forecast, by Platform 2019 & 2032
- Table 156: Global Fantasy Sports Market Volume K Unit Forecast, by Platform 2019 & 2032
- Table 157: Global Fantasy Sports Market Revenue Million Forecast, by Demographics 2019 & 2032
- Table 158: Global Fantasy Sports Market Volume K Unit Forecast, by Demographics 2019 & 2032
- Table 159: Global Fantasy Sports Market Revenue Million Forecast, by Application 2019 & 2032
- Table 160: Global Fantasy Sports Market Volume K Unit Forecast, by Application 2019 & 2032
- Table 161: Global Fantasy Sports Market Revenue Million Forecast, by Country 2019 & 2032
- Table 162: Global Fantasy Sports Market Volume K Unit Forecast, by Country 2019 & 2032
Frequently Asked Questions
1. What is the projected Compound Annual Growth Rate (CAGR) of the Fantasy Sports Market?
The projected CAGR is approximately 13.83%.
2. Which companies are prominent players in the Fantasy Sports Market?
Key companies in the market include Sleeper (Blitz Studios Inc ), Sorare SAS, Flutter Entertainment PLC, Vauntek Inc (Fantrax), Low6 Limited, FanDuel Group, NFL Enterprises LLC, ESPN Sports Media Ltd, RealTime Fantasy Sports Inc, CBS Sports Digital, Bovada, DraftKings Inc, Dream Sports Group, Yahoo Fantasy Sports LLC.
3. What are the main segments of the Fantasy Sports Market?
The market segments include Type, Platform, Demographics, Application.
4. Can you provide details about the market size?
The market size is estimated to be USD 32.75 Million as of 2022.
5. What are some drivers contributing to market growth?
Increasing Sports Fan Engagement; Technological Advancements might Drive the Market Growth.
6. What are the notable trends driving market growth?
Increasing Sports Fan Engagement may Drive the Market Growth.
7. Are there any restraints impacting market growth?
Low Awareness and Regulatory Framework; Competition from Traditional Sports Betting.
8. Can you provide examples of recent developments in the market?
March 2023: DraftKings Inc. announced plans to open its renowned online sportsbook, subject to licensing and regulatory approval in Massachusetts. Massachusetts will be the 21st state in the union to provide an online sportsbook by Boston-based DraftKings. In addition to giving Massachusetts residents access to several bet types, such as same-game parlays, player props, unique odds, boost choices, and more, DraftKings will also offer clients in the state attractive and exclusive bonuses.
9. What pricing options are available for accessing the report?
Pricing options include single-user, multi-user, and enterprise licenses priced at USD 4750, USD 5250, and USD 8750 respectively.
10. Is the market size provided in terms of value or volume?
The market size is provided in terms of value, measured in Million and volume, measured in K Unit.
11. Are there any specific market keywords associated with the report?
Yes, the market keyword associated with the report is "Fantasy Sports Market," which aids in identifying and referencing the specific market segment covered.
12. How do I determine which pricing option suits my needs best?
The pricing options vary based on user requirements and access needs. Individual users may opt for single-user licenses, while businesses requiring broader access may choose multi-user or enterprise licenses for cost-effective access to the report.
13. Are there any additional resources or data provided in the Fantasy Sports Market report?
While the report offers comprehensive insights, it's advisable to review the specific contents or supplementary materials provided to ascertain if additional resources or data are available.
14. How can I stay updated on further developments or reports in the Fantasy Sports Market?
To stay informed about further developments, trends, and reports in the Fantasy Sports Market, consider subscribing to industry newsletters, following relevant companies and organizations, or regularly checking reputable industry news sources and publications.
Methodology
Step 1 - Identification of Relevant Samples Size from Population Database


Step 2 - Approaches for Defining Global Market Size (Value, Volume* & Price*)

Note*: In applicable scenarios
Step 3 - Data Sources
Primary Research
- Web Analytics
- Survey Reports
- Research Institute
- Latest Research Reports
- Opinion Leaders
Secondary Research
- Annual Reports
- White Paper
- Latest Press Release
- Industry Association
- Paid Database
- Investor Presentations

Step 4 - Data Triangulation
Involves using different sources of information in order to increase the validity of a study
These sources are likely to be stakeholders in a program - participants, other researchers, program staff, other community members, and so on.
Then we put all data in single framework & apply various statistical tools to find out the dynamic on the market.
During the analysis stage, feedback from the stakeholder groups would be compared to determine areas of agreement as well as areas of divergence


