
Key Insights
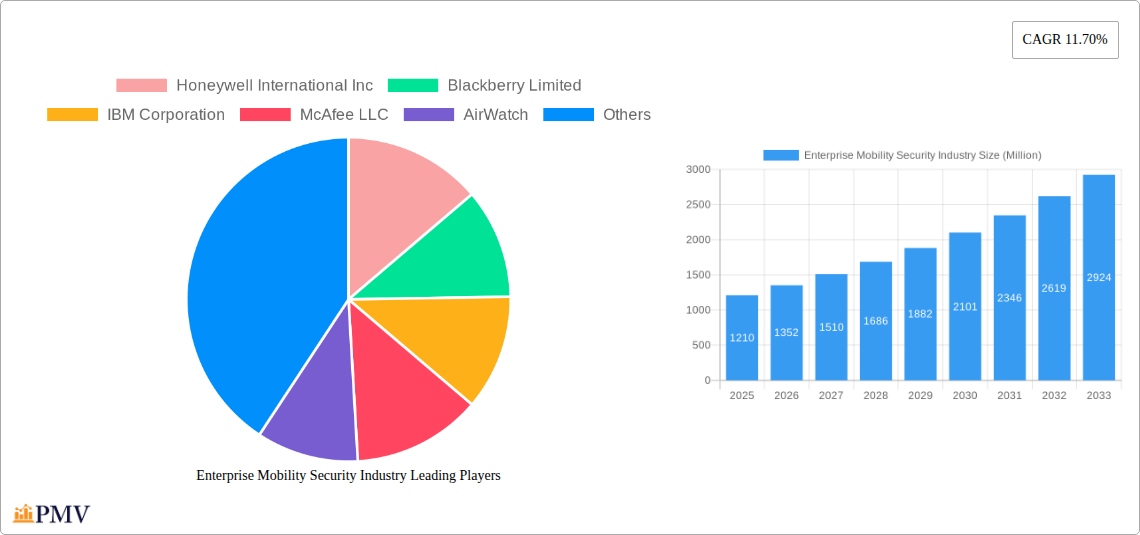
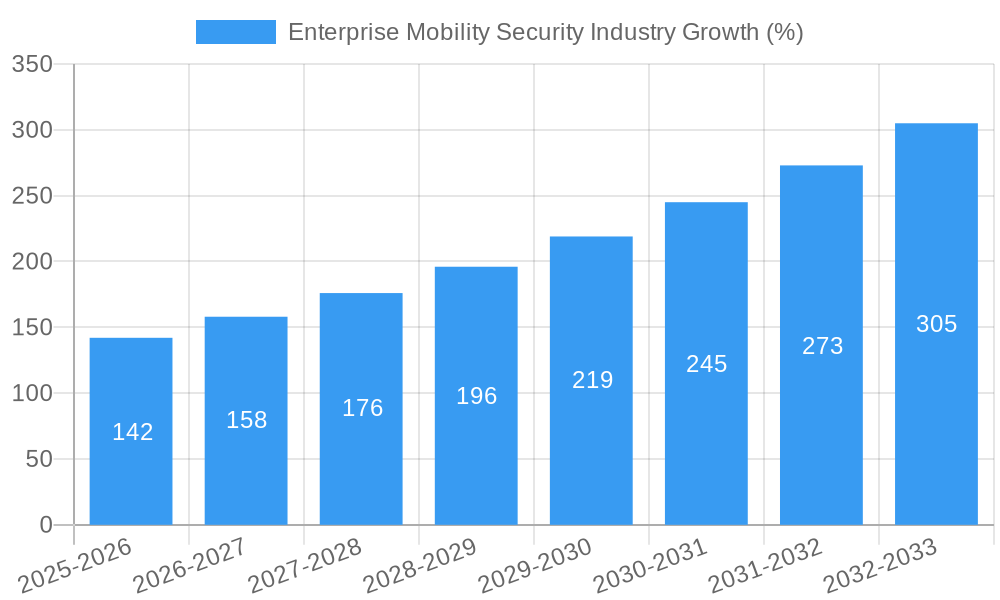
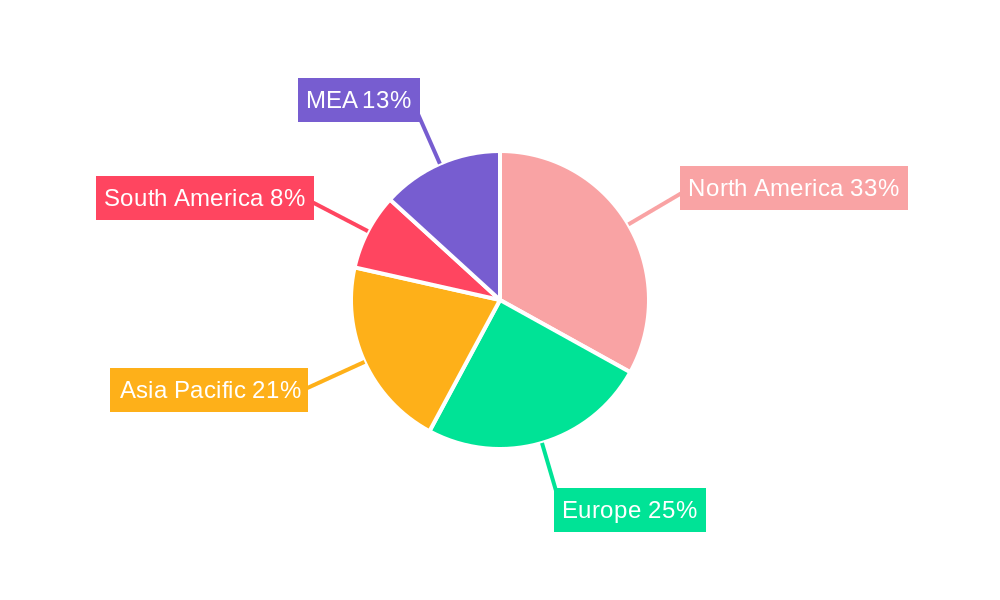
The Enterprise Mobility Security (EMS) market is experiencing robust growth, projected to reach $1.21 billion in 2025 and maintain a Compound Annual Growth Rate (CAGR) of 11.70% from 2025 to 2033. This expansion is driven by several key factors. The increasing adoption of mobile devices for business operations, coupled with the rising concerns around data breaches and compliance regulations, fuels the demand for robust security solutions. The shift towards remote work models, accelerated by recent global events, has further amplified the need for secure access and management of corporate data across diverse devices and locations. Growth is particularly strong in sectors like banking/insurance and healthcare, where sensitive data necessitates sophisticated security measures. The market is segmented by device type (smartphones, laptops, tablets) and end-user industry (banking/insurance, healthcare, IT and telecom, government, others). Competition is intense, with major players like Honeywell, Blackberry, IBM, McAfee, and Cisco vying for market share through innovation and strategic partnerships. Geographic expansion is also a key driver, with North America currently holding a significant market share, followed by Europe and the Asia-Pacific region, which are expected to witness considerable growth in the coming years. Continued technological advancements, including the integration of AI and machine learning in security solutions, will further shape the market landscape and drive future growth.
The significant players in the EMS market are continuously developing and improving their offerings to address evolving security threats and user demands. The integration of advanced technologies such as Artificial Intelligence (AI) and Machine Learning (ML) is expected to play a crucial role in enhancing the effectiveness of EMS solutions, leading to more sophisticated threat detection and response mechanisms. Furthermore, the increasing focus on cloud-based security solutions and the growing adoption of mobile device management (MDM) and enterprise mobility management (EMM) platforms will further drive the market's expansion. While the market faces certain challenges, such as the complexity of managing diverse mobile environments and the rising costs associated with implementing and maintaining robust security infrastructure, the overall outlook remains positive, driven by the growing need for secure and reliable mobile access to corporate data and applications across various industries.
Enterprise Mobility Security Industry Market Report: 2019-2033
This comprehensive report provides a detailed analysis of the Enterprise Mobility Security industry, covering market size, segmentation, competitive landscape, key trends, and future outlook from 2019 to 2033. The study period spans 2019-2024 (Historical Period), with 2025 as the base and estimated year. The forecast period extends from 2025-2033, offering invaluable insights for businesses and investors seeking to navigate this rapidly evolving sector. The report projects a market value exceeding $XX Million by 2033.
Enterprise Mobility Security Industry Market Structure & Competitive Dynamics
The Enterprise Mobility Security market is characterized by a moderately concentrated landscape, with key players such as Honeywell International Inc, Blackberry Limited, IBM Corporation, McAfee LLC, AirWatch, Cisco Systems Inc, Microsoft Corporation, Oracle Corporation, Symantec Corporation, Citrix Systems Inc, MobileIron, and SAP SE holding significant market share. Market concentration is influenced by factors including technological innovation, regulatory compliance, and strategic partnerships.
Market Share: While precise market share figures for each company are proprietary and vary by segment, the aforementioned players collectively command a significant portion (estimated at 70-80%) of the global market. Smaller players compete based on niche solutions and regional specialization.
Innovation Ecosystems: The industry thrives on continuous innovation, with players investing heavily in R&D to enhance security features, improve user experience, and adapt to evolving threats. This includes AI-powered threat detection, advanced encryption, and seamless integration with existing IT infrastructures.
Regulatory Frameworks: Stringent data privacy regulations (like GDPR and CCPA) significantly influence market dynamics. Compliance demands drive investment in robust security solutions and propel market growth.
Product Substitutes: Open-source security solutions and DIY approaches exist but lack the comprehensive features, support, and scalability of enterprise-grade solutions. This maintains the dominance of established players.
End-User Trends: The increasing adoption of BYOD (Bring Your Own Device) policies and the shift towards remote work significantly impact demand for enterprise mobility security solutions.
M&A Activities: The industry witnesses frequent mergers and acquisitions (M&A) activity. The Kocho acquisition of Mobliciti in October 2022, valued at an estimated $XX Million, showcases the trend towards consolidation and expansion of service offerings. The CWSI acquisition of AVR International in July 2022 for EUR 5.2 Million further emphasizes this trend. These deals often involve strategic partnerships to enhance capabilities and expand market reach.
Enterprise Mobility Security Industry Trends & Insights
The Enterprise Mobility Security market is experiencing robust growth, driven by several key factors. The increasing adoption of mobile devices in the workplace, the rise of remote work, the growing threat landscape, and the increasing need for secure data access are propelling the market forward. The market is projected to experience a Compound Annual Growth Rate (CAGR) of XX% during the forecast period (2025-2033). Market penetration is currently estimated at XX%, with significant room for expansion, particularly in developing economies.
Technological disruptions, such as the advent of 5G and IoT (Internet of Things) devices, are reshaping the landscape. These technologies enhance connectivity and create new security challenges, driving demand for advanced security solutions. Consumer preferences increasingly favor user-friendly, intuitive solutions that integrate seamlessly with existing IT infrastructure. Competitive dynamics are characterized by intense innovation, strategic partnerships, and M&A activity to maintain and extend market leadership. The increasing sophistication of cyber threats necessitates constant investment in R&D, emphasizing advanced features such as AI-powered threat detection and behavioral analytics. The emphasis on improved data privacy and compliance with regulations such as GDPR and CCPA also influences the demand for robust and compliant solutions.
Dominant Markets & Segments in Enterprise Mobility Security Industry
The Enterprise Mobility Security market is globally distributed, with strong growth anticipated across various regions. However, North America and Europe currently hold the largest market shares due to high adoption rates and mature IT infrastructure. Within the segments:
By Device: Smartphones dominate the market due to their widespread usage and the inherent security vulnerabilities they pose. Laptops and tablets also contribute significantly but to a lesser extent.
By End-User: The Banking/Insurance and Healthcare sectors are leading adopters due to stringent regulatory requirements and the sensitive nature of the data handled. The IT and Telecom industry shows high demand due to the intrinsic importance of security. Government and other end-user industries contribute substantially.
Key Drivers:
- Economic Policies: Government initiatives promoting digital transformation and cybersecurity investments drive market growth.
- Infrastructure: Robust digital infrastructure facilitates higher adoption rates.
- Regulatory Compliance: Stringent data privacy regulations push organizations to invest in strong security measures.
Enterprise Mobility Security Industry Product Innovations
The industry showcases constant innovation, with new products and features continuously emerging. Recent advancements include AI-powered threat detection systems, advanced encryption algorithms, and improved mobile device management (MDM) capabilities. These developments focus on strengthening security postures, enhancing user experience, and simplifying management complexities. The integration of Zero Trust security frameworks and robust identity and access management (IAM) solutions is gaining traction, offering improved security and enhanced control. This ensures market fit by addressing the growing need for advanced security, especially in the face of increasingly sophisticated cyber threats.
Report Segmentation & Scope
This report segments the Enterprise Mobility Security market in two key dimensions:
By Device: Smartphones, Laptops, and Tablets are analyzed separately, considering their unique security challenges and adoption rates. Each segment's growth projection, market size, and competitive dynamics are assessed, revealing the current Smartphone dominance and future projections for Tablets and Laptops.
By End-User: The report details the market performance across Banking/Insurance, Healthcare, IT and Telecom, Government, and Other End-user Industries. Each segment's unique requirements, regulatory considerations, and growth potential are examined, revealing the significant role of financial services and healthcare.
Key Drivers of Enterprise Mobility Security Industry Growth
Several factors are driving the growth of the Enterprise Mobility Security industry:
Technological Advancements: AI-powered threat detection, enhanced encryption, and improved MDM capabilities are key growth drivers.
Economic Factors: Increased investments in IT infrastructure and the rise of cloud-based solutions fuel market expansion.
Regulatory Compliance: Stringent data privacy regulations such as GDPR and CCPA enforce the adoption of robust security measures. The rise of remote work also impacts growth, driving demand for secure remote access and data protection.
Challenges in the Enterprise Mobility Security Industry Sector
The industry faces several challenges:
Regulatory Hurdles: Navigating the complex regulatory landscape adds significant costs and compliance complexities.
Supply Chain Issues: Global supply chain disruptions can affect the availability and cost of hardware and software components.
Competitive Pressures: Intense competition and the constant evolution of cyber threats require continuous investment in R&D and innovation to remain competitive. These factors can significantly impact profit margins and market share.
Leading Players in the Enterprise Mobility Security Industry Market
- Honeywell International Inc
- Blackberry Limited
- IBM Corporation
- McAfee LLC
- AirWatch
- Cisco Systems Inc
- Microsoft Corporation
- Oracle Corporation
- Symantec Corporation
- Citrix Systems Inc
- MobileIron
- SAP SE
Key Developments in Enterprise Mobility Security Industry Sector
October 2022: Kocho acquired Mobliciti, expanding its service offerings and strengthening its position in the enterprise mobility security market. This strategic move broadened the portfolio of services and facilitated faster digital transformations. The estimated value of $XX Million signifies the importance of this acquisition within the industry.
July 2022: CWSI's acquisition of AVR International for EUR 5.2 Million expanded its UK market presence and access to premium clients, particularly within the healthcare sector. This acquisition strengthens their portfolio and facilitates access to a wider client base.
Strategic Enterprise Mobility Security Industry Market Outlook
The Enterprise Mobility Security market shows significant promise, with strong growth anticipated across all segments. The increasing adoption of mobile devices, the growth of the cloud, and the persistent threat of cyberattacks will continue to drive market expansion. Strategic opportunities lie in developing innovative solutions that address the evolving needs of organizations, particularly in areas such as AI-powered threat detection, enhanced data privacy, and seamless integration with existing IT infrastructure. Players that can effectively adapt to these trends and deliver robust, user-friendly solutions are well-positioned to capture significant market share.
Enterprise Mobility Security Industry Segmentation
-
1. Device
- 1.1. Smartphones
- 1.2. Laptops
- 1.3. Tablets
-
2. End-User
- 2.1. Banking/Insurance
- 2.2. Healthcare
- 2.3. IT and Telecom
- 2.4. Government
- 2.5. Other End-user Industries
Enterprise Mobility Security Industry Segmentation By Geography
- 1. North America
- 2. Europe
- 3. Asia Pacific
- 4. Latin America
- 5. Middle East and Africa
Enterprise Mobility Security Industry REPORT HIGHLIGHTS
| Aspects | Details |
|---|---|
| Study Period | 2019-2033 |
| Base Year | 2024 |
| Estimated Year | 2025 |
| Forecast Period | 2025-2033 |
| Historical Period | 2019-2024 |
| Growth Rate | CAGR of 11.70% from 2019-2033 |
| Segmentation |
|
Table of Contents
- 1. Introduction
- 1.1. Research Scope
- 1.2. Market Segmentation
- 1.3. Research Methodology
- 1.4. Definitions and Assumptions
- 2. Executive Summary
- 2.1. Introduction
- 3. Market Dynamics
- 3.1. Introduction
- 3.2. Market Drivers
- 3.2.1. Industrial Internet of Things (IIoT) has Accelerated the Use-cases in the Market; Increasing Implementation of the BYOD Concept
- 3.3. Market Restrains
- 3.3.1. Security Vulnerability for Manufacturing Vendors is Discouraging the Market Growth.; Government Regulations and Infrastructure Maintenance act as Market Challenges
- 3.4. Market Trends
- 3.4.1. Banking/Insurance Industry to Hold Significant Market Share
- 4. Market Factor Analysis
- 4.1. Porters Five Forces
- 4.2. Supply/Value Chain
- 4.3. PESTEL analysis
- 4.4. Market Entropy
- 4.5. Patent/Trademark Analysis
- 5. Global Enterprise Mobility Security Industry Analysis, Insights and Forecast, 2019-2031
- 5.1. Market Analysis, Insights and Forecast - by Device
- 5.1.1. Smartphones
- 5.1.2. Laptops
- 5.1.3. Tablets
- 5.2. Market Analysis, Insights and Forecast - by End-User
- 5.2.1. Banking/Insurance
- 5.2.2. Healthcare
- 5.2.3. IT and Telecom
- 5.2.4. Government
- 5.2.5. Other End-user Industries
- 5.3. Market Analysis, Insights and Forecast - by Region
- 5.3.1. North America
- 5.3.2. Europe
- 5.3.3. Asia Pacific
- 5.3.4. Latin America
- 5.3.5. Middle East and Africa
- 5.1. Market Analysis, Insights and Forecast - by Device
- 6. North America Enterprise Mobility Security Industry Analysis, Insights and Forecast, 2019-2031
- 6.1. Market Analysis, Insights and Forecast - by Device
- 6.1.1. Smartphones
- 6.1.2. Laptops
- 6.1.3. Tablets
- 6.2. Market Analysis, Insights and Forecast - by End-User
- 6.2.1. Banking/Insurance
- 6.2.2. Healthcare
- 6.2.3. IT and Telecom
- 6.2.4. Government
- 6.2.5. Other End-user Industries
- 6.1. Market Analysis, Insights and Forecast - by Device
- 7. Europe Enterprise Mobility Security Industry Analysis, Insights and Forecast, 2019-2031
- 7.1. Market Analysis, Insights and Forecast - by Device
- 7.1.1. Smartphones
- 7.1.2. Laptops
- 7.1.3. Tablets
- 7.2. Market Analysis, Insights and Forecast - by End-User
- 7.2.1. Banking/Insurance
- 7.2.2. Healthcare
- 7.2.3. IT and Telecom
- 7.2.4. Government
- 7.2.5. Other End-user Industries
- 7.1. Market Analysis, Insights and Forecast - by Device
- 8. Asia Pacific Enterprise Mobility Security Industry Analysis, Insights and Forecast, 2019-2031
- 8.1. Market Analysis, Insights and Forecast - by Device
- 8.1.1. Smartphones
- 8.1.2. Laptops
- 8.1.3. Tablets
- 8.2. Market Analysis, Insights and Forecast - by End-User
- 8.2.1. Banking/Insurance
- 8.2.2. Healthcare
- 8.2.3. IT and Telecom
- 8.2.4. Government
- 8.2.5. Other End-user Industries
- 8.1. Market Analysis, Insights and Forecast - by Device
- 9. Latin America Enterprise Mobility Security Industry Analysis, Insights and Forecast, 2019-2031
- 9.1. Market Analysis, Insights and Forecast - by Device
- 9.1.1. Smartphones
- 9.1.2. Laptops
- 9.1.3. Tablets
- 9.2. Market Analysis, Insights and Forecast - by End-User
- 9.2.1. Banking/Insurance
- 9.2.2. Healthcare
- 9.2.3. IT and Telecom
- 9.2.4. Government
- 9.2.5. Other End-user Industries
- 9.1. Market Analysis, Insights and Forecast - by Device
- 10. Middle East and Africa Enterprise Mobility Security Industry Analysis, Insights and Forecast, 2019-2031
- 10.1. Market Analysis, Insights and Forecast - by Device
- 10.1.1. Smartphones
- 10.1.2. Laptops
- 10.1.3. Tablets
- 10.2. Market Analysis, Insights and Forecast - by End-User
- 10.2.1. Banking/Insurance
- 10.2.2. Healthcare
- 10.2.3. IT and Telecom
- 10.2.4. Government
- 10.2.5. Other End-user Industries
- 10.1. Market Analysis, Insights and Forecast - by Device
- 11. North America Enterprise Mobility Security Industry Analysis, Insights and Forecast, 2019-2031
- 11.1. Market Analysis, Insights and Forecast - By Country/Sub-region
- 11.1.1 United States
- 11.1.2 Canada
- 11.1.3 Mexico
- 12. Europe Enterprise Mobility Security Industry Analysis, Insights and Forecast, 2019-2031
- 12.1. Market Analysis, Insights and Forecast - By Country/Sub-region
- 12.1.1 Germany
- 12.1.2 United Kingdom
- 12.1.3 France
- 12.1.4 Spain
- 12.1.5 Italy
- 12.1.6 Spain
- 12.1.7 Belgium
- 12.1.8 Netherland
- 12.1.9 Nordics
- 12.1.10 Rest of Europe
- 13. Asia Pacific Enterprise Mobility Security Industry Analysis, Insights and Forecast, 2019-2031
- 13.1. Market Analysis, Insights and Forecast - By Country/Sub-region
- 13.1.1 China
- 13.1.2 Japan
- 13.1.3 India
- 13.1.4 South Korea
- 13.1.5 Southeast Asia
- 13.1.6 Australia
- 13.1.7 Indonesia
- 13.1.8 Phillipes
- 13.1.9 Singapore
- 13.1.10 Thailandc
- 13.1.11 Rest of Asia Pacific
- 14. South America Enterprise Mobility Security Industry Analysis, Insights and Forecast, 2019-2031
- 14.1. Market Analysis, Insights and Forecast - By Country/Sub-region
- 14.1.1 Brazil
- 14.1.2 Argentina
- 14.1.3 Peru
- 14.1.4 Chile
- 14.1.5 Colombia
- 14.1.6 Ecuador
- 14.1.7 Venezuela
- 14.1.8 Rest of South America
- 15. North America Enterprise Mobility Security Industry Analysis, Insights and Forecast, 2019-2031
- 15.1. Market Analysis, Insights and Forecast - By Country/Sub-region
- 15.1.1 United States
- 15.1.2 Canada
- 15.1.3 Mexico
- 16. MEA Enterprise Mobility Security Industry Analysis, Insights and Forecast, 2019-2031
- 16.1. Market Analysis, Insights and Forecast - By Country/Sub-region
- 16.1.1 United Arab Emirates
- 16.1.2 Saudi Arabia
- 16.1.3 South Africa
- 16.1.4 Rest of Middle East and Africa
- 17. Competitive Analysis
- 17.1. Global Market Share Analysis 2024
- 17.2. Company Profiles
- 17.2.1 Honeywell International Inc
- 17.2.1.1. Overview
- 17.2.1.2. Products
- 17.2.1.3. SWOT Analysis
- 17.2.1.4. Recent Developments
- 17.2.1.5. Financials (Based on Availability)
- 17.2.2 Blackberry Limited
- 17.2.2.1. Overview
- 17.2.2.2. Products
- 17.2.2.3. SWOT Analysis
- 17.2.2.4. Recent Developments
- 17.2.2.5. Financials (Based on Availability)
- 17.2.3 IBM Corporation
- 17.2.3.1. Overview
- 17.2.3.2. Products
- 17.2.3.3. SWOT Analysis
- 17.2.3.4. Recent Developments
- 17.2.3.5. Financials (Based on Availability)
- 17.2.4 McAfee LLC
- 17.2.4.1. Overview
- 17.2.4.2. Products
- 17.2.4.3. SWOT Analysis
- 17.2.4.4. Recent Developments
- 17.2.4.5. Financials (Based on Availability)
- 17.2.5 AirWatch
- 17.2.5.1. Overview
- 17.2.5.2. Products
- 17.2.5.3. SWOT Analysis
- 17.2.5.4. Recent Developments
- 17.2.5.5. Financials (Based on Availability)
- 17.2.6 Cisco Systems Inc
- 17.2.6.1. Overview
- 17.2.6.2. Products
- 17.2.6.3. SWOT Analysis
- 17.2.6.4. Recent Developments
- 17.2.6.5. Financials (Based on Availability)
- 17.2.7 Microsoft Corporation
- 17.2.7.1. Overview
- 17.2.7.2. Products
- 17.2.7.3. SWOT Analysis
- 17.2.7.4. Recent Developments
- 17.2.7.5. Financials (Based on Availability)
- 17.2.8 Oracle Corporation
- 17.2.8.1. Overview
- 17.2.8.2. Products
- 17.2.8.3. SWOT Analysis
- 17.2.8.4. Recent Developments
- 17.2.8.5. Financials (Based on Availability)
- 17.2.9 Symantec Corporation
- 17.2.9.1. Overview
- 17.2.9.2. Products
- 17.2.9.3. SWOT Analysis
- 17.2.9.4. Recent Developments
- 17.2.9.5. Financials (Based on Availability)
- 17.2.10 Citrix Systems Inc
- 17.2.10.1. Overview
- 17.2.10.2. Products
- 17.2.10.3. SWOT Analysis
- 17.2.10.4. Recent Developments
- 17.2.10.5. Financials (Based on Availability)
- 17.2.11 MobileIron
- 17.2.11.1. Overview
- 17.2.11.2. Products
- 17.2.11.3. SWOT Analysis
- 17.2.11.4. Recent Developments
- 17.2.11.5. Financials (Based on Availability)
- 17.2.12 SAP SE
- 17.2.12.1. Overview
- 17.2.12.2. Products
- 17.2.12.3. SWOT Analysis
- 17.2.12.4. Recent Developments
- 17.2.12.5. Financials (Based on Availability)
- 17.2.1 Honeywell International Inc
List of Figures
- Figure 1: Global Enterprise Mobility Security Industry Revenue Breakdown (Million, %) by Region 2024 & 2032
- Figure 2: North America Enterprise Mobility Security Industry Revenue (Million), by Country 2024 & 2032
- Figure 3: North America Enterprise Mobility Security Industry Revenue Share (%), by Country 2024 & 2032
- Figure 4: Europe Enterprise Mobility Security Industry Revenue (Million), by Country 2024 & 2032
- Figure 5: Europe Enterprise Mobility Security Industry Revenue Share (%), by Country 2024 & 2032
- Figure 6: Asia Pacific Enterprise Mobility Security Industry Revenue (Million), by Country 2024 & 2032
- Figure 7: Asia Pacific Enterprise Mobility Security Industry Revenue Share (%), by Country 2024 & 2032
- Figure 8: South America Enterprise Mobility Security Industry Revenue (Million), by Country 2024 & 2032
- Figure 9: South America Enterprise Mobility Security Industry Revenue Share (%), by Country 2024 & 2032
- Figure 10: North America Enterprise Mobility Security Industry Revenue (Million), by Country 2024 & 2032
- Figure 11: North America Enterprise Mobility Security Industry Revenue Share (%), by Country 2024 & 2032
- Figure 12: MEA Enterprise Mobility Security Industry Revenue (Million), by Country 2024 & 2032
- Figure 13: MEA Enterprise Mobility Security Industry Revenue Share (%), by Country 2024 & 2032
- Figure 14: North America Enterprise Mobility Security Industry Revenue (Million), by Device 2024 & 2032
- Figure 15: North America Enterprise Mobility Security Industry Revenue Share (%), by Device 2024 & 2032
- Figure 16: North America Enterprise Mobility Security Industry Revenue (Million), by End-User 2024 & 2032
- Figure 17: North America Enterprise Mobility Security Industry Revenue Share (%), by End-User 2024 & 2032
- Figure 18: North America Enterprise Mobility Security Industry Revenue (Million), by Country 2024 & 2032
- Figure 19: North America Enterprise Mobility Security Industry Revenue Share (%), by Country 2024 & 2032
- Figure 20: Europe Enterprise Mobility Security Industry Revenue (Million), by Device 2024 & 2032
- Figure 21: Europe Enterprise Mobility Security Industry Revenue Share (%), by Device 2024 & 2032
- Figure 22: Europe Enterprise Mobility Security Industry Revenue (Million), by End-User 2024 & 2032
- Figure 23: Europe Enterprise Mobility Security Industry Revenue Share (%), by End-User 2024 & 2032
- Figure 24: Europe Enterprise Mobility Security Industry Revenue (Million), by Country 2024 & 2032
- Figure 25: Europe Enterprise Mobility Security Industry Revenue Share (%), by Country 2024 & 2032
- Figure 26: Asia Pacific Enterprise Mobility Security Industry Revenue (Million), by Device 2024 & 2032
- Figure 27: Asia Pacific Enterprise Mobility Security Industry Revenue Share (%), by Device 2024 & 2032
- Figure 28: Asia Pacific Enterprise Mobility Security Industry Revenue (Million), by End-User 2024 & 2032
- Figure 29: Asia Pacific Enterprise Mobility Security Industry Revenue Share (%), by End-User 2024 & 2032
- Figure 30: Asia Pacific Enterprise Mobility Security Industry Revenue (Million), by Country 2024 & 2032
- Figure 31: Asia Pacific Enterprise Mobility Security Industry Revenue Share (%), by Country 2024 & 2032
- Figure 32: Latin America Enterprise Mobility Security Industry Revenue (Million), by Device 2024 & 2032
- Figure 33: Latin America Enterprise Mobility Security Industry Revenue Share (%), by Device 2024 & 2032
- Figure 34: Latin America Enterprise Mobility Security Industry Revenue (Million), by End-User 2024 & 2032
- Figure 35: Latin America Enterprise Mobility Security Industry Revenue Share (%), by End-User 2024 & 2032
- Figure 36: Latin America Enterprise Mobility Security Industry Revenue (Million), by Country 2024 & 2032
- Figure 37: Latin America Enterprise Mobility Security Industry Revenue Share (%), by Country 2024 & 2032
- Figure 38: Middle East and Africa Enterprise Mobility Security Industry Revenue (Million), by Device 2024 & 2032
- Figure 39: Middle East and Africa Enterprise Mobility Security Industry Revenue Share (%), by Device 2024 & 2032
- Figure 40: Middle East and Africa Enterprise Mobility Security Industry Revenue (Million), by End-User 2024 & 2032
- Figure 41: Middle East and Africa Enterprise Mobility Security Industry Revenue Share (%), by End-User 2024 & 2032
- Figure 42: Middle East and Africa Enterprise Mobility Security Industry Revenue (Million), by Country 2024 & 2032
- Figure 43: Middle East and Africa Enterprise Mobility Security Industry Revenue Share (%), by Country 2024 & 2032
List of Tables
- Table 1: Global Enterprise Mobility Security Industry Revenue Million Forecast, by Region 2019 & 2032
- Table 2: Global Enterprise Mobility Security Industry Revenue Million Forecast, by Device 2019 & 2032
- Table 3: Global Enterprise Mobility Security Industry Revenue Million Forecast, by End-User 2019 & 2032
- Table 4: Global Enterprise Mobility Security Industry Revenue Million Forecast, by Region 2019 & 2032
- Table 5: Global Enterprise Mobility Security Industry Revenue Million Forecast, by Country 2019 & 2032
- Table 6: United States Enterprise Mobility Security Industry Revenue (Million) Forecast, by Application 2019 & 2032
- Table 7: Canada Enterprise Mobility Security Industry Revenue (Million) Forecast, by Application 2019 & 2032
- Table 8: Mexico Enterprise Mobility Security Industry Revenue (Million) Forecast, by Application 2019 & 2032
- Table 9: Global Enterprise Mobility Security Industry Revenue Million Forecast, by Country 2019 & 2032
- Table 10: Germany Enterprise Mobility Security Industry Revenue (Million) Forecast, by Application 2019 & 2032
- Table 11: United Kingdom Enterprise Mobility Security Industry Revenue (Million) Forecast, by Application 2019 & 2032
- Table 12: France Enterprise Mobility Security Industry Revenue (Million) Forecast, by Application 2019 & 2032
- Table 13: Spain Enterprise Mobility Security Industry Revenue (Million) Forecast, by Application 2019 & 2032
- Table 14: Italy Enterprise Mobility Security Industry Revenue (Million) Forecast, by Application 2019 & 2032
- Table 15: Spain Enterprise Mobility Security Industry Revenue (Million) Forecast, by Application 2019 & 2032
- Table 16: Belgium Enterprise Mobility Security Industry Revenue (Million) Forecast, by Application 2019 & 2032
- Table 17: Netherland Enterprise Mobility Security Industry Revenue (Million) Forecast, by Application 2019 & 2032
- Table 18: Nordics Enterprise Mobility Security Industry Revenue (Million) Forecast, by Application 2019 & 2032
- Table 19: Rest of Europe Enterprise Mobility Security Industry Revenue (Million) Forecast, by Application 2019 & 2032
- Table 20: Global Enterprise Mobility Security Industry Revenue Million Forecast, by Country 2019 & 2032
- Table 21: China Enterprise Mobility Security Industry Revenue (Million) Forecast, by Application 2019 & 2032
- Table 22: Japan Enterprise Mobility Security Industry Revenue (Million) Forecast, by Application 2019 & 2032
- Table 23: India Enterprise Mobility Security Industry Revenue (Million) Forecast, by Application 2019 & 2032
- Table 24: South Korea Enterprise Mobility Security Industry Revenue (Million) Forecast, by Application 2019 & 2032
- Table 25: Southeast Asia Enterprise Mobility Security Industry Revenue (Million) Forecast, by Application 2019 & 2032
- Table 26: Australia Enterprise Mobility Security Industry Revenue (Million) Forecast, by Application 2019 & 2032
- Table 27: Indonesia Enterprise Mobility Security Industry Revenue (Million) Forecast, by Application 2019 & 2032
- Table 28: Phillipes Enterprise Mobility Security Industry Revenue (Million) Forecast, by Application 2019 & 2032
- Table 29: Singapore Enterprise Mobility Security Industry Revenue (Million) Forecast, by Application 2019 & 2032
- Table 30: Thailandc Enterprise Mobility Security Industry Revenue (Million) Forecast, by Application 2019 & 2032
- Table 31: Rest of Asia Pacific Enterprise Mobility Security Industry Revenue (Million) Forecast, by Application 2019 & 2032
- Table 32: Global Enterprise Mobility Security Industry Revenue Million Forecast, by Country 2019 & 2032
- Table 33: Brazil Enterprise Mobility Security Industry Revenue (Million) Forecast, by Application 2019 & 2032
- Table 34: Argentina Enterprise Mobility Security Industry Revenue (Million) Forecast, by Application 2019 & 2032
- Table 35: Peru Enterprise Mobility Security Industry Revenue (Million) Forecast, by Application 2019 & 2032
- Table 36: Chile Enterprise Mobility Security Industry Revenue (Million) Forecast, by Application 2019 & 2032
- Table 37: Colombia Enterprise Mobility Security Industry Revenue (Million) Forecast, by Application 2019 & 2032
- Table 38: Ecuador Enterprise Mobility Security Industry Revenue (Million) Forecast, by Application 2019 & 2032
- Table 39: Venezuela Enterprise Mobility Security Industry Revenue (Million) Forecast, by Application 2019 & 2032
- Table 40: Rest of South America Enterprise Mobility Security Industry Revenue (Million) Forecast, by Application 2019 & 2032
- Table 41: Global Enterprise Mobility Security Industry Revenue Million Forecast, by Country 2019 & 2032
- Table 42: United States Enterprise Mobility Security Industry Revenue (Million) Forecast, by Application 2019 & 2032
- Table 43: Canada Enterprise Mobility Security Industry Revenue (Million) Forecast, by Application 2019 & 2032
- Table 44: Mexico Enterprise Mobility Security Industry Revenue (Million) Forecast, by Application 2019 & 2032
- Table 45: Global Enterprise Mobility Security Industry Revenue Million Forecast, by Country 2019 & 2032
- Table 46: United Arab Emirates Enterprise Mobility Security Industry Revenue (Million) Forecast, by Application 2019 & 2032
- Table 47: Saudi Arabia Enterprise Mobility Security Industry Revenue (Million) Forecast, by Application 2019 & 2032
- Table 48: South Africa Enterprise Mobility Security Industry Revenue (Million) Forecast, by Application 2019 & 2032
- Table 49: Rest of Middle East and Africa Enterprise Mobility Security Industry Revenue (Million) Forecast, by Application 2019 & 2032
- Table 50: Global Enterprise Mobility Security Industry Revenue Million Forecast, by Device 2019 & 2032
- Table 51: Global Enterprise Mobility Security Industry Revenue Million Forecast, by End-User 2019 & 2032
- Table 52: Global Enterprise Mobility Security Industry Revenue Million Forecast, by Country 2019 & 2032
- Table 53: Global Enterprise Mobility Security Industry Revenue Million Forecast, by Device 2019 & 2032
- Table 54: Global Enterprise Mobility Security Industry Revenue Million Forecast, by End-User 2019 & 2032
- Table 55: Global Enterprise Mobility Security Industry Revenue Million Forecast, by Country 2019 & 2032
- Table 56: Global Enterprise Mobility Security Industry Revenue Million Forecast, by Device 2019 & 2032
- Table 57: Global Enterprise Mobility Security Industry Revenue Million Forecast, by End-User 2019 & 2032
- Table 58: Global Enterprise Mobility Security Industry Revenue Million Forecast, by Country 2019 & 2032
- Table 59: Global Enterprise Mobility Security Industry Revenue Million Forecast, by Device 2019 & 2032
- Table 60: Global Enterprise Mobility Security Industry Revenue Million Forecast, by End-User 2019 & 2032
- Table 61: Global Enterprise Mobility Security Industry Revenue Million Forecast, by Country 2019 & 2032
- Table 62: Global Enterprise Mobility Security Industry Revenue Million Forecast, by Device 2019 & 2032
- Table 63: Global Enterprise Mobility Security Industry Revenue Million Forecast, by End-User 2019 & 2032
- Table 64: Global Enterprise Mobility Security Industry Revenue Million Forecast, by Country 2019 & 2032
Frequently Asked Questions
1. What is the projected Compound Annual Growth Rate (CAGR) of the Enterprise Mobility Security Industry?
The projected CAGR is approximately 11.70%.
2. Which companies are prominent players in the Enterprise Mobility Security Industry?
Key companies in the market include Honeywell International Inc, Blackberry Limited, IBM Corporation, McAfee LLC, AirWatch, Cisco Systems Inc, Microsoft Corporation, Oracle Corporation, Symantec Corporation, Citrix Systems Inc, MobileIron, SAP SE.
3. What are the main segments of the Enterprise Mobility Security Industry?
The market segments include Device, End-User.
4. Can you provide details about the market size?
The market size is estimated to be USD 1.21 Million as of 2022.
5. What are some drivers contributing to market growth?
Industrial Internet of Things (IIoT) has Accelerated the Use-cases in the Market; Increasing Implementation of the BYOD Concept.
6. What are the notable trends driving market growth?
Banking/Insurance Industry to Hold Significant Market Share.
7. Are there any restraints impacting market growth?
Security Vulnerability for Manufacturing Vendors is Discouraging the Market Growth.; Government Regulations and Infrastructure Maintenance act as Market Challenges.
8. Can you provide examples of recent developments in the market?
October 2022: Mobliciti provides enterprise mobility, security, and wireless connectivity solutions. Kocho, a UK-based provider of managed services in cyber security, identity management, and cloud transition, acquired Mobliciti. By incorporating strategic mobile management and security capabilities, the partnership would enable Kocho's service offering and customers of both businesses to access a comprehensive lineup to accelerate the pace of their digital transformation activities.
9. What pricing options are available for accessing the report?
Pricing options include single-user, multi-user, and enterprise licenses priced at USD 4750, USD 5250, and USD 8750 respectively.
10. Is the market size provided in terms of value or volume?
The market size is provided in terms of value, measured in Million.
11. Are there any specific market keywords associated with the report?
Yes, the market keyword associated with the report is "Enterprise Mobility Security Industry," which aids in identifying and referencing the specific market segment covered.
12. How do I determine which pricing option suits my needs best?
The pricing options vary based on user requirements and access needs. Individual users may opt for single-user licenses, while businesses requiring broader access may choose multi-user or enterprise licenses for cost-effective access to the report.
13. Are there any additional resources or data provided in the Enterprise Mobility Security Industry report?
While the report offers comprehensive insights, it's advisable to review the specific contents or supplementary materials provided to ascertain if additional resources or data are available.
14. How can I stay updated on further developments or reports in the Enterprise Mobility Security Industry?
To stay informed about further developments, trends, and reports in the Enterprise Mobility Security Industry, consider subscribing to industry newsletters, following relevant companies and organizations, or regularly checking reputable industry news sources and publications.
Methodology
Step 1 - Identification of Relevant Samples Size from Population Database


Step 2 - Approaches for Defining Global Market Size (Value, Volume* & Price*)

Note*: In applicable scenarios
Step 3 - Data Sources
Primary Research
- Web Analytics
- Survey Reports
- Research Institute
- Latest Research Reports
- Opinion Leaders
Secondary Research
- Annual Reports
- White Paper
- Latest Press Release
- Industry Association
- Paid Database
- Investor Presentations

Step 4 - Data Triangulation
Involves using different sources of information in order to increase the validity of a study
These sources are likely to be stakeholders in a program - participants, other researchers, program staff, other community members, and so on.
Then we put all data in single framework & apply various statistical tools to find out the dynamic on the market.
During the analysis stage, feedback from the stakeholder groups would be compared to determine areas of agreement as well as areas of divergence


