
Key Insights
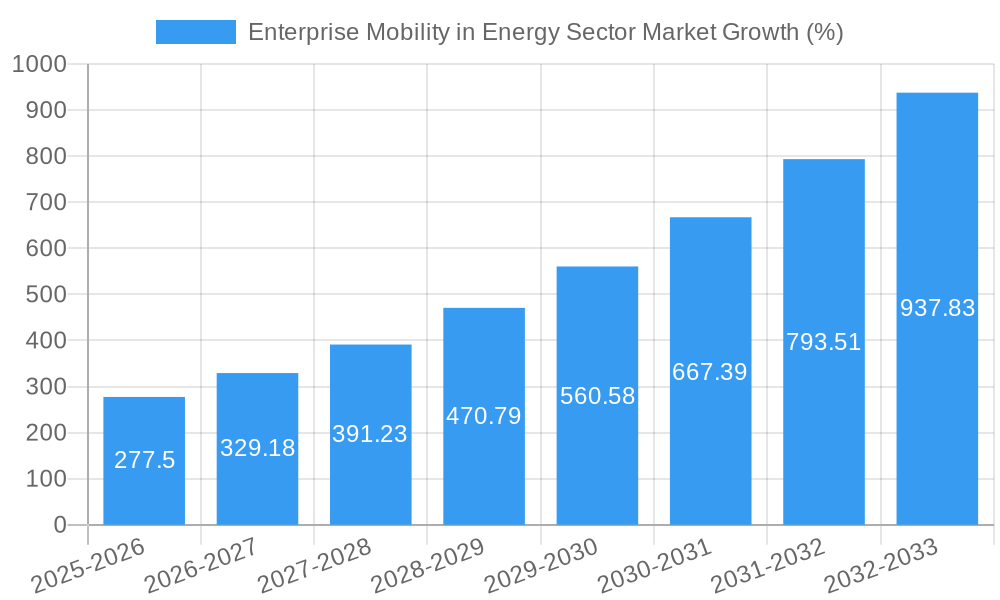
The Enterprise Mobility in Energy Sector market is experiencing robust growth, fueled by a burgeoning need for enhanced operational efficiency, improved worker safety, and real-time data accessibility across geographically dispersed energy assets. The market's Compound Annual Growth Rate (CAGR) of 18.50% from 2019 to 2024 suggests a significant expansion, projected to continue into the forecast period (2025-2033). Key drivers include the increasing adoption of cloud-based solutions for data management and analysis, the rising integration of Internet of Things (IoT) devices for remote monitoring and control of energy infrastructure, and a growing emphasis on digital transformation initiatives within the energy sector. The market is segmented by device (smartphones, laptops, tablets) and deployment (on-premise, cloud), with cloud-based solutions gaining significant traction due to their scalability, cost-effectiveness, and accessibility. Leading companies like Tech Mahindra, TCS, and Microsoft are heavily investing in developing and deploying enterprise mobility solutions tailored to the specific needs of the energy industry, further accelerating market growth. Geographic growth is expected to be robust across North America and Asia Pacific, driven by substantial investments in renewable energy and smart grids. While challenges such as cybersecurity concerns and the need for robust network infrastructure exist, the overall market outlook remains positive, indicating significant growth opportunities for technology providers and energy companies alike.
The significant market expansion is largely due to the energy sector's increasing reliance on data-driven decision-making. Real-time insights from remote locations, facilitated by enterprise mobility solutions, are crucial for optimizing production, reducing downtime, and enhancing safety protocols. The shift towards renewable energy sources also necessitates improved monitoring and management of distributed energy assets, further driving demand for effective mobility solutions. The increasing sophistication of these solutions, incorporating advanced analytics and artificial intelligence, adds another layer to their value proposition. Competitive pressures are likely to increase as more technology vendors enter the market, leading to innovation in pricing and service offerings. The convergence of mobile technologies with other emerging technologies like blockchain and augmented reality will further shape the future of enterprise mobility in the energy sector. The integration of these technologies offers considerable potential for enhancing security, transparency, and efficiency across the energy value chain.
Enterprise Mobility in Energy Sector Market: A Comprehensive Report (2019-2033)
This comprehensive report provides an in-depth analysis of the Enterprise Mobility in Energy Sector Market, offering valuable insights for businesses, investors, and stakeholders seeking to navigate this dynamic landscape. The study covers the period 2019-2033, with a focus on the estimated year 2025 and a forecast period spanning 2025-2033. The market is expected to reach xx Million by 2033, exhibiting a CAGR of xx% during the forecast period. This report leverages rigorous research methodologies and incorporates data from a variety of sources to present a clear and actionable understanding of market trends, opportunities, and challenges.
Enterprise Mobility in Energy Sector Market Structure & Competitive Dynamics
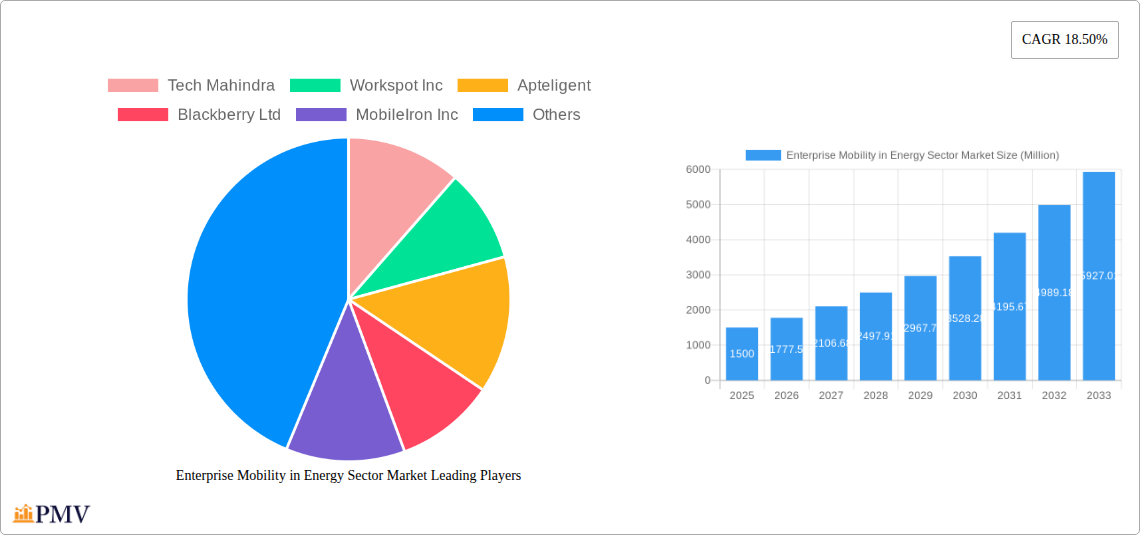
The Enterprise Mobility in Energy Sector Market is characterized by a moderately concentrated landscape, with key players such as Tech Mahindra, Workspot Inc, Apteligent, Blackberry Ltd, MobileIron Inc, TCS Private Limited, McAfee Inc, Cisco Systems Inc, Microsoft Corporation, Tylr Mobile Inc, Oracle Corporation, VMware Inc, Broadcom Inc (Symantec Corporation), Citrix Systems Inc, and SAP SE vying for market share. Market concentration is measured by the Herfindahl-Hirschman Index (HHI) at xx, indicating a moderately competitive environment. Innovation within the ecosystem is driven by advancements in 5G technology, cloud computing, and AI-powered security solutions. Regulatory frameworks, particularly those related to data privacy and cybersecurity, significantly impact market operations. Product substitutes, such as traditional on-premise solutions, face increasing competition from cloud-based alternatives. End-user trends favor flexible, scalable, and secure mobility solutions tailored to the specific needs of the energy sector. M&A activity has been significant, with deal values exceeding xx Million in the past five years, primarily driven by the consolidation of smaller players and the expansion of existing market leaders. The top three companies hold an estimated xx% of the market share collectively.
Enterprise Mobility in Energy Sector Market Industry Trends & Insights
The Enterprise Mobility in Energy Sector Market is experiencing robust growth, driven by the increasing adoption of mobile technologies across all segments of the energy industry. Factors such as the need for improved operational efficiency, enhanced workforce productivity, and real-time data access are key growth drivers. The market's growth is further fueled by technological disruptions, such as the proliferation of IoT devices, the increasing adoption of cloud-based solutions, and the advancement of robust cybersecurity measures designed for mobile environments. Consumer preferences are shifting towards user-friendly, secure, and integrated mobility solutions that seamlessly connect field operations with centralized management systems. The competitive dynamics are shaping the market with vendors focusing on providing innovative solutions, strengthening partnerships, and expanding their geographical reach to gain a competitive edge. The market penetration rate for enterprise mobility solutions in the energy sector is currently estimated at xx%, projected to reach xx% by 2033. The CAGR for the period 2025-2033 is estimated to be xx%.
Dominant Markets & Segments in Enterprise Mobility in Energy Sector Market
By Device: Smartphones hold the largest market share due to their portability and ease of use in field operations. Tablets are also gaining traction for their larger screen size and suitability for data visualization. Laptops remain crucial for more complex tasks requiring robust computing power.
By Deployment: The cloud deployment model is experiencing significant growth, driven by scalability, cost-effectiveness, and ease of management. On-premise deployments are still prevalent in some segments, particularly those with stringent security requirements.
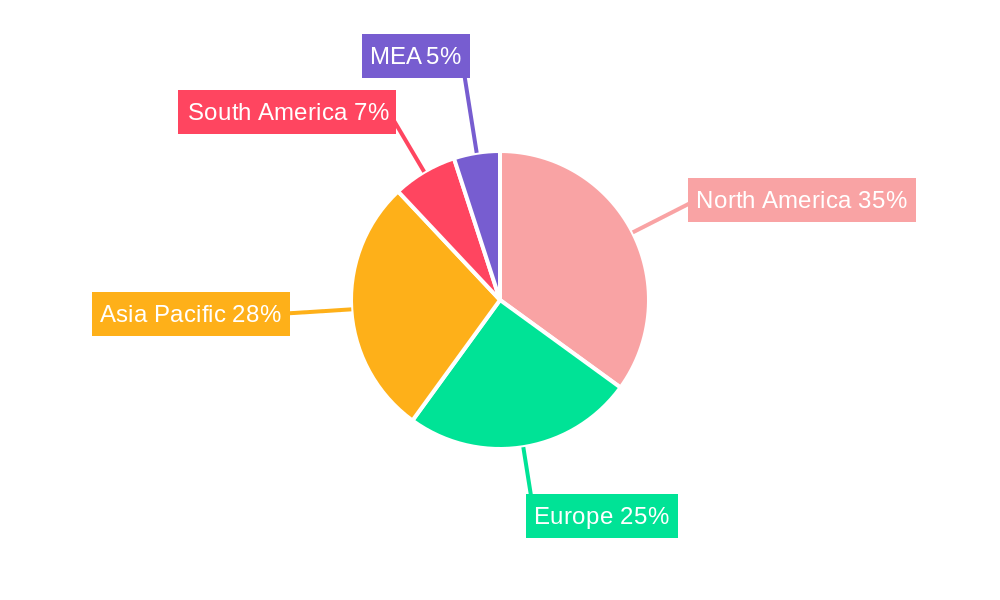
North America currently dominates the Enterprise Mobility in Energy Sector Market, driven by the high adoption rate of mobile technologies in the energy sector and supportive government policies. Key drivers for this dominance include: robust digital infrastructure, significant investments in R&D, and a large concentration of major energy companies. Europe is a rapidly growing market, fuelled by increasing investments in renewable energy sources and the rising need for optimized grid management. The Asia-Pacific region is poised for significant growth, driven by economic development, and increasing adoption of smart technologies across various sectors, including energy.
Enterprise Mobility in Energy Sector Market Product Innovations
Recent product innovations focus on enhancing security features, improving data analytics capabilities, and integrating with other enterprise solutions. This includes the development of advanced security protocols, AI-powered threat detection systems, and real-time data visualization dashboards. The focus on enhanced user experience through intuitive interfaces and streamlined workflows is also evident. This drives market fit by addressing the specific needs and challenges faced by the energy industry, such as ensuring worker safety, optimizing resource allocation, and reducing operational costs.
Report Segmentation & Scope
This report segments the Enterprise Mobility in Energy Sector Market by device type (Smartphones, Laptops, Tablets) and deployment model (On-Premise, Cloud). Each segment is analyzed based on its growth potential, market size, and competitive landscape. The Smartphone segment exhibits high growth, fueled by increasing demand for mobile-first solutions among energy sector professionals. The Laptop segment is characterized by steady growth driven by the need for robust computing power for specialized tasks. The Tablet segment shows moderate growth, reflecting its suitability for specific applications like data visualization and field monitoring. The Cloud deployment model shows the highest growth rate, driven by its scalability, flexibility, and cost-effectiveness. On-premise deployment remains relevant in niche applications demanding stringent security control.
Key Drivers of Enterprise Mobility in Energy Sector Market Growth
The growth of the Enterprise Mobility in Energy Sector Market is propelled by several key factors. Technological advancements, specifically in 5G connectivity, IoT, and cloud computing, are significantly enhancing the capabilities of mobile solutions. Economic factors, including the need for cost optimization and improved operational efficiency, drive the adoption of these technologies. Furthermore, supportive regulatory frameworks promoting digital transformation within the energy sector accelerate market growth. Examples include government incentives for smart grid initiatives and investments in infrastructure development.
Challenges in the Enterprise Mobility in Energy Sector Market Sector
Significant challenges hinder the growth of the Enterprise Mobility in Energy Sector Market. Regulatory hurdles related to data privacy and cybersecurity pose significant compliance burdens for organizations. Supply chain disruptions, particularly those related to the availability of critical components, can affect the timely deployment of mobile solutions. Intense competitive pressures, with numerous players vying for market share, can lead to price wars and reduced profitability. These factors collectively limit market expansion and pose risks to industry stakeholders.
Leading Players in the Enterprise Mobility in Energy Sector Market Market
- Tech Mahindra
- Workspot Inc
- Apteligent
- Blackberry Ltd
- MobileIron Inc
- TCS Private Limited
- McAfee Inc
- Cisco Systems Inc
- Microsoft Corporation
- Tylr Mobile Inc
- Oracle Corporation
- VMware Inc
- Broadcom Inc (Symantec Corporation)
- Citrix Systems Inc
- SAP SE
Key Developments in Enterprise Mobility in Energy Sector Market Sector
- January 2023: Microsoft announced a new suite of mobile security solutions for the energy sector.
- June 2022: Tech Mahindra partnered with a leading energy company to implement a large-scale mobile workforce management system.
- October 2021: Cisco launched a new IoT platform optimized for energy sector applications.
- March 2020: VMware introduced enhanced security features for its cloud-based mobility solutions.
Strategic Enterprise Mobility in Energy Sector Market Outlook
The Enterprise Mobility in Energy Sector Market holds significant future potential, driven by continued technological innovation and the increasing demand for improved operational efficiency in the energy industry. Strategic opportunities exist for companies that can effectively address the challenges related to security, scalability, and interoperability. Focus on delivering tailored solutions that meet the specific needs of diverse energy sub-sectors, such as oil & gas, renewables, and utilities, will be crucial for success. Investing in research and development to stay ahead of technological advancements and fostering strong partnerships will be essential for capturing a substantial share of this expanding market.
Enterprise Mobility in Energy Sector Market Segmentation
-
1. Device
- 1.1. Smartphones
- 1.2. Laptops
- 1.3. Tablets
-
2. Deployment
- 2.1. On-Premise
- 2.2. Cloud
Enterprise Mobility in Energy Sector Market Segmentation By Geography
- 1. North America
- 2. Europe
- 3. Asia Pacific
- 4. Latin America
- 5. Middle East
Enterprise Mobility in Energy Sector Market REPORT HIGHLIGHTS
| Aspects | Details |
|---|---|
| Study Period | 2019-2033 |
| Base Year | 2024 |
| Estimated Year | 2025 |
| Forecast Period | 2025-2033 |
| Historical Period | 2019-2024 |
| Growth Rate | CAGR of 18.50% from 2019-2033 |
| Segmentation |
|
Table of Contents
- 1. Introduction
- 1.1. Research Scope
- 1.2. Market Segmentation
- 1.3. Research Methodology
- 1.4. Definitions and Assumptions
- 2. Executive Summary
- 2.1. Introduction
- 3. Market Dynamics
- 3.1. Introduction
- 3.2. Market Drivers
- 3.2.1. ; Advancements in Energy Revolution is the Major Driving Factor
- 3.3. Market Restrains
- 3.3.1. ; Security Vulnerability is the Major Discouraging Factor
- 3.4. Market Trends
- 3.4.1. Smartphones to Dominate the Market
- 4. Market Factor Analysis
- 4.1. Porters Five Forces
- 4.2. Supply/Value Chain
- 4.3. PESTEL analysis
- 4.4. Market Entropy
- 4.5. Patent/Trademark Analysis
- 5. Global Enterprise Mobility in Energy Sector Market Analysis, Insights and Forecast, 2019-2031
- 5.1. Market Analysis, Insights and Forecast - by Device
- 5.1.1. Smartphones
- 5.1.2. Laptops
- 5.1.3. Tablets
- 5.2. Market Analysis, Insights and Forecast - by Deployment
- 5.2.1. On-Premise
- 5.2.2. Cloud
- 5.3. Market Analysis, Insights and Forecast - by Region
- 5.3.1. North America
- 5.3.2. Europe
- 5.3.3. Asia Pacific
- 5.3.4. Latin America
- 5.3.5. Middle East
- 5.1. Market Analysis, Insights and Forecast - by Device
- 6. North America Enterprise Mobility in Energy Sector Market Analysis, Insights and Forecast, 2019-2031
- 6.1. Market Analysis, Insights and Forecast - by Device
- 6.1.1. Smartphones
- 6.1.2. Laptops
- 6.1.3. Tablets
- 6.2. Market Analysis, Insights and Forecast - by Deployment
- 6.2.1. On-Premise
- 6.2.2. Cloud
- 6.1. Market Analysis, Insights and Forecast - by Device
- 7. Europe Enterprise Mobility in Energy Sector Market Analysis, Insights and Forecast, 2019-2031
- 7.1. Market Analysis, Insights and Forecast - by Device
- 7.1.1. Smartphones
- 7.1.2. Laptops
- 7.1.3. Tablets
- 7.2. Market Analysis, Insights and Forecast - by Deployment
- 7.2.1. On-Premise
- 7.2.2. Cloud
- 7.1. Market Analysis, Insights and Forecast - by Device
- 8. Asia Pacific Enterprise Mobility in Energy Sector Market Analysis, Insights and Forecast, 2019-2031
- 8.1. Market Analysis, Insights and Forecast - by Device
- 8.1.1. Smartphones
- 8.1.2. Laptops
- 8.1.3. Tablets
- 8.2. Market Analysis, Insights and Forecast - by Deployment
- 8.2.1. On-Premise
- 8.2.2. Cloud
- 8.1. Market Analysis, Insights and Forecast - by Device
- 9. Latin America Enterprise Mobility in Energy Sector Market Analysis, Insights and Forecast, 2019-2031
- 9.1. Market Analysis, Insights and Forecast - by Device
- 9.1.1. Smartphones
- 9.1.2. Laptops
- 9.1.3. Tablets
- 9.2. Market Analysis, Insights and Forecast - by Deployment
- 9.2.1. On-Premise
- 9.2.2. Cloud
- 9.1. Market Analysis, Insights and Forecast - by Device
- 10. Middle East Enterprise Mobility in Energy Sector Market Analysis, Insights and Forecast, 2019-2031
- 10.1. Market Analysis, Insights and Forecast - by Device
- 10.1.1. Smartphones
- 10.1.2. Laptops
- 10.1.3. Tablets
- 10.2. Market Analysis, Insights and Forecast - by Deployment
- 10.2.1. On-Premise
- 10.2.2. Cloud
- 10.1. Market Analysis, Insights and Forecast - by Device
- 11. North America Enterprise Mobility in Energy Sector Market Analysis, Insights and Forecast, 2019-2031
- 11.1. Market Analysis, Insights and Forecast - By Country/Sub-region
- 11.1.1 United States
- 11.1.2 Canada
- 11.1.3 Mexico
- 12. Europe Enterprise Mobility in Energy Sector Market Analysis, Insights and Forecast, 2019-2031
- 12.1. Market Analysis, Insights and Forecast - By Country/Sub-region
- 12.1.1 Germany
- 12.1.2 United Kingdom
- 12.1.3 France
- 12.1.4 Spain
- 12.1.5 Italy
- 12.1.6 Spain
- 12.1.7 Belgium
- 12.1.8 Netherland
- 12.1.9 Nordics
- 12.1.10 Rest of Europe
- 13. Asia Pacific Enterprise Mobility in Energy Sector Market Analysis, Insights and Forecast, 2019-2031
- 13.1. Market Analysis, Insights and Forecast - By Country/Sub-region
- 13.1.1 China
- 13.1.2 Japan
- 13.1.3 India
- 13.1.4 South Korea
- 13.1.5 Southeast Asia
- 13.1.6 Australia
- 13.1.7 Indonesia
- 13.1.8 Phillipes
- 13.1.9 Singapore
- 13.1.10 Thailandc
- 13.1.11 Rest of Asia Pacific
- 14. South America Enterprise Mobility in Energy Sector Market Analysis, Insights and Forecast, 2019-2031
- 14.1. Market Analysis, Insights and Forecast - By Country/Sub-region
- 14.1.1 Brazil
- 14.1.2 Argentina
- 14.1.3 Peru
- 14.1.4 Chile
- 14.1.5 Colombia
- 14.1.6 Ecuador
- 14.1.7 Venezuela
- 14.1.8 Rest of South America
- 15. North America Enterprise Mobility in Energy Sector Market Analysis, Insights and Forecast, 2019-2031
- 15.1. Market Analysis, Insights and Forecast - By Country/Sub-region
- 15.1.1 United States
- 15.1.2 Canada
- 15.1.3 Mexico
- 16. MEA Enterprise Mobility in Energy Sector Market Analysis, Insights and Forecast, 2019-2031
- 16.1. Market Analysis, Insights and Forecast - By Country/Sub-region
- 16.1.1 United Arab Emirates
- 16.1.2 Saudi Arabia
- 16.1.3 South Africa
- 16.1.4 Rest of Middle East and Africa
- 17. Competitive Analysis
- 17.1. Global Market Share Analysis 2024
- 17.2. Company Profiles
- 17.2.1 Tech Mahindra
- 17.2.1.1. Overview
- 17.2.1.2. Products
- 17.2.1.3. SWOT Analysis
- 17.2.1.4. Recent Developments
- 17.2.1.5. Financials (Based on Availability)
- 17.2.2 Workspot Inc
- 17.2.2.1. Overview
- 17.2.2.2. Products
- 17.2.2.3. SWOT Analysis
- 17.2.2.4. Recent Developments
- 17.2.2.5. Financials (Based on Availability)
- 17.2.3 Apteligent
- 17.2.3.1. Overview
- 17.2.3.2. Products
- 17.2.3.3. SWOT Analysis
- 17.2.3.4. Recent Developments
- 17.2.3.5. Financials (Based on Availability)
- 17.2.4 Blackberry Ltd
- 17.2.4.1. Overview
- 17.2.4.2. Products
- 17.2.4.3. SWOT Analysis
- 17.2.4.4. Recent Developments
- 17.2.4.5. Financials (Based on Availability)
- 17.2.5 MobileIron Inc
- 17.2.5.1. Overview
- 17.2.5.2. Products
- 17.2.5.3. SWOT Analysis
- 17.2.5.4. Recent Developments
- 17.2.5.5. Financials (Based on Availability)
- 17.2.6 TCS Private Limited
- 17.2.6.1. Overview
- 17.2.6.2. Products
- 17.2.6.3. SWOT Analysis
- 17.2.6.4. Recent Developments
- 17.2.6.5. Financials (Based on Availability)
- 17.2.7 McAfee Inc
- 17.2.7.1. Overview
- 17.2.7.2. Products
- 17.2.7.3. SWOT Analysis
- 17.2.7.4. Recent Developments
- 17.2.7.5. Financials (Based on Availability)
- 17.2.8 Cisco Systems Inc
- 17.2.8.1. Overview
- 17.2.8.2. Products
- 17.2.8.3. SWOT Analysis
- 17.2.8.4. Recent Developments
- 17.2.8.5. Financials (Based on Availability)
- 17.2.9 Microsoft Corporation
- 17.2.9.1. Overview
- 17.2.9.2. Products
- 17.2.9.3. SWOT Analysis
- 17.2.9.4. Recent Developments
- 17.2.9.5. Financials (Based on Availability)
- 17.2.10 Tylr Mobile Inc
- 17.2.10.1. Overview
- 17.2.10.2. Products
- 17.2.10.3. SWOT Analysis
- 17.2.10.4. Recent Developments
- 17.2.10.5. Financials (Based on Availability)
- 17.2.11 Oracle Corporation
- 17.2.11.1. Overview
- 17.2.11.2. Products
- 17.2.11.3. SWOT Analysis
- 17.2.11.4. Recent Developments
- 17.2.11.5. Financials (Based on Availability)
- 17.2.12 VMware Inc
- 17.2.12.1. Overview
- 17.2.12.2. Products
- 17.2.12.3. SWOT Analysis
- 17.2.12.4. Recent Developments
- 17.2.12.5. Financials (Based on Availability)
- 17.2.13 Broadcom Inc (Symantec Corporation)
- 17.2.13.1. Overview
- 17.2.13.2. Products
- 17.2.13.3. SWOT Analysis
- 17.2.13.4. Recent Developments
- 17.2.13.5. Financials (Based on Availability)
- 17.2.14 Citrix Systems Inc
- 17.2.14.1. Overview
- 17.2.14.2. Products
- 17.2.14.3. SWOT Analysis
- 17.2.14.4. Recent Developments
- 17.2.14.5. Financials (Based on Availability)
- 17.2.15 SAP SE
- 17.2.15.1. Overview
- 17.2.15.2. Products
- 17.2.15.3. SWOT Analysis
- 17.2.15.4. Recent Developments
- 17.2.15.5. Financials (Based on Availability)
- 17.2.1 Tech Mahindra
List of Figures
- Figure 1: Global Enterprise Mobility in Energy Sector Market Revenue Breakdown (Million, %) by Region 2024 & 2032
- Figure 2: North America Enterprise Mobility in Energy Sector Market Revenue (Million), by Country 2024 & 2032
- Figure 3: North America Enterprise Mobility in Energy Sector Market Revenue Share (%), by Country 2024 & 2032
- Figure 4: Europe Enterprise Mobility in Energy Sector Market Revenue (Million), by Country 2024 & 2032
- Figure 5: Europe Enterprise Mobility in Energy Sector Market Revenue Share (%), by Country 2024 & 2032
- Figure 6: Asia Pacific Enterprise Mobility in Energy Sector Market Revenue (Million), by Country 2024 & 2032
- Figure 7: Asia Pacific Enterprise Mobility in Energy Sector Market Revenue Share (%), by Country 2024 & 2032
- Figure 8: South America Enterprise Mobility in Energy Sector Market Revenue (Million), by Country 2024 & 2032
- Figure 9: South America Enterprise Mobility in Energy Sector Market Revenue Share (%), by Country 2024 & 2032
- Figure 10: North America Enterprise Mobility in Energy Sector Market Revenue (Million), by Country 2024 & 2032
- Figure 11: North America Enterprise Mobility in Energy Sector Market Revenue Share (%), by Country 2024 & 2032
- Figure 12: MEA Enterprise Mobility in Energy Sector Market Revenue (Million), by Country 2024 & 2032
- Figure 13: MEA Enterprise Mobility in Energy Sector Market Revenue Share (%), by Country 2024 & 2032
- Figure 14: North America Enterprise Mobility in Energy Sector Market Revenue (Million), by Device 2024 & 2032
- Figure 15: North America Enterprise Mobility in Energy Sector Market Revenue Share (%), by Device 2024 & 2032
- Figure 16: North America Enterprise Mobility in Energy Sector Market Revenue (Million), by Deployment 2024 & 2032
- Figure 17: North America Enterprise Mobility in Energy Sector Market Revenue Share (%), by Deployment 2024 & 2032
- Figure 18: North America Enterprise Mobility in Energy Sector Market Revenue (Million), by Country 2024 & 2032
- Figure 19: North America Enterprise Mobility in Energy Sector Market Revenue Share (%), by Country 2024 & 2032
- Figure 20: Europe Enterprise Mobility in Energy Sector Market Revenue (Million), by Device 2024 & 2032
- Figure 21: Europe Enterprise Mobility in Energy Sector Market Revenue Share (%), by Device 2024 & 2032
- Figure 22: Europe Enterprise Mobility in Energy Sector Market Revenue (Million), by Deployment 2024 & 2032
- Figure 23: Europe Enterprise Mobility in Energy Sector Market Revenue Share (%), by Deployment 2024 & 2032
- Figure 24: Europe Enterprise Mobility in Energy Sector Market Revenue (Million), by Country 2024 & 2032
- Figure 25: Europe Enterprise Mobility in Energy Sector Market Revenue Share (%), by Country 2024 & 2032
- Figure 26: Asia Pacific Enterprise Mobility in Energy Sector Market Revenue (Million), by Device 2024 & 2032
- Figure 27: Asia Pacific Enterprise Mobility in Energy Sector Market Revenue Share (%), by Device 2024 & 2032
- Figure 28: Asia Pacific Enterprise Mobility in Energy Sector Market Revenue (Million), by Deployment 2024 & 2032
- Figure 29: Asia Pacific Enterprise Mobility in Energy Sector Market Revenue Share (%), by Deployment 2024 & 2032
- Figure 30: Asia Pacific Enterprise Mobility in Energy Sector Market Revenue (Million), by Country 2024 & 2032
- Figure 31: Asia Pacific Enterprise Mobility in Energy Sector Market Revenue Share (%), by Country 2024 & 2032
- Figure 32: Latin America Enterprise Mobility in Energy Sector Market Revenue (Million), by Device 2024 & 2032
- Figure 33: Latin America Enterprise Mobility in Energy Sector Market Revenue Share (%), by Device 2024 & 2032
- Figure 34: Latin America Enterprise Mobility in Energy Sector Market Revenue (Million), by Deployment 2024 & 2032
- Figure 35: Latin America Enterprise Mobility in Energy Sector Market Revenue Share (%), by Deployment 2024 & 2032
- Figure 36: Latin America Enterprise Mobility in Energy Sector Market Revenue (Million), by Country 2024 & 2032
- Figure 37: Latin America Enterprise Mobility in Energy Sector Market Revenue Share (%), by Country 2024 & 2032
- Figure 38: Middle East Enterprise Mobility in Energy Sector Market Revenue (Million), by Device 2024 & 2032
- Figure 39: Middle East Enterprise Mobility in Energy Sector Market Revenue Share (%), by Device 2024 & 2032
- Figure 40: Middle East Enterprise Mobility in Energy Sector Market Revenue (Million), by Deployment 2024 & 2032
- Figure 41: Middle East Enterprise Mobility in Energy Sector Market Revenue Share (%), by Deployment 2024 & 2032
- Figure 42: Middle East Enterprise Mobility in Energy Sector Market Revenue (Million), by Country 2024 & 2032
- Figure 43: Middle East Enterprise Mobility in Energy Sector Market Revenue Share (%), by Country 2024 & 2032
List of Tables
- Table 1: Global Enterprise Mobility in Energy Sector Market Revenue Million Forecast, by Region 2019 & 2032
- Table 2: Global Enterprise Mobility in Energy Sector Market Revenue Million Forecast, by Device 2019 & 2032
- Table 3: Global Enterprise Mobility in Energy Sector Market Revenue Million Forecast, by Deployment 2019 & 2032
- Table 4: Global Enterprise Mobility in Energy Sector Market Revenue Million Forecast, by Region 2019 & 2032
- Table 5: Global Enterprise Mobility in Energy Sector Market Revenue Million Forecast, by Country 2019 & 2032
- Table 6: United States Enterprise Mobility in Energy Sector Market Revenue (Million) Forecast, by Application 2019 & 2032
- Table 7: Canada Enterprise Mobility in Energy Sector Market Revenue (Million) Forecast, by Application 2019 & 2032
- Table 8: Mexico Enterprise Mobility in Energy Sector Market Revenue (Million) Forecast, by Application 2019 & 2032
- Table 9: Global Enterprise Mobility in Energy Sector Market Revenue Million Forecast, by Country 2019 & 2032
- Table 10: Germany Enterprise Mobility in Energy Sector Market Revenue (Million) Forecast, by Application 2019 & 2032
- Table 11: United Kingdom Enterprise Mobility in Energy Sector Market Revenue (Million) Forecast, by Application 2019 & 2032
- Table 12: France Enterprise Mobility in Energy Sector Market Revenue (Million) Forecast, by Application 2019 & 2032
- Table 13: Spain Enterprise Mobility in Energy Sector Market Revenue (Million) Forecast, by Application 2019 & 2032
- Table 14: Italy Enterprise Mobility in Energy Sector Market Revenue (Million) Forecast, by Application 2019 & 2032
- Table 15: Spain Enterprise Mobility in Energy Sector Market Revenue (Million) Forecast, by Application 2019 & 2032
- Table 16: Belgium Enterprise Mobility in Energy Sector Market Revenue (Million) Forecast, by Application 2019 & 2032
- Table 17: Netherland Enterprise Mobility in Energy Sector Market Revenue (Million) Forecast, by Application 2019 & 2032
- Table 18: Nordics Enterprise Mobility in Energy Sector Market Revenue (Million) Forecast, by Application 2019 & 2032
- Table 19: Rest of Europe Enterprise Mobility in Energy Sector Market Revenue (Million) Forecast, by Application 2019 & 2032
- Table 20: Global Enterprise Mobility in Energy Sector Market Revenue Million Forecast, by Country 2019 & 2032
- Table 21: China Enterprise Mobility in Energy Sector Market Revenue (Million) Forecast, by Application 2019 & 2032
- Table 22: Japan Enterprise Mobility in Energy Sector Market Revenue (Million) Forecast, by Application 2019 & 2032
- Table 23: India Enterprise Mobility in Energy Sector Market Revenue (Million) Forecast, by Application 2019 & 2032
- Table 24: South Korea Enterprise Mobility in Energy Sector Market Revenue (Million) Forecast, by Application 2019 & 2032
- Table 25: Southeast Asia Enterprise Mobility in Energy Sector Market Revenue (Million) Forecast, by Application 2019 & 2032
- Table 26: Australia Enterprise Mobility in Energy Sector Market Revenue (Million) Forecast, by Application 2019 & 2032
- Table 27: Indonesia Enterprise Mobility in Energy Sector Market Revenue (Million) Forecast, by Application 2019 & 2032
- Table 28: Phillipes Enterprise Mobility in Energy Sector Market Revenue (Million) Forecast, by Application 2019 & 2032
- Table 29: Singapore Enterprise Mobility in Energy Sector Market Revenue (Million) Forecast, by Application 2019 & 2032
- Table 30: Thailandc Enterprise Mobility in Energy Sector Market Revenue (Million) Forecast, by Application 2019 & 2032
- Table 31: Rest of Asia Pacific Enterprise Mobility in Energy Sector Market Revenue (Million) Forecast, by Application 2019 & 2032
- Table 32: Global Enterprise Mobility in Energy Sector Market Revenue Million Forecast, by Country 2019 & 2032
- Table 33: Brazil Enterprise Mobility in Energy Sector Market Revenue (Million) Forecast, by Application 2019 & 2032
- Table 34: Argentina Enterprise Mobility in Energy Sector Market Revenue (Million) Forecast, by Application 2019 & 2032
- Table 35: Peru Enterprise Mobility in Energy Sector Market Revenue (Million) Forecast, by Application 2019 & 2032
- Table 36: Chile Enterprise Mobility in Energy Sector Market Revenue (Million) Forecast, by Application 2019 & 2032
- Table 37: Colombia Enterprise Mobility in Energy Sector Market Revenue (Million) Forecast, by Application 2019 & 2032
- Table 38: Ecuador Enterprise Mobility in Energy Sector Market Revenue (Million) Forecast, by Application 2019 & 2032
- Table 39: Venezuela Enterprise Mobility in Energy Sector Market Revenue (Million) Forecast, by Application 2019 & 2032
- Table 40: Rest of South America Enterprise Mobility in Energy Sector Market Revenue (Million) Forecast, by Application 2019 & 2032
- Table 41: Global Enterprise Mobility in Energy Sector Market Revenue Million Forecast, by Country 2019 & 2032
- Table 42: United States Enterprise Mobility in Energy Sector Market Revenue (Million) Forecast, by Application 2019 & 2032
- Table 43: Canada Enterprise Mobility in Energy Sector Market Revenue (Million) Forecast, by Application 2019 & 2032
- Table 44: Mexico Enterprise Mobility in Energy Sector Market Revenue (Million) Forecast, by Application 2019 & 2032
- Table 45: Global Enterprise Mobility in Energy Sector Market Revenue Million Forecast, by Country 2019 & 2032
- Table 46: United Arab Emirates Enterprise Mobility in Energy Sector Market Revenue (Million) Forecast, by Application 2019 & 2032
- Table 47: Saudi Arabia Enterprise Mobility in Energy Sector Market Revenue (Million) Forecast, by Application 2019 & 2032
- Table 48: South Africa Enterprise Mobility in Energy Sector Market Revenue (Million) Forecast, by Application 2019 & 2032
- Table 49: Rest of Middle East and Africa Enterprise Mobility in Energy Sector Market Revenue (Million) Forecast, by Application 2019 & 2032
- Table 50: Global Enterprise Mobility in Energy Sector Market Revenue Million Forecast, by Device 2019 & 2032
- Table 51: Global Enterprise Mobility in Energy Sector Market Revenue Million Forecast, by Deployment 2019 & 2032
- Table 52: Global Enterprise Mobility in Energy Sector Market Revenue Million Forecast, by Country 2019 & 2032
- Table 53: Global Enterprise Mobility in Energy Sector Market Revenue Million Forecast, by Device 2019 & 2032
- Table 54: Global Enterprise Mobility in Energy Sector Market Revenue Million Forecast, by Deployment 2019 & 2032
- Table 55: Global Enterprise Mobility in Energy Sector Market Revenue Million Forecast, by Country 2019 & 2032
- Table 56: Global Enterprise Mobility in Energy Sector Market Revenue Million Forecast, by Device 2019 & 2032
- Table 57: Global Enterprise Mobility in Energy Sector Market Revenue Million Forecast, by Deployment 2019 & 2032
- Table 58: Global Enterprise Mobility in Energy Sector Market Revenue Million Forecast, by Country 2019 & 2032
- Table 59: Global Enterprise Mobility in Energy Sector Market Revenue Million Forecast, by Device 2019 & 2032
- Table 60: Global Enterprise Mobility in Energy Sector Market Revenue Million Forecast, by Deployment 2019 & 2032
- Table 61: Global Enterprise Mobility in Energy Sector Market Revenue Million Forecast, by Country 2019 & 2032
- Table 62: Global Enterprise Mobility in Energy Sector Market Revenue Million Forecast, by Device 2019 & 2032
- Table 63: Global Enterprise Mobility in Energy Sector Market Revenue Million Forecast, by Deployment 2019 & 2032
- Table 64: Global Enterprise Mobility in Energy Sector Market Revenue Million Forecast, by Country 2019 & 2032
Frequently Asked Questions
1. What is the projected Compound Annual Growth Rate (CAGR) of the Enterprise Mobility in Energy Sector Market?
The projected CAGR is approximately 18.50%.
2. Which companies are prominent players in the Enterprise Mobility in Energy Sector Market?
Key companies in the market include Tech Mahindra, Workspot Inc, Apteligent, Blackberry Ltd, MobileIron Inc, TCS Private Limited, McAfee Inc, Cisco Systems Inc, Microsoft Corporation, Tylr Mobile Inc, Oracle Corporation, VMware Inc, Broadcom Inc (Symantec Corporation), Citrix Systems Inc, SAP SE.
3. What are the main segments of the Enterprise Mobility in Energy Sector Market?
The market segments include Device, Deployment.
4. Can you provide details about the market size?
The market size is estimated to be USD XX Million as of 2022.
5. What are some drivers contributing to market growth?
; Advancements in Energy Revolution is the Major Driving Factor.
6. What are the notable trends driving market growth?
Smartphones to Dominate the Market.
7. Are there any restraints impacting market growth?
; Security Vulnerability is the Major Discouraging Factor.
8. Can you provide examples of recent developments in the market?
N/A
9. What pricing options are available for accessing the report?
Pricing options include single-user, multi-user, and enterprise licenses priced at USD 4750, USD 5250, and USD 8750 respectively.
10. Is the market size provided in terms of value or volume?
The market size is provided in terms of value, measured in Million.
11. Are there any specific market keywords associated with the report?
Yes, the market keyword associated with the report is "Enterprise Mobility in Energy Sector Market," which aids in identifying and referencing the specific market segment covered.
12. How do I determine which pricing option suits my needs best?
The pricing options vary based on user requirements and access needs. Individual users may opt for single-user licenses, while businesses requiring broader access may choose multi-user or enterprise licenses for cost-effective access to the report.
13. Are there any additional resources or data provided in the Enterprise Mobility in Energy Sector Market report?
While the report offers comprehensive insights, it's advisable to review the specific contents or supplementary materials provided to ascertain if additional resources or data are available.
14. How can I stay updated on further developments or reports in the Enterprise Mobility in Energy Sector Market?
To stay informed about further developments, trends, and reports in the Enterprise Mobility in Energy Sector Market, consider subscribing to industry newsletters, following relevant companies and organizations, or regularly checking reputable industry news sources and publications.
Methodology
Step 1 - Identification of Relevant Samples Size from Population Database


Step 2 - Approaches for Defining Global Market Size (Value, Volume* & Price*)

Note*: In applicable scenarios
Step 3 - Data Sources
Primary Research
- Web Analytics
- Survey Reports
- Research Institute
- Latest Research Reports
- Opinion Leaders
Secondary Research
- Annual Reports
- White Paper
- Latest Press Release
- Industry Association
- Paid Database
- Investor Presentations

Step 4 - Data Triangulation
Involves using different sources of information in order to increase the validity of a study
These sources are likely to be stakeholders in a program - participants, other researchers, program staff, other community members, and so on.
Then we put all data in single framework & apply various statistical tools to find out the dynamic on the market.
During the analysis stage, feedback from the stakeholder groups would be compared to determine areas of agreement as well as areas of divergence


