
Key Insights
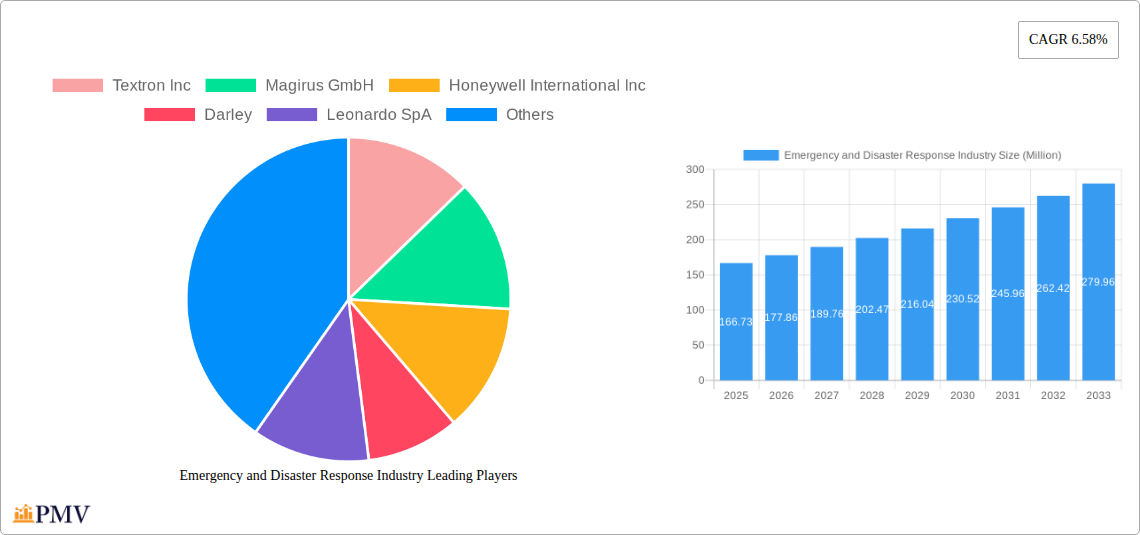
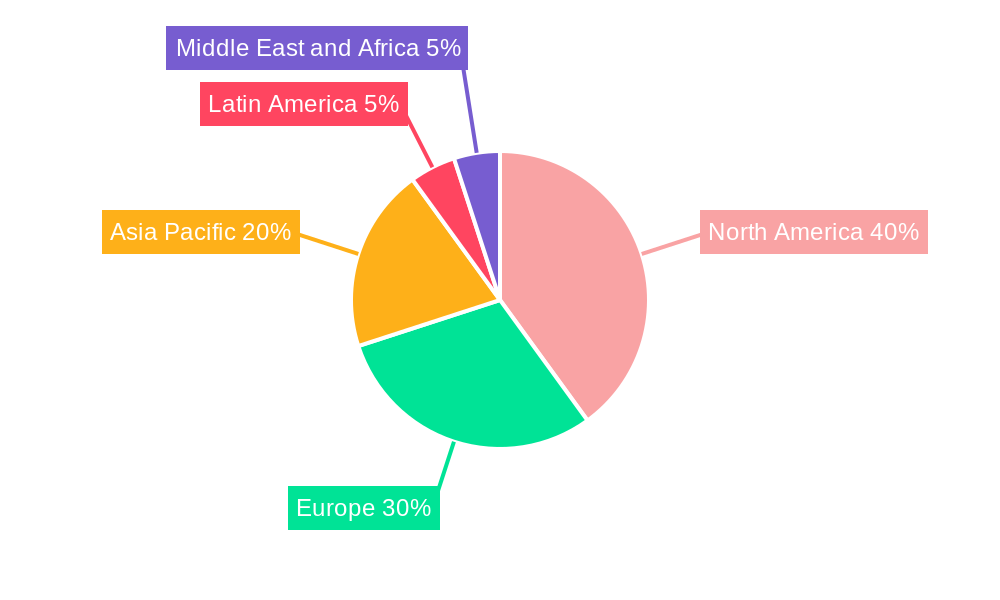
The global emergency and disaster response market, valued at $166.73 million in 2025, is projected to experience robust growth, driven by several key factors. Increasing frequency and intensity of natural disasters, coupled with rising urbanization and population density in vulnerable areas, are significantly boosting demand for advanced equipment and services. Government initiatives focusing on disaster preparedness and resilience, along with heightened public awareness of emergency response capabilities, further fuel market expansion. Technological advancements, such as improved communication systems, AI-powered predictive analytics for disaster risk assessment, and drone technology for search and rescue operations, are revolutionizing the sector, leading to more efficient and effective responses. The market is segmented by equipment (threat detection, personal protection gear, medical equipment, temporary shelters, mountaineering, firefighting, and others) and vehicle platforms (land, marine, and airborne), each exhibiting unique growth trajectories based on specific technological advancements and evolving response strategies. North America currently holds a significant market share due to advanced infrastructure and high disaster preparedness investments, but the Asia-Pacific region is poised for substantial growth due to rapid urbanization and increasing vulnerability to natural calamities.
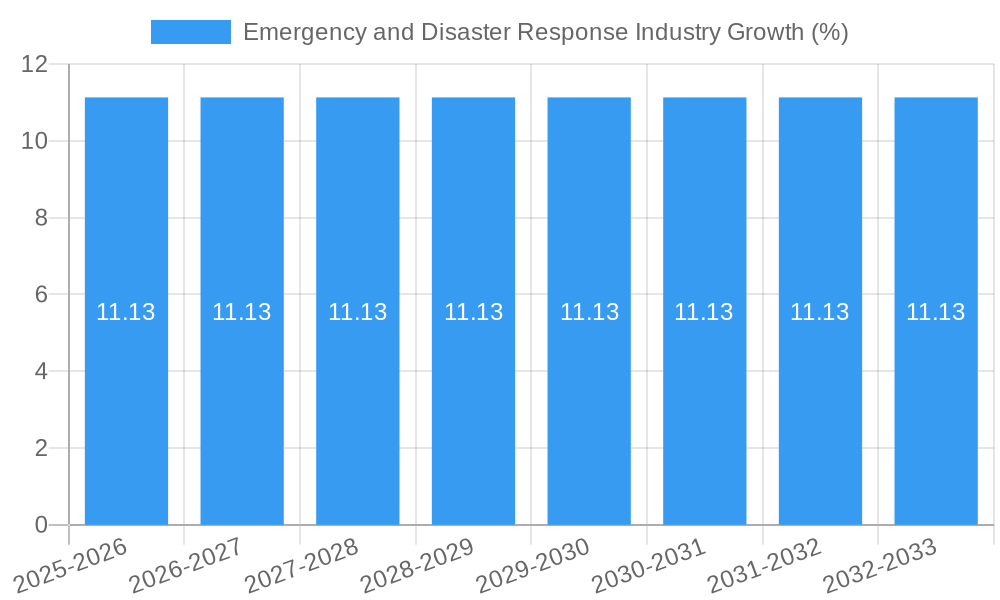
The market's growth is projected at a Compound Annual Growth Rate (CAGR) of 6.58% from 2025 to 2033. This growth is expected to be fueled by continuous innovation in equipment and technology, particularly in areas like early warning systems, improved medical technologies for disaster relief, and sustainable shelter solutions. Furthermore, increasing private sector investment in disaster response capabilities, driven by both corporate social responsibility initiatives and the growing need for business continuity planning, will contribute to market expansion. While regulatory hurdles and the high cost of advanced technologies might pose challenges, the overall market outlook remains positive, reflecting a global imperative to enhance preparedness and response to increasingly frequent and devastating emergency situations. The competitive landscape includes established players like Textron, Honeywell, and Rosenbauer, alongside emerging technology providers, indicative of a dynamic and rapidly evolving industry.
Emergency and Disaster Response Industry Market Report: 2019-2033
This comprehensive report provides a detailed analysis of the global Emergency and Disaster Response industry, offering invaluable insights for stakeholders, investors, and industry professionals. The study period covers 2019-2033, with 2025 as the base and estimated year, and a forecast period of 2025-2033. The report incorporates historical data from 2019-2024, examining market size, growth drivers, challenges, and competitive dynamics, with a focus on key players like Textron Inc, Magirus GmbH, Honeywell International Inc, and more. The market is projected to reach $XX Million by 2033.
Emergency and Disaster Response Industry Market Structure & Competitive Dynamics
The emergency and disaster response market exhibits a moderately concentrated structure, with a handful of multinational corporations holding significant market share. Key players like Textron Inc, Magirus GmbH, and Honeywell International Inc compete based on technological innovation, product differentiation, and global reach. The industry is characterized by a dynamic innovation ecosystem, with ongoing research and development in areas like threat detection, personal protection, and communication technologies. Regulatory frameworks, varying by region, significantly impact market access and product compliance. Product substitutes, including readily available materials for temporary shelters, exert competitive pressure, particularly in less developed regions. End-user trends, such as increasing demand for advanced technologies and sustainable solutions, are shaping industry development.
Mergers and acquisitions (M&A) activities have been notable, with several multi-million dollar deals reshaping the competitive landscape. For example, in 2022, a hypothetical acquisition of Company X by Company Y valued at $XX Million influenced market consolidation. The following metrics illustrate the competitive intensity:
- Market Share: Top 5 players hold approximately xx% of the market share (2025 estimate).
- M&A Deal Value (2019-2024): Total estimated value of M&A deals exceeded $XX Million.
Emergency and Disaster Response Industry Industry Trends & Insights
The emergency and disaster response market demonstrates strong growth potential, driven by increasing frequency and severity of natural disasters and heightened global security concerns. The Compound Annual Growth Rate (CAGR) is estimated at xx% during the forecast period (2025-2033). Technological disruptions, such as the adoption of AI-powered threat detection systems and drone-based surveillance, are revolutionizing response capabilities. Consumer preferences are shifting towards more efficient, sustainable, and technologically advanced solutions. The market penetration of advanced equipment, particularly in developed nations, remains relatively high, though significant untapped potential exists in emerging economies. Competitive dynamics are marked by innovation, strategic partnerships, and a push for superior technological solutions.
Dominant Markets & Segments in Emergency and Disaster Response Industry
North America currently dominates the global emergency and disaster response market, driven by robust economic conditions and substantial investments in public safety infrastructure. However, significant growth opportunities are emerging in the Asia-Pacific region due to increasing urbanization and vulnerability to natural disasters.
Key Drivers of Segment Dominance:
- Equipment:
- Fire Fighting Equipment: High demand due to wildfires, urban fires and industrial accidents.
- Medical Equipment: Growing need for advanced medical technologies in disaster response.
- Vehicle Platform:
- Land: Largest segment due to versatility and accessibility in various terrains.
- Airborne: Increasing adoption for rapid deployment and aerial surveillance.
Detailed Dominance Analysis:
- North America: Strong regulatory frameworks, high disaster preparedness budgets, and robust technological infrastructure drive market leadership.
- Asia-Pacific: Rapid economic growth, increasing urbanization, and vulnerability to natural disasters fuel substantial growth potential.
Emergency and Disaster Response Industry Product Innovations
Recent product innovations encompass AI-powered threat detection systems that improve early warning capabilities, lightweight and durable personal protection gear enhancing firefighter safety, and advanced medical equipment enabling on-site treatment in challenging environments. These innovations directly address market needs for improved response efficiency, enhanced safety, and reduced response times. Market fit is strong, as these advanced technologies offer tangible benefits in terms of cost savings, improved outcomes, and reduced risk.
Report Segmentation & Scope
This report segments the emergency and disaster response market by equipment type (Threat Detection Equipment, Personal Protection Gear, Medical Equipment, Temporary Shelter Equipment, Mountaineering Equipment, Fire Fighting Equipment, Other Equipment) and vehicle platform (Land, Marine, Airborne). Each segment is analyzed based on its market size, growth projections, and competitive dynamics. For example, the fire fighting equipment segment is expected to maintain a significant market share due to its consistent demand across various geographies. The airborne vehicle platform segment is projected to exhibit high growth due to increasing adoption for rapid deployment and aerial surveillance. Detailed projections for each segment are presented within the full report.
Key Drivers of Emergency and Disaster Response Industry Growth
Several factors fuel the growth of this industry. Technological advancements, such as improved sensors, drones, and AI-powered analytics, enhance response capabilities. Rising government spending on disaster preparedness and response initiatives, driven by increasing frequency of extreme weather events and security threats, provides a significant market boost. Stringent safety regulations and increasing public awareness of disaster risks further propel market demand.
Challenges in the Emergency and Disaster Response Industry Sector
The industry faces challenges including supply chain disruptions impacting the availability of critical equipment and components. Regulatory hurdles and compliance requirements in different regions can create market entry barriers. Intense competition among established players and emerging technologies necessitate continuous innovation and adaptation. The high cost of advanced equipment and technologies can limit adoption, especially in resource-constrained regions. The estimated impact of these constraints on annual market growth is xx%.
Leading Players in the Emergency and Disaster Response Industry Market
- Textron Inc
- Magirus GmbH
- Honeywell International Inc
- Darley
- Leonardo SpA
- Smiths Group PLC
- Viking Air Ltd
- Emergency Medical International
- Ziegler GmbH
- 3M
- Juvare LLC
- Emergency One Group
- Everbridge Inc
- Hexagon A
- Esri Inc
- Rosenbauer International AG
- REV Group Inc
Key Developments in Emergency and Disaster Response Industry Sector
- Jan 2023: Company X launches a new AI-powered threat detection system.
- July 2022: Company Y announces a strategic partnership to expand its global reach.
- Oct 2021: A major merger between two industry players reshapes the market landscape.
- Mar 2020: Increased demand for personal protective equipment due to a global pandemic.
Strategic Emergency and Disaster Response Industry Market Outlook
The future of the emergency and disaster response industry is promising, driven by ongoing technological advancements, increasing government funding, and growing awareness of disaster preparedness. Strategic opportunities lie in developing innovative solutions addressing emerging challenges, expanding into high-growth markets, and forging strategic partnerships to enhance technological capabilities and market reach. The market's future growth will be strongly influenced by advancements in AI, robotics, and sustainable technologies, leading to more efficient and effective disaster response capabilities.
Emergency and Disaster Response Industry Segmentation
-
1. Equipment
- 1.1. Threat Detection Equipment
- 1.2. Personal Protection Gear
- 1.3. Medical Equipment
- 1.4. Temporary Shelter Equipment
- 1.5. Mountaineering Equipment
- 1.6. Fire Fighting Equipment
- 1.7. Other Equipment
-
2. Vehicle Platform
- 2.1. Land
- 2.2. Marine
- 2.3. Airborne
Emergency and Disaster Response Industry Segmentation By Geography
-
1. North America
- 1.1. United States
- 1.2. Canada
-
2. Europe
- 2.1. United Kingdom
- 2.2. Germany
- 2.3. France
- 2.4. Italy
- 2.5. Russia
- 2.6. Rest of Europe
-
3. Asia Pacific
- 3.1. China
- 3.2. India
- 3.3. Japan
- 3.4. South Korea
- 3.5. Australia
- 3.6. Rest of Asia Pacific
-
4. Latin America
- 4.1. Brazil
- 4.2. Mexico
- 4.3. Rest of Latin America
-
5. Middle East and Africa
- 5.1. United Arab Emirates
- 5.2. Saudi Arabia
- 5.3. Egypt
- 5.4. South Africa
- 5.5. Rest of Middle East and Africa
Emergency and Disaster Response Industry REPORT HIGHLIGHTS
| Aspects | Details |
|---|---|
| Study Period | 2019-2033 |
| Base Year | 2024 |
| Estimated Year | 2025 |
| Forecast Period | 2025-2033 |
| Historical Period | 2019-2024 |
| Growth Rate | CAGR of 6.58% from 2019-2033 |
| Segmentation |
|
Table of Contents
- 1. Introduction
- 1.1. Research Scope
- 1.2. Market Segmentation
- 1.3. Research Methodology
- 1.4. Definitions and Assumptions
- 2. Executive Summary
- 2.1. Introduction
- 3. Market Dynamics
- 3.1. Introduction
- 3.2. Market Drivers
- 3.2.1. ; Increasing Number Of Air Passengers; Use Of Portable Electronic Devices
- 3.3. Market Restrains
- 3.3.1. ; High Cost Of Connectivity Equipments
- 3.4. Market Trends
- 3.4.1. Land Segment to Register the Highest CAGR during the Forecast Period
- 4. Market Factor Analysis
- 4.1. Porters Five Forces
- 4.2. Supply/Value Chain
- 4.3. PESTEL analysis
- 4.4. Market Entropy
- 4.5. Patent/Trademark Analysis
- 5. Global Emergency and Disaster Response Industry Analysis, Insights and Forecast, 2019-2031
- 5.1. Market Analysis, Insights and Forecast - by Equipment
- 5.1.1. Threat Detection Equipment
- 5.1.2. Personal Protection Gear
- 5.1.3. Medical Equipment
- 5.1.4. Temporary Shelter Equipment
- 5.1.5. Mountaineering Equipment
- 5.1.6. Fire Fighting Equipment
- 5.1.7. Other Equipment
- 5.2. Market Analysis, Insights and Forecast - by Vehicle Platform
- 5.2.1. Land
- 5.2.2. Marine
- 5.2.3. Airborne
- 5.3. Market Analysis, Insights and Forecast - by Region
- 5.3.1. North America
- 5.3.2. Europe
- 5.3.3. Asia Pacific
- 5.3.4. Latin America
- 5.3.5. Middle East and Africa
- 5.1. Market Analysis, Insights and Forecast - by Equipment
- 6. North America Emergency and Disaster Response Industry Analysis, Insights and Forecast, 2019-2031
- 6.1. Market Analysis, Insights and Forecast - by Equipment
- 6.1.1. Threat Detection Equipment
- 6.1.2. Personal Protection Gear
- 6.1.3. Medical Equipment
- 6.1.4. Temporary Shelter Equipment
- 6.1.5. Mountaineering Equipment
- 6.1.6. Fire Fighting Equipment
- 6.1.7. Other Equipment
- 6.2. Market Analysis, Insights and Forecast - by Vehicle Platform
- 6.2.1. Land
- 6.2.2. Marine
- 6.2.3. Airborne
- 6.1. Market Analysis, Insights and Forecast - by Equipment
- 7. Europe Emergency and Disaster Response Industry Analysis, Insights and Forecast, 2019-2031
- 7.1. Market Analysis, Insights and Forecast - by Equipment
- 7.1.1. Threat Detection Equipment
- 7.1.2. Personal Protection Gear
- 7.1.3. Medical Equipment
- 7.1.4. Temporary Shelter Equipment
- 7.1.5. Mountaineering Equipment
- 7.1.6. Fire Fighting Equipment
- 7.1.7. Other Equipment
- 7.2. Market Analysis, Insights and Forecast - by Vehicle Platform
- 7.2.1. Land
- 7.2.2. Marine
- 7.2.3. Airborne
- 7.1. Market Analysis, Insights and Forecast - by Equipment
- 8. Asia Pacific Emergency and Disaster Response Industry Analysis, Insights and Forecast, 2019-2031
- 8.1. Market Analysis, Insights and Forecast - by Equipment
- 8.1.1. Threat Detection Equipment
- 8.1.2. Personal Protection Gear
- 8.1.3. Medical Equipment
- 8.1.4. Temporary Shelter Equipment
- 8.1.5. Mountaineering Equipment
- 8.1.6. Fire Fighting Equipment
- 8.1.7. Other Equipment
- 8.2. Market Analysis, Insights and Forecast - by Vehicle Platform
- 8.2.1. Land
- 8.2.2. Marine
- 8.2.3. Airborne
- 8.1. Market Analysis, Insights and Forecast - by Equipment
- 9. Latin America Emergency and Disaster Response Industry Analysis, Insights and Forecast, 2019-2031
- 9.1. Market Analysis, Insights and Forecast - by Equipment
- 9.1.1. Threat Detection Equipment
- 9.1.2. Personal Protection Gear
- 9.1.3. Medical Equipment
- 9.1.4. Temporary Shelter Equipment
- 9.1.5. Mountaineering Equipment
- 9.1.6. Fire Fighting Equipment
- 9.1.7. Other Equipment
- 9.2. Market Analysis, Insights and Forecast - by Vehicle Platform
- 9.2.1. Land
- 9.2.2. Marine
- 9.2.3. Airborne
- 9.1. Market Analysis, Insights and Forecast - by Equipment
- 10. Middle East and Africa Emergency and Disaster Response Industry Analysis, Insights and Forecast, 2019-2031
- 10.1. Market Analysis, Insights and Forecast - by Equipment
- 10.1.1. Threat Detection Equipment
- 10.1.2. Personal Protection Gear
- 10.1.3. Medical Equipment
- 10.1.4. Temporary Shelter Equipment
- 10.1.5. Mountaineering Equipment
- 10.1.6. Fire Fighting Equipment
- 10.1.7. Other Equipment
- 10.2. Market Analysis, Insights and Forecast - by Vehicle Platform
- 10.2.1. Land
- 10.2.2. Marine
- 10.2.3. Airborne
- 10.1. Market Analysis, Insights and Forecast - by Equipment
- 11. North America Emergency and Disaster Response Industry Analysis, Insights and Forecast, 2019-2031
- 11.1. Market Analysis, Insights and Forecast - By Country/Sub-region
- 11.1.1 United States
- 11.1.2 Canada
- 12. Europe Emergency and Disaster Response Industry Analysis, Insights and Forecast, 2019-2031
- 12.1. Market Analysis, Insights and Forecast - By Country/Sub-region
- 12.1.1 United Kingdom
- 12.1.2 Germany
- 12.1.3 France
- 12.1.4 Italy
- 12.1.5 Russia
- 12.1.6 Rest of Europe
- 13. Asia Pacific Emergency and Disaster Response Industry Analysis, Insights and Forecast, 2019-2031
- 13.1. Market Analysis, Insights and Forecast - By Country/Sub-region
- 13.1.1 China
- 13.1.2 India
- 13.1.3 Japan
- 13.1.4 South Korea
- 13.1.5 Australia
- 13.1.6 Rest of Asia Pacific
- 14. Latin America Emergency and Disaster Response Industry Analysis, Insights and Forecast, 2019-2031
- 14.1. Market Analysis, Insights and Forecast - By Country/Sub-region
- 14.1.1 Brazil
- 14.1.2 Mexico
- 14.1.3 Rest of Latin America
- 15. Middle East and Africa Emergency and Disaster Response Industry Analysis, Insights and Forecast, 2019-2031
- 15.1. Market Analysis, Insights and Forecast - By Country/Sub-region
- 15.1.1 United Arab Emirates
- 15.1.2 Saudi Arabia
- 15.1.3 Egypt
- 15.1.4 South Africa
- 15.1.5 Rest of Middle East and Africa
- 16. Competitive Analysis
- 16.1. Global Market Share Analysis 2024
- 16.2. Company Profiles
- 16.2.1 Textron Inc
- 16.2.1.1. Overview
- 16.2.1.2. Products
- 16.2.1.3. SWOT Analysis
- 16.2.1.4. Recent Developments
- 16.2.1.5. Financials (Based on Availability)
- 16.2.2 Magirus GmbH
- 16.2.2.1. Overview
- 16.2.2.2. Products
- 16.2.2.3. SWOT Analysis
- 16.2.2.4. Recent Developments
- 16.2.2.5. Financials (Based on Availability)
- 16.2.3 Honeywell International Inc
- 16.2.3.1. Overview
- 16.2.3.2. Products
- 16.2.3.3. SWOT Analysis
- 16.2.3.4. Recent Developments
- 16.2.3.5. Financials (Based on Availability)
- 16.2.4 Darley
- 16.2.4.1. Overview
- 16.2.4.2. Products
- 16.2.4.3. SWOT Analysis
- 16.2.4.4. Recent Developments
- 16.2.4.5. Financials (Based on Availability)
- 16.2.5 Leonardo SpA
- 16.2.5.1. Overview
- 16.2.5.2. Products
- 16.2.5.3. SWOT Analysis
- 16.2.5.4. Recent Developments
- 16.2.5.5. Financials (Based on Availability)
- 16.2.6 Smiths Group PLC
- 16.2.6.1. Overview
- 16.2.6.2. Products
- 16.2.6.3. SWOT Analysis
- 16.2.6.4. Recent Developments
- 16.2.6.5. Financials (Based on Availability)
- 16.2.7 Viking Air Ltd
- 16.2.7.1. Overview
- 16.2.7.2. Products
- 16.2.7.3. SWOT Analysis
- 16.2.7.4. Recent Developments
- 16.2.7.5. Financials (Based on Availability)
- 16.2.8 Emergency Medical International
- 16.2.8.1. Overview
- 16.2.8.2. Products
- 16.2.8.3. SWOT Analysis
- 16.2.8.4. Recent Developments
- 16.2.8.5. Financials (Based on Availability)
- 16.2.9 Ziegler GmbH
- 16.2.9.1. Overview
- 16.2.9.2. Products
- 16.2.9.3. SWOT Analysis
- 16.2.9.4. Recent Developments
- 16.2.9.5. Financials (Based on Availability)
- 16.2.10 3M
- 16.2.10.1. Overview
- 16.2.10.2. Products
- 16.2.10.3. SWOT Analysis
- 16.2.10.4. Recent Developments
- 16.2.10.5. Financials (Based on Availability)
- 16.2.11 Juvare LLC
- 16.2.11.1. Overview
- 16.2.11.2. Products
- 16.2.11.3. SWOT Analysis
- 16.2.11.4. Recent Developments
- 16.2.11.5. Financials (Based on Availability)
- 16.2.12 Emergency One Group
- 16.2.12.1. Overview
- 16.2.12.2. Products
- 16.2.12.3. SWOT Analysis
- 16.2.12.4. Recent Developments
- 16.2.12.5. Financials (Based on Availability)
- 16.2.13 Everbridge Inc
- 16.2.13.1. Overview
- 16.2.13.2. Products
- 16.2.13.3. SWOT Analysis
- 16.2.13.4. Recent Developments
- 16.2.13.5. Financials (Based on Availability)
- 16.2.14 Hexagon A
- 16.2.14.1. Overview
- 16.2.14.2. Products
- 16.2.14.3. SWOT Analysis
- 16.2.14.4. Recent Developments
- 16.2.14.5. Financials (Based on Availability)
- 16.2.15 Esri Inc
- 16.2.15.1. Overview
- 16.2.15.2. Products
- 16.2.15.3. SWOT Analysis
- 16.2.15.4. Recent Developments
- 16.2.15.5. Financials (Based on Availability)
- 16.2.16 Rosenbauer International AG
- 16.2.16.1. Overview
- 16.2.16.2. Products
- 16.2.16.3. SWOT Analysis
- 16.2.16.4. Recent Developments
- 16.2.16.5. Financials (Based on Availability)
- 16.2.17 REV Group Inc
- 16.2.17.1. Overview
- 16.2.17.2. Products
- 16.2.17.3. SWOT Analysis
- 16.2.17.4. Recent Developments
- 16.2.17.5. Financials (Based on Availability)
- 16.2.1 Textron Inc
List of Figures
- Figure 1: Global Emergency and Disaster Response Industry Revenue Breakdown (Million, %) by Region 2024 & 2032
- Figure 2: North America Emergency and Disaster Response Industry Revenue (Million), by Country 2024 & 2032
- Figure 3: North America Emergency and Disaster Response Industry Revenue Share (%), by Country 2024 & 2032
- Figure 4: Europe Emergency and Disaster Response Industry Revenue (Million), by Country 2024 & 2032
- Figure 5: Europe Emergency and Disaster Response Industry Revenue Share (%), by Country 2024 & 2032
- Figure 6: Asia Pacific Emergency and Disaster Response Industry Revenue (Million), by Country 2024 & 2032
- Figure 7: Asia Pacific Emergency and Disaster Response Industry Revenue Share (%), by Country 2024 & 2032
- Figure 8: Latin America Emergency and Disaster Response Industry Revenue (Million), by Country 2024 & 2032
- Figure 9: Latin America Emergency and Disaster Response Industry Revenue Share (%), by Country 2024 & 2032
- Figure 10: Middle East and Africa Emergency and Disaster Response Industry Revenue (Million), by Country 2024 & 2032
- Figure 11: Middle East and Africa Emergency and Disaster Response Industry Revenue Share (%), by Country 2024 & 2032
- Figure 12: North America Emergency and Disaster Response Industry Revenue (Million), by Equipment 2024 & 2032
- Figure 13: North America Emergency and Disaster Response Industry Revenue Share (%), by Equipment 2024 & 2032
- Figure 14: North America Emergency and Disaster Response Industry Revenue (Million), by Vehicle Platform 2024 & 2032
- Figure 15: North America Emergency and Disaster Response Industry Revenue Share (%), by Vehicle Platform 2024 & 2032
- Figure 16: North America Emergency and Disaster Response Industry Revenue (Million), by Country 2024 & 2032
- Figure 17: North America Emergency and Disaster Response Industry Revenue Share (%), by Country 2024 & 2032
- Figure 18: Europe Emergency and Disaster Response Industry Revenue (Million), by Equipment 2024 & 2032
- Figure 19: Europe Emergency and Disaster Response Industry Revenue Share (%), by Equipment 2024 & 2032
- Figure 20: Europe Emergency and Disaster Response Industry Revenue (Million), by Vehicle Platform 2024 & 2032
- Figure 21: Europe Emergency and Disaster Response Industry Revenue Share (%), by Vehicle Platform 2024 & 2032
- Figure 22: Europe Emergency and Disaster Response Industry Revenue (Million), by Country 2024 & 2032
- Figure 23: Europe Emergency and Disaster Response Industry Revenue Share (%), by Country 2024 & 2032
- Figure 24: Asia Pacific Emergency and Disaster Response Industry Revenue (Million), by Equipment 2024 & 2032
- Figure 25: Asia Pacific Emergency and Disaster Response Industry Revenue Share (%), by Equipment 2024 & 2032
- Figure 26: Asia Pacific Emergency and Disaster Response Industry Revenue (Million), by Vehicle Platform 2024 & 2032
- Figure 27: Asia Pacific Emergency and Disaster Response Industry Revenue Share (%), by Vehicle Platform 2024 & 2032
- Figure 28: Asia Pacific Emergency and Disaster Response Industry Revenue (Million), by Country 2024 & 2032
- Figure 29: Asia Pacific Emergency and Disaster Response Industry Revenue Share (%), by Country 2024 & 2032
- Figure 30: Latin America Emergency and Disaster Response Industry Revenue (Million), by Equipment 2024 & 2032
- Figure 31: Latin America Emergency and Disaster Response Industry Revenue Share (%), by Equipment 2024 & 2032
- Figure 32: Latin America Emergency and Disaster Response Industry Revenue (Million), by Vehicle Platform 2024 & 2032
- Figure 33: Latin America Emergency and Disaster Response Industry Revenue Share (%), by Vehicle Platform 2024 & 2032
- Figure 34: Latin America Emergency and Disaster Response Industry Revenue (Million), by Country 2024 & 2032
- Figure 35: Latin America Emergency and Disaster Response Industry Revenue Share (%), by Country 2024 & 2032
- Figure 36: Middle East and Africa Emergency and Disaster Response Industry Revenue (Million), by Equipment 2024 & 2032
- Figure 37: Middle East and Africa Emergency and Disaster Response Industry Revenue Share (%), by Equipment 2024 & 2032
- Figure 38: Middle East and Africa Emergency and Disaster Response Industry Revenue (Million), by Vehicle Platform 2024 & 2032
- Figure 39: Middle East and Africa Emergency and Disaster Response Industry Revenue Share (%), by Vehicle Platform 2024 & 2032
- Figure 40: Middle East and Africa Emergency and Disaster Response Industry Revenue (Million), by Country 2024 & 2032
- Figure 41: Middle East and Africa Emergency and Disaster Response Industry Revenue Share (%), by Country 2024 & 2032
List of Tables
- Table 1: Global Emergency and Disaster Response Industry Revenue Million Forecast, by Region 2019 & 2032
- Table 2: Global Emergency and Disaster Response Industry Revenue Million Forecast, by Equipment 2019 & 2032
- Table 3: Global Emergency and Disaster Response Industry Revenue Million Forecast, by Vehicle Platform 2019 & 2032
- Table 4: Global Emergency and Disaster Response Industry Revenue Million Forecast, by Region 2019 & 2032
- Table 5: Global Emergency and Disaster Response Industry Revenue Million Forecast, by Country 2019 & 2032
- Table 6: United States Emergency and Disaster Response Industry Revenue (Million) Forecast, by Application 2019 & 2032
- Table 7: Canada Emergency and Disaster Response Industry Revenue (Million) Forecast, by Application 2019 & 2032
- Table 8: Global Emergency and Disaster Response Industry Revenue Million Forecast, by Country 2019 & 2032
- Table 9: United Kingdom Emergency and Disaster Response Industry Revenue (Million) Forecast, by Application 2019 & 2032
- Table 10: Germany Emergency and Disaster Response Industry Revenue (Million) Forecast, by Application 2019 & 2032
- Table 11: France Emergency and Disaster Response Industry Revenue (Million) Forecast, by Application 2019 & 2032
- Table 12: Italy Emergency and Disaster Response Industry Revenue (Million) Forecast, by Application 2019 & 2032
- Table 13: Russia Emergency and Disaster Response Industry Revenue (Million) Forecast, by Application 2019 & 2032
- Table 14: Rest of Europe Emergency and Disaster Response Industry Revenue (Million) Forecast, by Application 2019 & 2032
- Table 15: Global Emergency and Disaster Response Industry Revenue Million Forecast, by Country 2019 & 2032
- Table 16: China Emergency and Disaster Response Industry Revenue (Million) Forecast, by Application 2019 & 2032
- Table 17: India Emergency and Disaster Response Industry Revenue (Million) Forecast, by Application 2019 & 2032
- Table 18: Japan Emergency and Disaster Response Industry Revenue (Million) Forecast, by Application 2019 & 2032
- Table 19: South Korea Emergency and Disaster Response Industry Revenue (Million) Forecast, by Application 2019 & 2032
- Table 20: Australia Emergency and Disaster Response Industry Revenue (Million) Forecast, by Application 2019 & 2032
- Table 21: Rest of Asia Pacific Emergency and Disaster Response Industry Revenue (Million) Forecast, by Application 2019 & 2032
- Table 22: Global Emergency and Disaster Response Industry Revenue Million Forecast, by Country 2019 & 2032
- Table 23: Brazil Emergency and Disaster Response Industry Revenue (Million) Forecast, by Application 2019 & 2032
- Table 24: Mexico Emergency and Disaster Response Industry Revenue (Million) Forecast, by Application 2019 & 2032
- Table 25: Rest of Latin America Emergency and Disaster Response Industry Revenue (Million) Forecast, by Application 2019 & 2032
- Table 26: Global Emergency and Disaster Response Industry Revenue Million Forecast, by Country 2019 & 2032
- Table 27: United Arab Emirates Emergency and Disaster Response Industry Revenue (Million) Forecast, by Application 2019 & 2032
- Table 28: Saudi Arabia Emergency and Disaster Response Industry Revenue (Million) Forecast, by Application 2019 & 2032
- Table 29: Egypt Emergency and Disaster Response Industry Revenue (Million) Forecast, by Application 2019 & 2032
- Table 30: South Africa Emergency and Disaster Response Industry Revenue (Million) Forecast, by Application 2019 & 2032
- Table 31: Rest of Middle East and Africa Emergency and Disaster Response Industry Revenue (Million) Forecast, by Application 2019 & 2032
- Table 32: Global Emergency and Disaster Response Industry Revenue Million Forecast, by Equipment 2019 & 2032
- Table 33: Global Emergency and Disaster Response Industry Revenue Million Forecast, by Vehicle Platform 2019 & 2032
- Table 34: Global Emergency and Disaster Response Industry Revenue Million Forecast, by Country 2019 & 2032
- Table 35: United States Emergency and Disaster Response Industry Revenue (Million) Forecast, by Application 2019 & 2032
- Table 36: Canada Emergency and Disaster Response Industry Revenue (Million) Forecast, by Application 2019 & 2032
- Table 37: Global Emergency and Disaster Response Industry Revenue Million Forecast, by Equipment 2019 & 2032
- Table 38: Global Emergency and Disaster Response Industry Revenue Million Forecast, by Vehicle Platform 2019 & 2032
- Table 39: Global Emergency and Disaster Response Industry Revenue Million Forecast, by Country 2019 & 2032
- Table 40: United Kingdom Emergency and Disaster Response Industry Revenue (Million) Forecast, by Application 2019 & 2032
- Table 41: Germany Emergency and Disaster Response Industry Revenue (Million) Forecast, by Application 2019 & 2032
- Table 42: France Emergency and Disaster Response Industry Revenue (Million) Forecast, by Application 2019 & 2032
- Table 43: Italy Emergency and Disaster Response Industry Revenue (Million) Forecast, by Application 2019 & 2032
- Table 44: Russia Emergency and Disaster Response Industry Revenue (Million) Forecast, by Application 2019 & 2032
- Table 45: Rest of Europe Emergency and Disaster Response Industry Revenue (Million) Forecast, by Application 2019 & 2032
- Table 46: Global Emergency and Disaster Response Industry Revenue Million Forecast, by Equipment 2019 & 2032
- Table 47: Global Emergency and Disaster Response Industry Revenue Million Forecast, by Vehicle Platform 2019 & 2032
- Table 48: Global Emergency and Disaster Response Industry Revenue Million Forecast, by Country 2019 & 2032
- Table 49: China Emergency and Disaster Response Industry Revenue (Million) Forecast, by Application 2019 & 2032
- Table 50: India Emergency and Disaster Response Industry Revenue (Million) Forecast, by Application 2019 & 2032
- Table 51: Japan Emergency and Disaster Response Industry Revenue (Million) Forecast, by Application 2019 & 2032
- Table 52: South Korea Emergency and Disaster Response Industry Revenue (Million) Forecast, by Application 2019 & 2032
- Table 53: Australia Emergency and Disaster Response Industry Revenue (Million) Forecast, by Application 2019 & 2032
- Table 54: Rest of Asia Pacific Emergency and Disaster Response Industry Revenue (Million) Forecast, by Application 2019 & 2032
- Table 55: Global Emergency and Disaster Response Industry Revenue Million Forecast, by Equipment 2019 & 2032
- Table 56: Global Emergency and Disaster Response Industry Revenue Million Forecast, by Vehicle Platform 2019 & 2032
- Table 57: Global Emergency and Disaster Response Industry Revenue Million Forecast, by Country 2019 & 2032
- Table 58: Brazil Emergency and Disaster Response Industry Revenue (Million) Forecast, by Application 2019 & 2032
- Table 59: Mexico Emergency and Disaster Response Industry Revenue (Million) Forecast, by Application 2019 & 2032
- Table 60: Rest of Latin America Emergency and Disaster Response Industry Revenue (Million) Forecast, by Application 2019 & 2032
- Table 61: Global Emergency and Disaster Response Industry Revenue Million Forecast, by Equipment 2019 & 2032
- Table 62: Global Emergency and Disaster Response Industry Revenue Million Forecast, by Vehicle Platform 2019 & 2032
- Table 63: Global Emergency and Disaster Response Industry Revenue Million Forecast, by Country 2019 & 2032
- Table 64: United Arab Emirates Emergency and Disaster Response Industry Revenue (Million) Forecast, by Application 2019 & 2032
- Table 65: Saudi Arabia Emergency and Disaster Response Industry Revenue (Million) Forecast, by Application 2019 & 2032
- Table 66: Egypt Emergency and Disaster Response Industry Revenue (Million) Forecast, by Application 2019 & 2032
- Table 67: South Africa Emergency and Disaster Response Industry Revenue (Million) Forecast, by Application 2019 & 2032
- Table 68: Rest of Middle East and Africa Emergency and Disaster Response Industry Revenue (Million) Forecast, by Application 2019 & 2032
Frequently Asked Questions
1. What is the projected Compound Annual Growth Rate (CAGR) of the Emergency and Disaster Response Industry?
The projected CAGR is approximately 6.58%.
2. Which companies are prominent players in the Emergency and Disaster Response Industry?
Key companies in the market include Textron Inc, Magirus GmbH, Honeywell International Inc, Darley, Leonardo SpA, Smiths Group PLC, Viking Air Ltd, Emergency Medical International, Ziegler GmbH, 3M, Juvare LLC, Emergency One Group, Everbridge Inc, Hexagon A, Esri Inc, Rosenbauer International AG, REV Group Inc.
3. What are the main segments of the Emergency and Disaster Response Industry?
The market segments include Equipment, Vehicle Platform.
4. Can you provide details about the market size?
The market size is estimated to be USD 166.73 Million as of 2022.
5. What are some drivers contributing to market growth?
; Increasing Number Of Air Passengers; Use Of Portable Electronic Devices.
6. What are the notable trends driving market growth?
Land Segment to Register the Highest CAGR during the Forecast Period.
7. Are there any restraints impacting market growth?
; High Cost Of Connectivity Equipments.
8. Can you provide examples of recent developments in the market?
N/A
9. What pricing options are available for accessing the report?
Pricing options include single-user, multi-user, and enterprise licenses priced at USD 4750, USD 5250, and USD 8750 respectively.
10. Is the market size provided in terms of value or volume?
The market size is provided in terms of value, measured in Million.
11. Are there any specific market keywords associated with the report?
Yes, the market keyword associated with the report is "Emergency and Disaster Response Industry," which aids in identifying and referencing the specific market segment covered.
12. How do I determine which pricing option suits my needs best?
The pricing options vary based on user requirements and access needs. Individual users may opt for single-user licenses, while businesses requiring broader access may choose multi-user or enterprise licenses for cost-effective access to the report.
13. Are there any additional resources or data provided in the Emergency and Disaster Response Industry report?
While the report offers comprehensive insights, it's advisable to review the specific contents or supplementary materials provided to ascertain if additional resources or data are available.
14. How can I stay updated on further developments or reports in the Emergency and Disaster Response Industry?
To stay informed about further developments, trends, and reports in the Emergency and Disaster Response Industry, consider subscribing to industry newsletters, following relevant companies and organizations, or regularly checking reputable industry news sources and publications.
Methodology
Step 1 - Identification of Relevant Samples Size from Population Database


Step 2 - Approaches for Defining Global Market Size (Value, Volume* & Price*)

Note*: In applicable scenarios
Step 3 - Data Sources
Primary Research
- Web Analytics
- Survey Reports
- Research Institute
- Latest Research Reports
- Opinion Leaders
Secondary Research
- Annual Reports
- White Paper
- Latest Press Release
- Industry Association
- Paid Database
- Investor Presentations

Step 4 - Data Triangulation
Involves using different sources of information in order to increase the validity of a study
These sources are likely to be stakeholders in a program - participants, other researchers, program staff, other community members, and so on.
Then we put all data in single framework & apply various statistical tools to find out the dynamic on the market.
During the analysis stage, feedback from the stakeholder groups would be compared to determine areas of agreement as well as areas of divergence


