
Key Insights
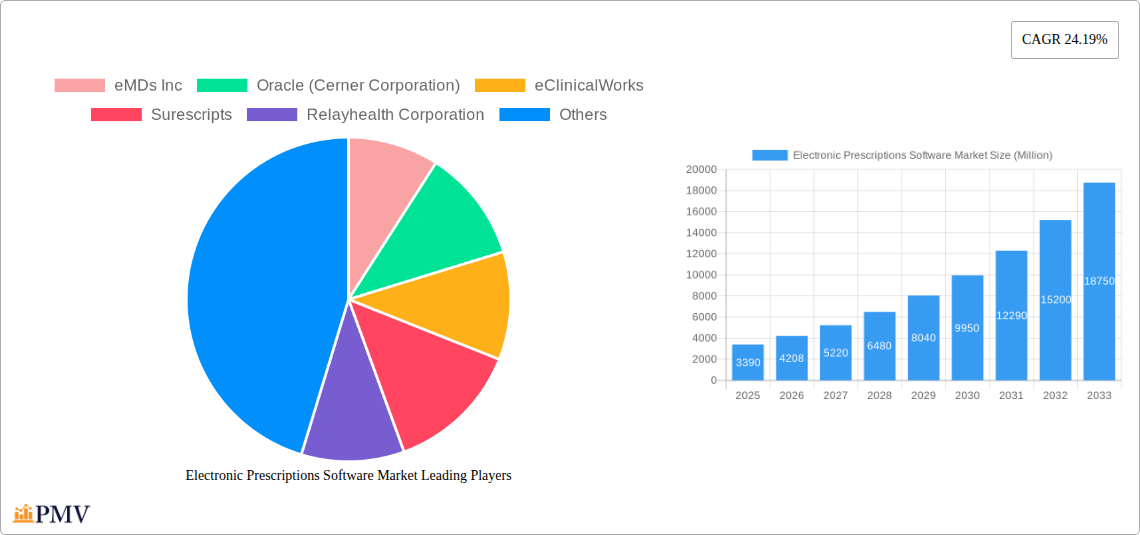
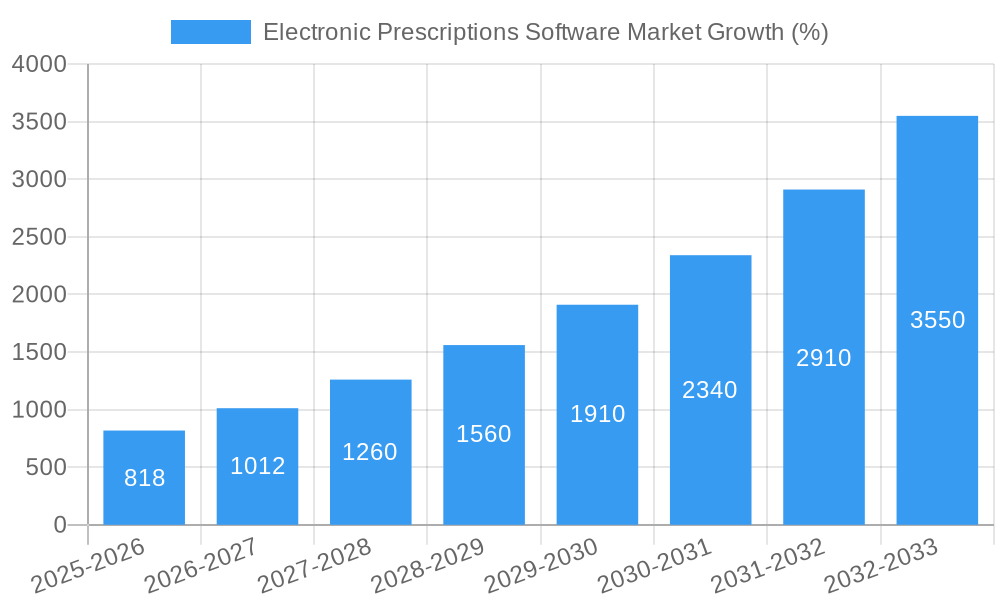
The Electronic Prescriptions (e-Prescribing) Software market is experiencing robust growth, projected to reach a market size of $3.39 billion in 2025 and maintain a Compound Annual Growth Rate (CAGR) of 24.19% from 2025 to 2033. This surge is driven by several key factors. Increasing government initiatives promoting the adoption of electronic health records (EHRs) and e-prescribing to improve patient safety and reduce medication errors are significant catalysts. Furthermore, the rising prevalence of chronic diseases necessitates efficient medication management, fueling the demand for streamlined e-prescribing solutions. The integration of e-prescribing systems with existing EHRs offers enhanced workflow efficiency and reduced administrative burdens for healthcare providers, further bolstering market growth. The shift towards cloud-based and web-based delivery models is enhancing accessibility and scalability, attracting a broader range of healthcare providers, from large hospitals to smaller clinics. Competition among established players like eMDs, Oracle (Cerner), eClinicalWorks, and Allscripts, alongside emerging innovative companies, is fostering technological advancements and driving down costs, making e-prescribing more accessible.
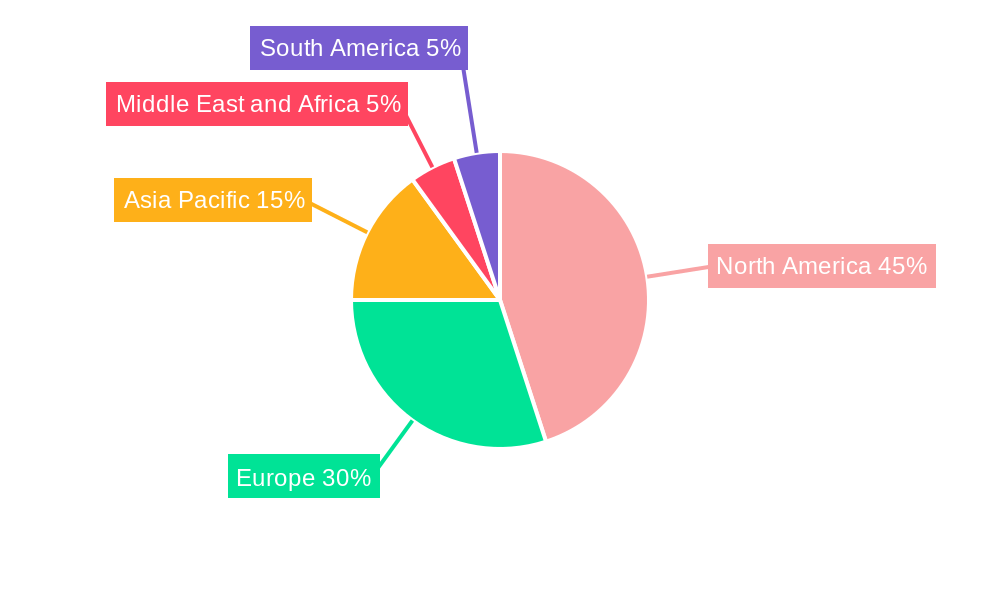
The market segmentation reveals a diverse landscape. While integrated e-prescribing systems are gaining traction due to their seamless integration with existing workflows, standalone systems continue to cater to specific needs. The cloud-based delivery model enjoys a significant market share due to its inherent flexibility and cost-effectiveness. Hospitals and clinics represent the largest end-user segments, driven by their need for robust and reliable systems to manage patient prescriptions effectively. Geographically, North America currently holds a significant market share, attributed to advanced healthcare infrastructure and early adoption of e-prescribing technology. However, regions like Asia-Pacific and Europe are poised for significant growth driven by increasing healthcare expenditure and digital health initiatives. The market's future growth hinges on continued technological innovations, enhanced interoperability between systems, and increasing government regulations mandating e-prescribing adoption.
Electronic Prescriptions Software Market: A Comprehensive Report (2019-2033)
This in-depth report provides a comprehensive analysis of the Electronic Prescriptions Software Market, offering valuable insights for stakeholders across the healthcare IT sector. Covering the period from 2019 to 2033, with a focus on 2025, this report meticulously examines market dynamics, competitive landscapes, and future growth projections. The report utilizes a robust methodology incorporating historical data (2019-2024), current estimates (2025), and future forecasts (2025-2033) to present a holistic view of this rapidly evolving market. Key players analyzed include eMDs Inc, Oracle (Cerner Corporation), eClinicalWorks, Surescripts, Relayhealth Corporation, Allscripts Healthcare Solutions Inc (Veradigm), NextGen Healthcare Inc, DrFirst, and Athenahealth Inc.
Electronic Prescriptions Software Market Structure & Competitive Dynamics
The Electronic Prescriptions Software market exhibits a moderately concentrated structure, with several major players commanding significant market share. The market is characterized by ongoing innovation, particularly in areas like cloud-based solutions and integrated systems. Stringent regulatory frameworks, varying by region, influence market entry and product development. Substitute products, such as fax-based prescriptions, still exist but are steadily declining due to efficiency and safety concerns. End-user trends lean towards integrated systems offering comprehensive patient management capabilities, driven by a demand for streamlined workflows and improved data interoperability.
Mergers and acquisitions (M&A) are frequent, reflecting the market's dynamic nature. For instance, the acquisition of Doxper by Meddo in August 2021 signifies the ongoing consolidation and expansion efforts within the industry. While precise M&A deal values are not publicly available for all transactions, it’s estimated that deals involving significant market players average xx Million in value. Market share distribution among the leading players is approximately as follows: eClinicalWorks (xx%), Allscripts Healthcare Solutions Inc (Veradigm) (xx%), Cerner (xx%), and others (xx%). The remaining share is distributed across numerous smaller players and niche providers. Further analysis within the report details the competitive landscape, revealing market share dynamics and the strategies employed by key players to maintain or expand their position.
Electronic Prescriptions Software Market Industry Trends & Insights
The Electronic Prescriptions Software market is experiencing robust growth, driven by several key factors. Government initiatives promoting the adoption of electronic health records (EHRs) and interoperability standards are significantly impacting market expansion. Technological advancements, specifically in cloud computing and artificial intelligence (AI), are enhancing the functionality and efficiency of e-prescribing systems. The increasing preference for patient-centric care models, demanding readily accessible and integrated patient data, also fuels market growth. This trend towards improved healthcare accessibility boosts adoption, particularly in regions with developing healthcare infrastructures.
The market is witnessing a shift towards integrated e-prescribing systems, offering a wider range of functionalities compared to standalone systems. Cloud-based delivery modes dominate due to scalability, cost-effectiveness, and accessibility advantages. The compound annual growth rate (CAGR) for the market is projected to be xx% during the forecast period (2025-2033). Market penetration varies significantly across regions, with developed nations exhibiting higher adoption rates than developing countries. However, the latter are showing rapid growth, particularly in regions experiencing increased healthcare investment and infrastructure development. Competitive dynamics are shaped by innovation, pricing strategies, and strategic partnerships aiming to increase market share.
Dominant Markets & Segments in Electronic Prescriptions Software Market
The North American market currently holds the dominant position in the global Electronic Prescriptions Software market, driven by high technological adoption rates, stringent regulatory compliance, and substantial healthcare expenditure. Within North America, the United States showcases significant market dominance due to the robust presence of major players and extensive investments in digital healthcare infrastructure.
- Key Drivers in North America:
- Strong regulatory support and incentives for EHR adoption.
- High healthcare expenditure and technological advancement.
- Well-established healthcare IT infrastructure.
- Growing preference for patient-centric care models.
The software segment is the largest revenue contributor due to its critical role in the core functionality of e-prescribing systems. The integrated e-prescribing system type is gaining momentum over standalone systems due to its enhanced functionalities. Cloud-based delivery modes dominate, driven by their cost-effectiveness and scalability. Hospitals constitute a significant portion of the end-user base, reflecting their need for comprehensive patient management solutions. Clinics form another crucial user segment, driven by rising demands for operational efficiency. Detailed analysis further explores regional and segment-specific growth drivers, market sizes, and competitive dynamics.
Electronic Prescriptions Software Market Product Innovations
Recent innovations focus on enhancing user experience, improving data security, and integrating with other healthcare IT systems. The integration of AI-powered clinical decision support systems within e-prescribing platforms is transforming workflows by providing prescribers with real-time insights and reducing medication errors. Cloud-native solutions are gaining traction due to their inherent flexibility and scalability. These new solutions are tailored to meet the evolving needs of healthcare providers, aligning with industry standards for interoperability and data security, thus addressing major market demands.
Report Segmentation & Scope
This report segments the Electronic Prescriptions Software market across several key parameters:
Component: Hardware, Software, Services. The software segment is projected to witness the highest growth rate due to its central role in e-prescribing functionality.
Type of System: Stand-alone E-prescribing System, Integrated E-prescribing System. The integrated system segment is expected to experience faster growth due to its improved features and interoperability.
Delivery Mode: Cloud Based, Web Based, On-Premise. Cloud-based solutions are expected to dominate due to scalability and cost-effectiveness.
End Users: Hospitals, Clinics. Both segments are projected to exhibit substantial growth, reflecting the rising adoption of e-prescribing across the healthcare sector.
Each segment's growth projections, market size estimations, and competitive dynamics are thoroughly examined in the report.
Key Drivers of Electronic Prescriptions Software Market Growth
Several factors are driving the growth of the Electronic Prescriptions Software market:
- Government Regulations: Mandates and incentives promoting EHR adoption and interoperability.
- Technological Advancements: Cloud computing, AI, and enhanced security features.
- Improved Patient Care: Enhanced efficiency, reduced medication errors, and improved patient safety.
- Cost Savings: Streamlined workflows and reduced administrative burden.
Challenges in the Electronic Prescriptions Software Market Sector
The market faces several challenges:
- Data Security and Privacy Concerns: Ensuring compliance with regulations like HIPAA.
- Interoperability Issues: Integrating with various healthcare IT systems.
- High Implementation Costs: Initial investment and ongoing maintenance expenses.
- Resistance to Change: Adoption challenges among healthcare professionals.
Leading Players in the Electronic Prescriptions Software Market Market
- eMDs Inc
- Oracle (Cerner Corporation)
- eClinicalWorks
- Surescripts
- Relayhealth Corporation
- Allscripts Healthcare Solutions Inc (Veradigm)
- NextGen Healthcare Inc
- DrFirst
- Athenahealth Inc
Key Developments in Electronic Prescriptions Software Market Sector
- March 2022: FDB (First Databank, Inc.) launched FDB Vela, a cloud-native e-prescribing network enhancing information flow and clinical decision support.
- August 2021: Meddo acquired Doxper, expanding its patient base and clinic reach in India.
Strategic Electronic Prescriptions Software Market Outlook
The Electronic Prescriptions Software market presents significant growth opportunities. Continued technological advancements, coupled with increasing regulatory support and rising healthcare expenditure, will fuel market expansion. Strategic partnerships, focusing on interoperability and data integration, are crucial for success. The market's future growth hinges on addressing challenges related to data security, interoperability, and implementation costs. Expansion into emerging markets and the incorporation of innovative technologies like AI will shape future market dynamics.
Electronic Prescriptions Software Market Segmentation
-
1. Component
- 1.1. Hardware
- 1.2. Software
- 1.3. Services
-
2. Type of System
- 2.1. Stand-alone E-prescribing System
- 2.2. Integrated E-prescribing System
-
3. Delivery Mode
- 3.1. Cloud Based
- 3.2. Web Based
- 3.3. On-Premise
-
4. End Users
- 4.1. Hospitals
- 4.2. Clinics
Electronic Prescriptions Software Market Segmentation By Geography
-
1. North America
- 1.1. United States
- 1.2. Canada
- 1.3. Mexico
-
2. Europe
- 2.1. Germany
- 2.2. United Kingdom
- 2.3. France
- 2.4. Italy
- 2.5. Spain
- 2.6. Rest of Europe
-
3. Asia Pacific
- 3.1. China
- 3.2. Japan
- 3.3. India
- 3.4. Australia
- 3.5. South Korea
- 3.6. Rest of Asia Pacific
-
4. Middle East and Africa
- 4.1. GCC
- 4.2. South Africa
- 4.3. Rest of Middle East and Africa
-
5. South America
- 5.1. Brazil
- 5.2. Argentina
- 5.3. Rest of South America
Electronic Prescriptions Software Market REPORT HIGHLIGHTS
| Aspects | Details |
|---|---|
| Study Period | 2019-2033 |
| Base Year | 2024 |
| Estimated Year | 2025 |
| Forecast Period | 2025-2033 |
| Historical Period | 2019-2024 |
| Growth Rate | CAGR of 24.19% from 2019-2033 |
| Segmentation |
|
Table of Contents
- 1. Introduction
- 1.1. Research Scope
- 1.2. Market Segmentation
- 1.3. Research Methodology
- 1.4. Definitions and Assumptions
- 2. Executive Summary
- 2.1. Introduction
- 3. Market Dynamics
- 3.1. Introduction
- 3.2. Market Drivers
- 3.2.1. Minimisation of Prescription Errors; Rising Demand for E-prescription System; Better Quality of Healthcare and Cost Reduction
- 3.3. Market Restrains
- 3.3.1. Security and Workflow Issues; Lack of Skilled Personnel to Handle the Systems
- 3.4. Market Trends
- 3.4.1. Stand-alone E-prescribing System Segment is Expected to Witness Growth Over the Forecast Period
- 4. Market Factor Analysis
- 4.1. Porters Five Forces
- 4.2. Supply/Value Chain
- 4.3. PESTEL analysis
- 4.4. Market Entropy
- 4.5. Patent/Trademark Analysis
- 5. Global Electronic Prescriptions Software Market Analysis, Insights and Forecast, 2019-2031
- 5.1. Market Analysis, Insights and Forecast - by Component
- 5.1.1. Hardware
- 5.1.2. Software
- 5.1.3. Services
- 5.2. Market Analysis, Insights and Forecast - by Type of System
- 5.2.1. Stand-alone E-prescribing System
- 5.2.2. Integrated E-prescribing System
- 5.3. Market Analysis, Insights and Forecast - by Delivery Mode
- 5.3.1. Cloud Based
- 5.3.2. Web Based
- 5.3.3. On-Premise
- 5.4. Market Analysis, Insights and Forecast - by End Users
- 5.4.1. Hospitals
- 5.4.2. Clinics
- 5.5. Market Analysis, Insights and Forecast - by Region
- 5.5.1. North America
- 5.5.2. Europe
- 5.5.3. Asia Pacific
- 5.5.4. Middle East and Africa
- 5.5.5. South America
- 5.1. Market Analysis, Insights and Forecast - by Component
- 6. North America Electronic Prescriptions Software Market Analysis, Insights and Forecast, 2019-2031
- 6.1. Market Analysis, Insights and Forecast - by Component
- 6.1.1. Hardware
- 6.1.2. Software
- 6.1.3. Services
- 6.2. Market Analysis, Insights and Forecast - by Type of System
- 6.2.1. Stand-alone E-prescribing System
- 6.2.2. Integrated E-prescribing System
- 6.3. Market Analysis, Insights and Forecast - by Delivery Mode
- 6.3.1. Cloud Based
- 6.3.2. Web Based
- 6.3.3. On-Premise
- 6.4. Market Analysis, Insights and Forecast - by End Users
- 6.4.1. Hospitals
- 6.4.2. Clinics
- 6.1. Market Analysis, Insights and Forecast - by Component
- 7. Europe Electronic Prescriptions Software Market Analysis, Insights and Forecast, 2019-2031
- 7.1. Market Analysis, Insights and Forecast - by Component
- 7.1.1. Hardware
- 7.1.2. Software
- 7.1.3. Services
- 7.2. Market Analysis, Insights and Forecast - by Type of System
- 7.2.1. Stand-alone E-prescribing System
- 7.2.2. Integrated E-prescribing System
- 7.3. Market Analysis, Insights and Forecast - by Delivery Mode
- 7.3.1. Cloud Based
- 7.3.2. Web Based
- 7.3.3. On-Premise
- 7.4. Market Analysis, Insights and Forecast - by End Users
- 7.4.1. Hospitals
- 7.4.2. Clinics
- 7.1. Market Analysis, Insights and Forecast - by Component
- 8. Asia Pacific Electronic Prescriptions Software Market Analysis, Insights and Forecast, 2019-2031
- 8.1. Market Analysis, Insights and Forecast - by Component
- 8.1.1. Hardware
- 8.1.2. Software
- 8.1.3. Services
- 8.2. Market Analysis, Insights and Forecast - by Type of System
- 8.2.1. Stand-alone E-prescribing System
- 8.2.2. Integrated E-prescribing System
- 8.3. Market Analysis, Insights and Forecast - by Delivery Mode
- 8.3.1. Cloud Based
- 8.3.2. Web Based
- 8.3.3. On-Premise
- 8.4. Market Analysis, Insights and Forecast - by End Users
- 8.4.1. Hospitals
- 8.4.2. Clinics
- 8.1. Market Analysis, Insights and Forecast - by Component
- 9. Middle East and Africa Electronic Prescriptions Software Market Analysis, Insights and Forecast, 2019-2031
- 9.1. Market Analysis, Insights and Forecast - by Component
- 9.1.1. Hardware
- 9.1.2. Software
- 9.1.3. Services
- 9.2. Market Analysis, Insights and Forecast - by Type of System
- 9.2.1. Stand-alone E-prescribing System
- 9.2.2. Integrated E-prescribing System
- 9.3. Market Analysis, Insights and Forecast - by Delivery Mode
- 9.3.1. Cloud Based
- 9.3.2. Web Based
- 9.3.3. On-Premise
- 9.4. Market Analysis, Insights and Forecast - by End Users
- 9.4.1. Hospitals
- 9.4.2. Clinics
- 9.1. Market Analysis, Insights and Forecast - by Component
- 10. South America Electronic Prescriptions Software Market Analysis, Insights and Forecast, 2019-2031
- 10.1. Market Analysis, Insights and Forecast - by Component
- 10.1.1. Hardware
- 10.1.2. Software
- 10.1.3. Services
- 10.2. Market Analysis, Insights and Forecast - by Type of System
- 10.2.1. Stand-alone E-prescribing System
- 10.2.2. Integrated E-prescribing System
- 10.3. Market Analysis, Insights and Forecast - by Delivery Mode
- 10.3.1. Cloud Based
- 10.3.2. Web Based
- 10.3.3. On-Premise
- 10.4. Market Analysis, Insights and Forecast - by End Users
- 10.4.1. Hospitals
- 10.4.2. Clinics
- 10.1. Market Analysis, Insights and Forecast - by Component
- 11. North America Electronic Prescriptions Software Market Analysis, Insights and Forecast, 2019-2031
- 11.1. Market Analysis, Insights and Forecast - By Country/Sub-region
- 11.1.1 United States
- 11.1.2 Canada
- 11.1.3 Mexico
- 12. Europe Electronic Prescriptions Software Market Analysis, Insights and Forecast, 2019-2031
- 12.1. Market Analysis, Insights and Forecast - By Country/Sub-region
- 12.1.1 Germany
- 12.1.2 United Kingdom
- 12.1.3 France
- 12.1.4 Italy
- 12.1.5 Spain
- 12.1.6 Rest of Europe
- 13. Asia Pacific Electronic Prescriptions Software Market Analysis, Insights and Forecast, 2019-2031
- 13.1. Market Analysis, Insights and Forecast - By Country/Sub-region
- 13.1.1 China
- 13.1.2 Japan
- 13.1.3 India
- 13.1.4 Australia
- 13.1.5 South Korea
- 13.1.6 Rest of Asia Pacific
- 14. Middle East and Africa Electronic Prescriptions Software Market Analysis, Insights and Forecast, 2019-2031
- 14.1. Market Analysis, Insights and Forecast - By Country/Sub-region
- 14.1.1 GCC
- 14.1.2 South Africa
- 14.1.3 Rest of Middle East and Africa
- 15. South America Electronic Prescriptions Software Market Analysis, Insights and Forecast, 2019-2031
- 15.1. Market Analysis, Insights and Forecast - By Country/Sub-region
- 15.1.1 Brazil
- 15.1.2 Argentina
- 15.1.3 Rest of South America
- 16. Competitive Analysis
- 16.1. Global Market Share Analysis 2024
- 16.2. Company Profiles
- 16.2.1 eMDs Inc
- 16.2.1.1. Overview
- 16.2.1.2. Products
- 16.2.1.3. SWOT Analysis
- 16.2.1.4. Recent Developments
- 16.2.1.5. Financials (Based on Availability)
- 16.2.2 Oracle (Cerner Corporation)
- 16.2.2.1. Overview
- 16.2.2.2. Products
- 16.2.2.3. SWOT Analysis
- 16.2.2.4. Recent Developments
- 16.2.2.5. Financials (Based on Availability)
- 16.2.3 eClinicalWorks
- 16.2.3.1. Overview
- 16.2.3.2. Products
- 16.2.3.3. SWOT Analysis
- 16.2.3.4. Recent Developments
- 16.2.3.5. Financials (Based on Availability)
- 16.2.4 Surescripts
- 16.2.4.1. Overview
- 16.2.4.2. Products
- 16.2.4.3. SWOT Analysis
- 16.2.4.4. Recent Developments
- 16.2.4.5. Financials (Based on Availability)
- 16.2.5 Relayhealth Corporation
- 16.2.5.1. Overview
- 16.2.5.2. Products
- 16.2.5.3. SWOT Analysis
- 16.2.5.4. Recent Developments
- 16.2.5.5. Financials (Based on Availability)
- 16.2.6 Allscripts Healthcare Solutions Inc (Veradigm)
- 16.2.6.1. Overview
- 16.2.6.2. Products
- 16.2.6.3. SWOT Analysis
- 16.2.6.4. Recent Developments
- 16.2.6.5. Financials (Based on Availability)
- 16.2.7 NextGen Healthcare Inc
- 16.2.7.1. Overview
- 16.2.7.2. Products
- 16.2.7.3. SWOT Analysis
- 16.2.7.4. Recent Developments
- 16.2.7.5. Financials (Based on Availability)
- 16.2.8 DrFirst
- 16.2.8.1. Overview
- 16.2.8.2. Products
- 16.2.8.3. SWOT Analysis
- 16.2.8.4. Recent Developments
- 16.2.8.5. Financials (Based on Availability)
- 16.2.9 Athenahealth Inc
- 16.2.9.1. Overview
- 16.2.9.2. Products
- 16.2.9.3. SWOT Analysis
- 16.2.9.4. Recent Developments
- 16.2.9.5. Financials (Based on Availability)
- 16.2.1 eMDs Inc
List of Figures
- Figure 1: Global Electronic Prescriptions Software Market Revenue Breakdown (Million, %) by Region 2024 & 2032
- Figure 2: Global Electronic Prescriptions Software Market Volume Breakdown (K Unit, %) by Region 2024 & 2032
- Figure 3: North America Electronic Prescriptions Software Market Revenue (Million), by Country 2024 & 2032
- Figure 4: North America Electronic Prescriptions Software Market Volume (K Unit), by Country 2024 & 2032
- Figure 5: North America Electronic Prescriptions Software Market Revenue Share (%), by Country 2024 & 2032
- Figure 6: North America Electronic Prescriptions Software Market Volume Share (%), by Country 2024 & 2032
- Figure 7: Europe Electronic Prescriptions Software Market Revenue (Million), by Country 2024 & 2032
- Figure 8: Europe Electronic Prescriptions Software Market Volume (K Unit), by Country 2024 & 2032
- Figure 9: Europe Electronic Prescriptions Software Market Revenue Share (%), by Country 2024 & 2032
- Figure 10: Europe Electronic Prescriptions Software Market Volume Share (%), by Country 2024 & 2032
- Figure 11: Asia Pacific Electronic Prescriptions Software Market Revenue (Million), by Country 2024 & 2032
- Figure 12: Asia Pacific Electronic Prescriptions Software Market Volume (K Unit), by Country 2024 & 2032
- Figure 13: Asia Pacific Electronic Prescriptions Software Market Revenue Share (%), by Country 2024 & 2032
- Figure 14: Asia Pacific Electronic Prescriptions Software Market Volume Share (%), by Country 2024 & 2032
- Figure 15: Middle East and Africa Electronic Prescriptions Software Market Revenue (Million), by Country 2024 & 2032
- Figure 16: Middle East and Africa Electronic Prescriptions Software Market Volume (K Unit), by Country 2024 & 2032
- Figure 17: Middle East and Africa Electronic Prescriptions Software Market Revenue Share (%), by Country 2024 & 2032
- Figure 18: Middle East and Africa Electronic Prescriptions Software Market Volume Share (%), by Country 2024 & 2032
- Figure 19: South America Electronic Prescriptions Software Market Revenue (Million), by Country 2024 & 2032
- Figure 20: South America Electronic Prescriptions Software Market Volume (K Unit), by Country 2024 & 2032
- Figure 21: South America Electronic Prescriptions Software Market Revenue Share (%), by Country 2024 & 2032
- Figure 22: South America Electronic Prescriptions Software Market Volume Share (%), by Country 2024 & 2032
- Figure 23: North America Electronic Prescriptions Software Market Revenue (Million), by Component 2024 & 2032
- Figure 24: North America Electronic Prescriptions Software Market Volume (K Unit), by Component 2024 & 2032
- Figure 25: North America Electronic Prescriptions Software Market Revenue Share (%), by Component 2024 & 2032
- Figure 26: North America Electronic Prescriptions Software Market Volume Share (%), by Component 2024 & 2032
- Figure 27: North America Electronic Prescriptions Software Market Revenue (Million), by Type of System 2024 & 2032
- Figure 28: North America Electronic Prescriptions Software Market Volume (K Unit), by Type of System 2024 & 2032
- Figure 29: North America Electronic Prescriptions Software Market Revenue Share (%), by Type of System 2024 & 2032
- Figure 30: North America Electronic Prescriptions Software Market Volume Share (%), by Type of System 2024 & 2032
- Figure 31: North America Electronic Prescriptions Software Market Revenue (Million), by Delivery Mode 2024 & 2032
- Figure 32: North America Electronic Prescriptions Software Market Volume (K Unit), by Delivery Mode 2024 & 2032
- Figure 33: North America Electronic Prescriptions Software Market Revenue Share (%), by Delivery Mode 2024 & 2032
- Figure 34: North America Electronic Prescriptions Software Market Volume Share (%), by Delivery Mode 2024 & 2032
- Figure 35: North America Electronic Prescriptions Software Market Revenue (Million), by End Users 2024 & 2032
- Figure 36: North America Electronic Prescriptions Software Market Volume (K Unit), by End Users 2024 & 2032
- Figure 37: North America Electronic Prescriptions Software Market Revenue Share (%), by End Users 2024 & 2032
- Figure 38: North America Electronic Prescriptions Software Market Volume Share (%), by End Users 2024 & 2032
- Figure 39: North America Electronic Prescriptions Software Market Revenue (Million), by Country 2024 & 2032
- Figure 40: North America Electronic Prescriptions Software Market Volume (K Unit), by Country 2024 & 2032
- Figure 41: North America Electronic Prescriptions Software Market Revenue Share (%), by Country 2024 & 2032
- Figure 42: North America Electronic Prescriptions Software Market Volume Share (%), by Country 2024 & 2032
- Figure 43: Europe Electronic Prescriptions Software Market Revenue (Million), by Component 2024 & 2032
- Figure 44: Europe Electronic Prescriptions Software Market Volume (K Unit), by Component 2024 & 2032
- Figure 45: Europe Electronic Prescriptions Software Market Revenue Share (%), by Component 2024 & 2032
- Figure 46: Europe Electronic Prescriptions Software Market Volume Share (%), by Component 2024 & 2032
- Figure 47: Europe Electronic Prescriptions Software Market Revenue (Million), by Type of System 2024 & 2032
- Figure 48: Europe Electronic Prescriptions Software Market Volume (K Unit), by Type of System 2024 & 2032
- Figure 49: Europe Electronic Prescriptions Software Market Revenue Share (%), by Type of System 2024 & 2032
- Figure 50: Europe Electronic Prescriptions Software Market Volume Share (%), by Type of System 2024 & 2032
- Figure 51: Europe Electronic Prescriptions Software Market Revenue (Million), by Delivery Mode 2024 & 2032
- Figure 52: Europe Electronic Prescriptions Software Market Volume (K Unit), by Delivery Mode 2024 & 2032
- Figure 53: Europe Electronic Prescriptions Software Market Revenue Share (%), by Delivery Mode 2024 & 2032
- Figure 54: Europe Electronic Prescriptions Software Market Volume Share (%), by Delivery Mode 2024 & 2032
- Figure 55: Europe Electronic Prescriptions Software Market Revenue (Million), by End Users 2024 & 2032
- Figure 56: Europe Electronic Prescriptions Software Market Volume (K Unit), by End Users 2024 & 2032
- Figure 57: Europe Electronic Prescriptions Software Market Revenue Share (%), by End Users 2024 & 2032
- Figure 58: Europe Electronic Prescriptions Software Market Volume Share (%), by End Users 2024 & 2032
- Figure 59: Europe Electronic Prescriptions Software Market Revenue (Million), by Country 2024 & 2032
- Figure 60: Europe Electronic Prescriptions Software Market Volume (K Unit), by Country 2024 & 2032
- Figure 61: Europe Electronic Prescriptions Software Market Revenue Share (%), by Country 2024 & 2032
- Figure 62: Europe Electronic Prescriptions Software Market Volume Share (%), by Country 2024 & 2032
- Figure 63: Asia Pacific Electronic Prescriptions Software Market Revenue (Million), by Component 2024 & 2032
- Figure 64: Asia Pacific Electronic Prescriptions Software Market Volume (K Unit), by Component 2024 & 2032
- Figure 65: Asia Pacific Electronic Prescriptions Software Market Revenue Share (%), by Component 2024 & 2032
- Figure 66: Asia Pacific Electronic Prescriptions Software Market Volume Share (%), by Component 2024 & 2032
- Figure 67: Asia Pacific Electronic Prescriptions Software Market Revenue (Million), by Type of System 2024 & 2032
- Figure 68: Asia Pacific Electronic Prescriptions Software Market Volume (K Unit), by Type of System 2024 & 2032
- Figure 69: Asia Pacific Electronic Prescriptions Software Market Revenue Share (%), by Type of System 2024 & 2032
- Figure 70: Asia Pacific Electronic Prescriptions Software Market Volume Share (%), by Type of System 2024 & 2032
- Figure 71: Asia Pacific Electronic Prescriptions Software Market Revenue (Million), by Delivery Mode 2024 & 2032
- Figure 72: Asia Pacific Electronic Prescriptions Software Market Volume (K Unit), by Delivery Mode 2024 & 2032
- Figure 73: Asia Pacific Electronic Prescriptions Software Market Revenue Share (%), by Delivery Mode 2024 & 2032
- Figure 74: Asia Pacific Electronic Prescriptions Software Market Volume Share (%), by Delivery Mode 2024 & 2032
- Figure 75: Asia Pacific Electronic Prescriptions Software Market Revenue (Million), by End Users 2024 & 2032
- Figure 76: Asia Pacific Electronic Prescriptions Software Market Volume (K Unit), by End Users 2024 & 2032
- Figure 77: Asia Pacific Electronic Prescriptions Software Market Revenue Share (%), by End Users 2024 & 2032
- Figure 78: Asia Pacific Electronic Prescriptions Software Market Volume Share (%), by End Users 2024 & 2032
- Figure 79: Asia Pacific Electronic Prescriptions Software Market Revenue (Million), by Country 2024 & 2032
- Figure 80: Asia Pacific Electronic Prescriptions Software Market Volume (K Unit), by Country 2024 & 2032
- Figure 81: Asia Pacific Electronic Prescriptions Software Market Revenue Share (%), by Country 2024 & 2032
- Figure 82: Asia Pacific Electronic Prescriptions Software Market Volume Share (%), by Country 2024 & 2032
- Figure 83: Middle East and Africa Electronic Prescriptions Software Market Revenue (Million), by Component 2024 & 2032
- Figure 84: Middle East and Africa Electronic Prescriptions Software Market Volume (K Unit), by Component 2024 & 2032
- Figure 85: Middle East and Africa Electronic Prescriptions Software Market Revenue Share (%), by Component 2024 & 2032
- Figure 86: Middle East and Africa Electronic Prescriptions Software Market Volume Share (%), by Component 2024 & 2032
- Figure 87: Middle East and Africa Electronic Prescriptions Software Market Revenue (Million), by Type of System 2024 & 2032
- Figure 88: Middle East and Africa Electronic Prescriptions Software Market Volume (K Unit), by Type of System 2024 & 2032
- Figure 89: Middle East and Africa Electronic Prescriptions Software Market Revenue Share (%), by Type of System 2024 & 2032
- Figure 90: Middle East and Africa Electronic Prescriptions Software Market Volume Share (%), by Type of System 2024 & 2032
- Figure 91: Middle East and Africa Electronic Prescriptions Software Market Revenue (Million), by Delivery Mode 2024 & 2032
- Figure 92: Middle East and Africa Electronic Prescriptions Software Market Volume (K Unit), by Delivery Mode 2024 & 2032
- Figure 93: Middle East and Africa Electronic Prescriptions Software Market Revenue Share (%), by Delivery Mode 2024 & 2032
- Figure 94: Middle East and Africa Electronic Prescriptions Software Market Volume Share (%), by Delivery Mode 2024 & 2032
- Figure 95: Middle East and Africa Electronic Prescriptions Software Market Revenue (Million), by End Users 2024 & 2032
- Figure 96: Middle East and Africa Electronic Prescriptions Software Market Volume (K Unit), by End Users 2024 & 2032
- Figure 97: Middle East and Africa Electronic Prescriptions Software Market Revenue Share (%), by End Users 2024 & 2032
- Figure 98: Middle East and Africa Electronic Prescriptions Software Market Volume Share (%), by End Users 2024 & 2032
- Figure 99: Middle East and Africa Electronic Prescriptions Software Market Revenue (Million), by Country 2024 & 2032
- Figure 100: Middle East and Africa Electronic Prescriptions Software Market Volume (K Unit), by Country 2024 & 2032
- Figure 101: Middle East and Africa Electronic Prescriptions Software Market Revenue Share (%), by Country 2024 & 2032
- Figure 102: Middle East and Africa Electronic Prescriptions Software Market Volume Share (%), by Country 2024 & 2032
- Figure 103: South America Electronic Prescriptions Software Market Revenue (Million), by Component 2024 & 2032
- Figure 104: South America Electronic Prescriptions Software Market Volume (K Unit), by Component 2024 & 2032
- Figure 105: South America Electronic Prescriptions Software Market Revenue Share (%), by Component 2024 & 2032
- Figure 106: South America Electronic Prescriptions Software Market Volume Share (%), by Component 2024 & 2032
- Figure 107: South America Electronic Prescriptions Software Market Revenue (Million), by Type of System 2024 & 2032
- Figure 108: South America Electronic Prescriptions Software Market Volume (K Unit), by Type of System 2024 & 2032
- Figure 109: South America Electronic Prescriptions Software Market Revenue Share (%), by Type of System 2024 & 2032
- Figure 110: South America Electronic Prescriptions Software Market Volume Share (%), by Type of System 2024 & 2032
- Figure 111: South America Electronic Prescriptions Software Market Revenue (Million), by Delivery Mode 2024 & 2032
- Figure 112: South America Electronic Prescriptions Software Market Volume (K Unit), by Delivery Mode 2024 & 2032
- Figure 113: South America Electronic Prescriptions Software Market Revenue Share (%), by Delivery Mode 2024 & 2032
- Figure 114: South America Electronic Prescriptions Software Market Volume Share (%), by Delivery Mode 2024 & 2032
- Figure 115: South America Electronic Prescriptions Software Market Revenue (Million), by End Users 2024 & 2032
- Figure 116: South America Electronic Prescriptions Software Market Volume (K Unit), by End Users 2024 & 2032
- Figure 117: South America Electronic Prescriptions Software Market Revenue Share (%), by End Users 2024 & 2032
- Figure 118: South America Electronic Prescriptions Software Market Volume Share (%), by End Users 2024 & 2032
- Figure 119: South America Electronic Prescriptions Software Market Revenue (Million), by Country 2024 & 2032
- Figure 120: South America Electronic Prescriptions Software Market Volume (K Unit), by Country 2024 & 2032
- Figure 121: South America Electronic Prescriptions Software Market Revenue Share (%), by Country 2024 & 2032
- Figure 122: South America Electronic Prescriptions Software Market Volume Share (%), by Country 2024 & 2032
List of Tables
- Table 1: Global Electronic Prescriptions Software Market Revenue Million Forecast, by Region 2019 & 2032
- Table 2: Global Electronic Prescriptions Software Market Volume K Unit Forecast, by Region 2019 & 2032
- Table 3: Global Electronic Prescriptions Software Market Revenue Million Forecast, by Component 2019 & 2032
- Table 4: Global Electronic Prescriptions Software Market Volume K Unit Forecast, by Component 2019 & 2032
- Table 5: Global Electronic Prescriptions Software Market Revenue Million Forecast, by Type of System 2019 & 2032
- Table 6: Global Electronic Prescriptions Software Market Volume K Unit Forecast, by Type of System 2019 & 2032
- Table 7: Global Electronic Prescriptions Software Market Revenue Million Forecast, by Delivery Mode 2019 & 2032
- Table 8: Global Electronic Prescriptions Software Market Volume K Unit Forecast, by Delivery Mode 2019 & 2032
- Table 9: Global Electronic Prescriptions Software Market Revenue Million Forecast, by End Users 2019 & 2032
- Table 10: Global Electronic Prescriptions Software Market Volume K Unit Forecast, by End Users 2019 & 2032
- Table 11: Global Electronic Prescriptions Software Market Revenue Million Forecast, by Region 2019 & 2032
- Table 12: Global Electronic Prescriptions Software Market Volume K Unit Forecast, by Region 2019 & 2032
- Table 13: Global Electronic Prescriptions Software Market Revenue Million Forecast, by Country 2019 & 2032
- Table 14: Global Electronic Prescriptions Software Market Volume K Unit Forecast, by Country 2019 & 2032
- Table 15: United States Electronic Prescriptions Software Market Revenue (Million) Forecast, by Application 2019 & 2032
- Table 16: United States Electronic Prescriptions Software Market Volume (K Unit) Forecast, by Application 2019 & 2032
- Table 17: Canada Electronic Prescriptions Software Market Revenue (Million) Forecast, by Application 2019 & 2032
- Table 18: Canada Electronic Prescriptions Software Market Volume (K Unit) Forecast, by Application 2019 & 2032
- Table 19: Mexico Electronic Prescriptions Software Market Revenue (Million) Forecast, by Application 2019 & 2032
- Table 20: Mexico Electronic Prescriptions Software Market Volume (K Unit) Forecast, by Application 2019 & 2032
- Table 21: Global Electronic Prescriptions Software Market Revenue Million Forecast, by Country 2019 & 2032
- Table 22: Global Electronic Prescriptions Software Market Volume K Unit Forecast, by Country 2019 & 2032
- Table 23: Germany Electronic Prescriptions Software Market Revenue (Million) Forecast, by Application 2019 & 2032
- Table 24: Germany Electronic Prescriptions Software Market Volume (K Unit) Forecast, by Application 2019 & 2032
- Table 25: United Kingdom Electronic Prescriptions Software Market Revenue (Million) Forecast, by Application 2019 & 2032
- Table 26: United Kingdom Electronic Prescriptions Software Market Volume (K Unit) Forecast, by Application 2019 & 2032
- Table 27: France Electronic Prescriptions Software Market Revenue (Million) Forecast, by Application 2019 & 2032
- Table 28: France Electronic Prescriptions Software Market Volume (K Unit) Forecast, by Application 2019 & 2032
- Table 29: Italy Electronic Prescriptions Software Market Revenue (Million) Forecast, by Application 2019 & 2032
- Table 30: Italy Electronic Prescriptions Software Market Volume (K Unit) Forecast, by Application 2019 & 2032
- Table 31: Spain Electronic Prescriptions Software Market Revenue (Million) Forecast, by Application 2019 & 2032
- Table 32: Spain Electronic Prescriptions Software Market Volume (K Unit) Forecast, by Application 2019 & 2032
- Table 33: Rest of Europe Electronic Prescriptions Software Market Revenue (Million) Forecast, by Application 2019 & 2032
- Table 34: Rest of Europe Electronic Prescriptions Software Market Volume (K Unit) Forecast, by Application 2019 & 2032
- Table 35: Global Electronic Prescriptions Software Market Revenue Million Forecast, by Country 2019 & 2032
- Table 36: Global Electronic Prescriptions Software Market Volume K Unit Forecast, by Country 2019 & 2032
- Table 37: China Electronic Prescriptions Software Market Revenue (Million) Forecast, by Application 2019 & 2032
- Table 38: China Electronic Prescriptions Software Market Volume (K Unit) Forecast, by Application 2019 & 2032
- Table 39: Japan Electronic Prescriptions Software Market Revenue (Million) Forecast, by Application 2019 & 2032
- Table 40: Japan Electronic Prescriptions Software Market Volume (K Unit) Forecast, by Application 2019 & 2032
- Table 41: India Electronic Prescriptions Software Market Revenue (Million) Forecast, by Application 2019 & 2032
- Table 42: India Electronic Prescriptions Software Market Volume (K Unit) Forecast, by Application 2019 & 2032
- Table 43: Australia Electronic Prescriptions Software Market Revenue (Million) Forecast, by Application 2019 & 2032
- Table 44: Australia Electronic Prescriptions Software Market Volume (K Unit) Forecast, by Application 2019 & 2032
- Table 45: South Korea Electronic Prescriptions Software Market Revenue (Million) Forecast, by Application 2019 & 2032
- Table 46: South Korea Electronic Prescriptions Software Market Volume (K Unit) Forecast, by Application 2019 & 2032
- Table 47: Rest of Asia Pacific Electronic Prescriptions Software Market Revenue (Million) Forecast, by Application 2019 & 2032
- Table 48: Rest of Asia Pacific Electronic Prescriptions Software Market Volume (K Unit) Forecast, by Application 2019 & 2032
- Table 49: Global Electronic Prescriptions Software Market Revenue Million Forecast, by Country 2019 & 2032
- Table 50: Global Electronic Prescriptions Software Market Volume K Unit Forecast, by Country 2019 & 2032
- Table 51: GCC Electronic Prescriptions Software Market Revenue (Million) Forecast, by Application 2019 & 2032
- Table 52: GCC Electronic Prescriptions Software Market Volume (K Unit) Forecast, by Application 2019 & 2032
- Table 53: South Africa Electronic Prescriptions Software Market Revenue (Million) Forecast, by Application 2019 & 2032
- Table 54: South Africa Electronic Prescriptions Software Market Volume (K Unit) Forecast, by Application 2019 & 2032
- Table 55: Rest of Middle East and Africa Electronic Prescriptions Software Market Revenue (Million) Forecast, by Application 2019 & 2032
- Table 56: Rest of Middle East and Africa Electronic Prescriptions Software Market Volume (K Unit) Forecast, by Application 2019 & 2032
- Table 57: Global Electronic Prescriptions Software Market Revenue Million Forecast, by Country 2019 & 2032
- Table 58: Global Electronic Prescriptions Software Market Volume K Unit Forecast, by Country 2019 & 2032
- Table 59: Brazil Electronic Prescriptions Software Market Revenue (Million) Forecast, by Application 2019 & 2032
- Table 60: Brazil Electronic Prescriptions Software Market Volume (K Unit) Forecast, by Application 2019 & 2032
- Table 61: Argentina Electronic Prescriptions Software Market Revenue (Million) Forecast, by Application 2019 & 2032
- Table 62: Argentina Electronic Prescriptions Software Market Volume (K Unit) Forecast, by Application 2019 & 2032
- Table 63: Rest of South America Electronic Prescriptions Software Market Revenue (Million) Forecast, by Application 2019 & 2032
- Table 64: Rest of South America Electronic Prescriptions Software Market Volume (K Unit) Forecast, by Application 2019 & 2032
- Table 65: Global Electronic Prescriptions Software Market Revenue Million Forecast, by Component 2019 & 2032
- Table 66: Global Electronic Prescriptions Software Market Volume K Unit Forecast, by Component 2019 & 2032
- Table 67: Global Electronic Prescriptions Software Market Revenue Million Forecast, by Type of System 2019 & 2032
- Table 68: Global Electronic Prescriptions Software Market Volume K Unit Forecast, by Type of System 2019 & 2032
- Table 69: Global Electronic Prescriptions Software Market Revenue Million Forecast, by Delivery Mode 2019 & 2032
- Table 70: Global Electronic Prescriptions Software Market Volume K Unit Forecast, by Delivery Mode 2019 & 2032
- Table 71: Global Electronic Prescriptions Software Market Revenue Million Forecast, by End Users 2019 & 2032
- Table 72: Global Electronic Prescriptions Software Market Volume K Unit Forecast, by End Users 2019 & 2032
- Table 73: Global Electronic Prescriptions Software Market Revenue Million Forecast, by Country 2019 & 2032
- Table 74: Global Electronic Prescriptions Software Market Volume K Unit Forecast, by Country 2019 & 2032
- Table 75: United States Electronic Prescriptions Software Market Revenue (Million) Forecast, by Application 2019 & 2032
- Table 76: United States Electronic Prescriptions Software Market Volume (K Unit) Forecast, by Application 2019 & 2032
- Table 77: Canada Electronic Prescriptions Software Market Revenue (Million) Forecast, by Application 2019 & 2032
- Table 78: Canada Electronic Prescriptions Software Market Volume (K Unit) Forecast, by Application 2019 & 2032
- Table 79: Mexico Electronic Prescriptions Software Market Revenue (Million) Forecast, by Application 2019 & 2032
- Table 80: Mexico Electronic Prescriptions Software Market Volume (K Unit) Forecast, by Application 2019 & 2032
- Table 81: Global Electronic Prescriptions Software Market Revenue Million Forecast, by Component 2019 & 2032
- Table 82: Global Electronic Prescriptions Software Market Volume K Unit Forecast, by Component 2019 & 2032
- Table 83: Global Electronic Prescriptions Software Market Revenue Million Forecast, by Type of System 2019 & 2032
- Table 84: Global Electronic Prescriptions Software Market Volume K Unit Forecast, by Type of System 2019 & 2032
- Table 85: Global Electronic Prescriptions Software Market Revenue Million Forecast, by Delivery Mode 2019 & 2032
- Table 86: Global Electronic Prescriptions Software Market Volume K Unit Forecast, by Delivery Mode 2019 & 2032
- Table 87: Global Electronic Prescriptions Software Market Revenue Million Forecast, by End Users 2019 & 2032
- Table 88: Global Electronic Prescriptions Software Market Volume K Unit Forecast, by End Users 2019 & 2032
- Table 89: Global Electronic Prescriptions Software Market Revenue Million Forecast, by Country 2019 & 2032
- Table 90: Global Electronic Prescriptions Software Market Volume K Unit Forecast, by Country 2019 & 2032
- Table 91: Germany Electronic Prescriptions Software Market Revenue (Million) Forecast, by Application 2019 & 2032
- Table 92: Germany Electronic Prescriptions Software Market Volume (K Unit) Forecast, by Application 2019 & 2032
- Table 93: United Kingdom Electronic Prescriptions Software Market Revenue (Million) Forecast, by Application 2019 & 2032
- Table 94: United Kingdom Electronic Prescriptions Software Market Volume (K Unit) Forecast, by Application 2019 & 2032
- Table 95: France Electronic Prescriptions Software Market Revenue (Million) Forecast, by Application 2019 & 2032
- Table 96: France Electronic Prescriptions Software Market Volume (K Unit) Forecast, by Application 2019 & 2032
- Table 97: Italy Electronic Prescriptions Software Market Revenue (Million) Forecast, by Application 2019 & 2032
- Table 98: Italy Electronic Prescriptions Software Market Volume (K Unit) Forecast, by Application 2019 & 2032
- Table 99: Spain Electronic Prescriptions Software Market Revenue (Million) Forecast, by Application 2019 & 2032
- Table 100: Spain Electronic Prescriptions Software Market Volume (K Unit) Forecast, by Application 2019 & 2032
- Table 101: Rest of Europe Electronic Prescriptions Software Market Revenue (Million) Forecast, by Application 2019 & 2032
- Table 102: Rest of Europe Electronic Prescriptions Software Market Volume (K Unit) Forecast, by Application 2019 & 2032
- Table 103: Global Electronic Prescriptions Software Market Revenue Million Forecast, by Component 2019 & 2032
- Table 104: Global Electronic Prescriptions Software Market Volume K Unit Forecast, by Component 2019 & 2032
- Table 105: Global Electronic Prescriptions Software Market Revenue Million Forecast, by Type of System 2019 & 2032
- Table 106: Global Electronic Prescriptions Software Market Volume K Unit Forecast, by Type of System 2019 & 2032
- Table 107: Global Electronic Prescriptions Software Market Revenue Million Forecast, by Delivery Mode 2019 & 2032
- Table 108: Global Electronic Prescriptions Software Market Volume K Unit Forecast, by Delivery Mode 2019 & 2032
- Table 109: Global Electronic Prescriptions Software Market Revenue Million Forecast, by End Users 2019 & 2032
- Table 110: Global Electronic Prescriptions Software Market Volume K Unit Forecast, by End Users 2019 & 2032
- Table 111: Global Electronic Prescriptions Software Market Revenue Million Forecast, by Country 2019 & 2032
- Table 112: Global Electronic Prescriptions Software Market Volume K Unit Forecast, by Country 2019 & 2032
- Table 113: China Electronic Prescriptions Software Market Revenue (Million) Forecast, by Application 2019 & 2032
- Table 114: China Electronic Prescriptions Software Market Volume (K Unit) Forecast, by Application 2019 & 2032
- Table 115: Japan Electronic Prescriptions Software Market Revenue (Million) Forecast, by Application 2019 & 2032
- Table 116: Japan Electronic Prescriptions Software Market Volume (K Unit) Forecast, by Application 2019 & 2032
- Table 117: India Electronic Prescriptions Software Market Revenue (Million) Forecast, by Application 2019 & 2032
- Table 118: India Electronic Prescriptions Software Market Volume (K Unit) Forecast, by Application 2019 & 2032
- Table 119: Australia Electronic Prescriptions Software Market Revenue (Million) Forecast, by Application 2019 & 2032
- Table 120: Australia Electronic Prescriptions Software Market Volume (K Unit) Forecast, by Application 2019 & 2032
- Table 121: South Korea Electronic Prescriptions Software Market Revenue (Million) Forecast, by Application 2019 & 2032
- Table 122: South Korea Electronic Prescriptions Software Market Volume (K Unit) Forecast, by Application 2019 & 2032
- Table 123: Rest of Asia Pacific Electronic Prescriptions Software Market Revenue (Million) Forecast, by Application 2019 & 2032
- Table 124: Rest of Asia Pacific Electronic Prescriptions Software Market Volume (K Unit) Forecast, by Application 2019 & 2032
- Table 125: Global Electronic Prescriptions Software Market Revenue Million Forecast, by Component 2019 & 2032
- Table 126: Global Electronic Prescriptions Software Market Volume K Unit Forecast, by Component 2019 & 2032
- Table 127: Global Electronic Prescriptions Software Market Revenue Million Forecast, by Type of System 2019 & 2032
- Table 128: Global Electronic Prescriptions Software Market Volume K Unit Forecast, by Type of System 2019 & 2032
- Table 129: Global Electronic Prescriptions Software Market Revenue Million Forecast, by Delivery Mode 2019 & 2032
- Table 130: Global Electronic Prescriptions Software Market Volume K Unit Forecast, by Delivery Mode 2019 & 2032
- Table 131: Global Electronic Prescriptions Software Market Revenue Million Forecast, by End Users 2019 & 2032
- Table 132: Global Electronic Prescriptions Software Market Volume K Unit Forecast, by End Users 2019 & 2032
- Table 133: Global Electronic Prescriptions Software Market Revenue Million Forecast, by Country 2019 & 2032
- Table 134: Global Electronic Prescriptions Software Market Volume K Unit Forecast, by Country 2019 & 2032
- Table 135: GCC Electronic Prescriptions Software Market Revenue (Million) Forecast, by Application 2019 & 2032
- Table 136: GCC Electronic Prescriptions Software Market Volume (K Unit) Forecast, by Application 2019 & 2032
- Table 137: South Africa Electronic Prescriptions Software Market Revenue (Million) Forecast, by Application 2019 & 2032
- Table 138: South Africa Electronic Prescriptions Software Market Volume (K Unit) Forecast, by Application 2019 & 2032
- Table 139: Rest of Middle East and Africa Electronic Prescriptions Software Market Revenue (Million) Forecast, by Application 2019 & 2032
- Table 140: Rest of Middle East and Africa Electronic Prescriptions Software Market Volume (K Unit) Forecast, by Application 2019 & 2032
- Table 141: Global Electronic Prescriptions Software Market Revenue Million Forecast, by Component 2019 & 2032
- Table 142: Global Electronic Prescriptions Software Market Volume K Unit Forecast, by Component 2019 & 2032
- Table 143: Global Electronic Prescriptions Software Market Revenue Million Forecast, by Type of System 2019 & 2032
- Table 144: Global Electronic Prescriptions Software Market Volume K Unit Forecast, by Type of System 2019 & 2032
- Table 145: Global Electronic Prescriptions Software Market Revenue Million Forecast, by Delivery Mode 2019 & 2032
- Table 146: Global Electronic Prescriptions Software Market Volume K Unit Forecast, by Delivery Mode 2019 & 2032
- Table 147: Global Electronic Prescriptions Software Market Revenue Million Forecast, by End Users 2019 & 2032
- Table 148: Global Electronic Prescriptions Software Market Volume K Unit Forecast, by End Users 2019 & 2032
- Table 149: Global Electronic Prescriptions Software Market Revenue Million Forecast, by Country 2019 & 2032
- Table 150: Global Electronic Prescriptions Software Market Volume K Unit Forecast, by Country 2019 & 2032
- Table 151: Brazil Electronic Prescriptions Software Market Revenue (Million) Forecast, by Application 2019 & 2032
- Table 152: Brazil Electronic Prescriptions Software Market Volume (K Unit) Forecast, by Application 2019 & 2032
- Table 153: Argentina Electronic Prescriptions Software Market Revenue (Million) Forecast, by Application 2019 & 2032
- Table 154: Argentina Electronic Prescriptions Software Market Volume (K Unit) Forecast, by Application 2019 & 2032
- Table 155: Rest of South America Electronic Prescriptions Software Market Revenue (Million) Forecast, by Application 2019 & 2032
- Table 156: Rest of South America Electronic Prescriptions Software Market Volume (K Unit) Forecast, by Application 2019 & 2032
Frequently Asked Questions
1. What is the projected Compound Annual Growth Rate (CAGR) of the Electronic Prescriptions Software Market?
The projected CAGR is approximately 24.19%.
2. Which companies are prominent players in the Electronic Prescriptions Software Market?
Key companies in the market include eMDs Inc, Oracle (Cerner Corporation), eClinicalWorks, Surescripts, Relayhealth Corporation, Allscripts Healthcare Solutions Inc (Veradigm), NextGen Healthcare Inc, DrFirst, Athenahealth Inc.
3. What are the main segments of the Electronic Prescriptions Software Market?
The market segments include Component, Type of System, Delivery Mode, End Users.
4. Can you provide details about the market size?
The market size is estimated to be USD 3.39 Million as of 2022.
5. What are some drivers contributing to market growth?
Minimisation of Prescription Errors; Rising Demand for E-prescription System; Better Quality of Healthcare and Cost Reduction.
6. What are the notable trends driving market growth?
Stand-alone E-prescribing System Segment is Expected to Witness Growth Over the Forecast Period.
7. Are there any restraints impacting market growth?
Security and Workflow Issues; Lack of Skilled Personnel to Handle the Systems.
8. Can you provide examples of recent developments in the market?
In March 2022, FDB (First Databank, Inc.), launched FDB Vela, a new, cloud-native e-prescribing network that enables the seamless flow of critical medication prescription information, benefits verification, and clinical decision support between prescribers, payers, pharmacies, and other constituents.
9. What pricing options are available for accessing the report?
Pricing options include single-user, multi-user, and enterprise licenses priced at USD 4750, USD 5250, and USD 8750 respectively.
10. Is the market size provided in terms of value or volume?
The market size is provided in terms of value, measured in Million and volume, measured in K Unit.
11. Are there any specific market keywords associated with the report?
Yes, the market keyword associated with the report is "Electronic Prescriptions Software Market," which aids in identifying and referencing the specific market segment covered.
12. How do I determine which pricing option suits my needs best?
The pricing options vary based on user requirements and access needs. Individual users may opt for single-user licenses, while businesses requiring broader access may choose multi-user or enterprise licenses for cost-effective access to the report.
13. Are there any additional resources or data provided in the Electronic Prescriptions Software Market report?
While the report offers comprehensive insights, it's advisable to review the specific contents or supplementary materials provided to ascertain if additional resources or data are available.
14. How can I stay updated on further developments or reports in the Electronic Prescriptions Software Market?
To stay informed about further developments, trends, and reports in the Electronic Prescriptions Software Market, consider subscribing to industry newsletters, following relevant companies and organizations, or regularly checking reputable industry news sources and publications.
Methodology
Step 1 - Identification of Relevant Samples Size from Population Database


Step 2 - Approaches for Defining Global Market Size (Value, Volume* & Price*)

Note*: In applicable scenarios
Step 3 - Data Sources
Primary Research
- Web Analytics
- Survey Reports
- Research Institute
- Latest Research Reports
- Opinion Leaders
Secondary Research
- Annual Reports
- White Paper
- Latest Press Release
- Industry Association
- Paid Database
- Investor Presentations

Step 4 - Data Triangulation
Involves using different sources of information in order to increase the validity of a study
These sources are likely to be stakeholders in a program - participants, other researchers, program staff, other community members, and so on.
Then we put all data in single framework & apply various statistical tools to find out the dynamic on the market.
During the analysis stage, feedback from the stakeholder groups would be compared to determine areas of agreement as well as areas of divergence


