
Key Insights
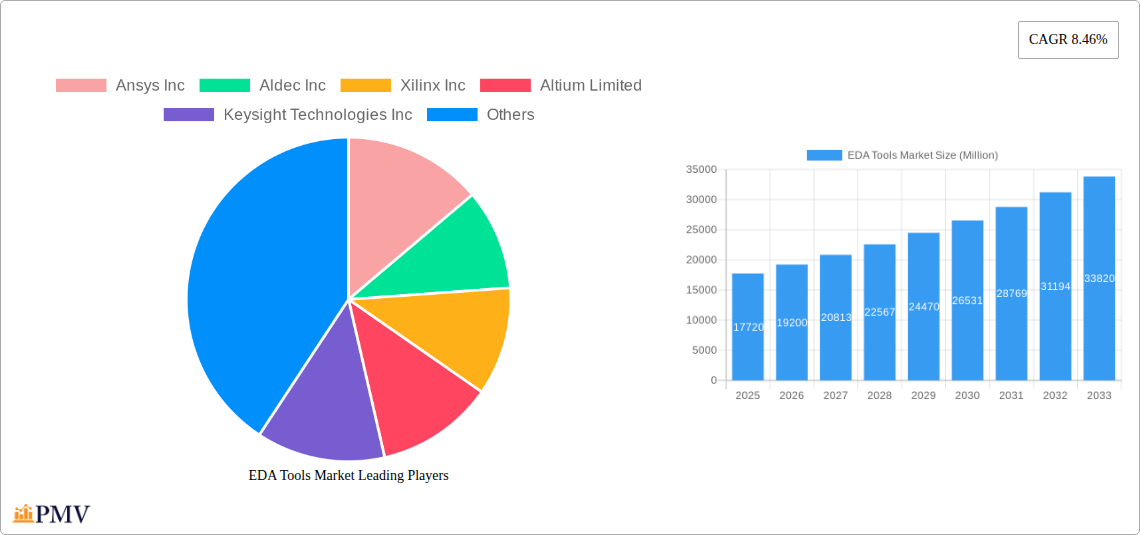
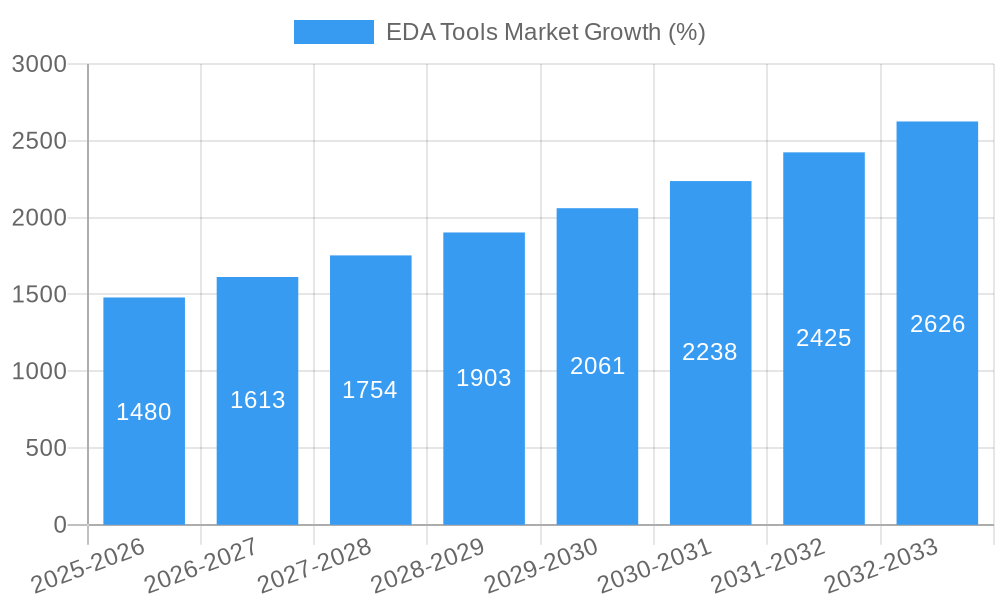
The Electronic Design Automation (EDA) tools market is experiencing robust growth, projected to reach \$17.72 billion in 2025 and maintain a Compound Annual Growth Rate (CAGR) of 8.46% from 2025 to 2033. This expansion is driven by several key factors. The increasing complexity of integrated circuits (ICs), fueled by the demand for high-performance computing, artificial intelligence, and 5G technologies, necessitates sophisticated EDA tools for design, verification, and manufacturing. Furthermore, the automotive and consumer electronics sectors are major contributors to market growth, driven by the integration of advanced electronics into vehicles and the proliferation of smart devices. The rise of the Internet of Things (IoT) further accelerates this trend, requiring efficient design tools to manage the growing number of interconnected devices. Growth is also being fueled by the adoption of advanced technologies within EDA tools themselves, such as artificial intelligence (AI) and machine learning (ML), which enhance design automation and verification processes.
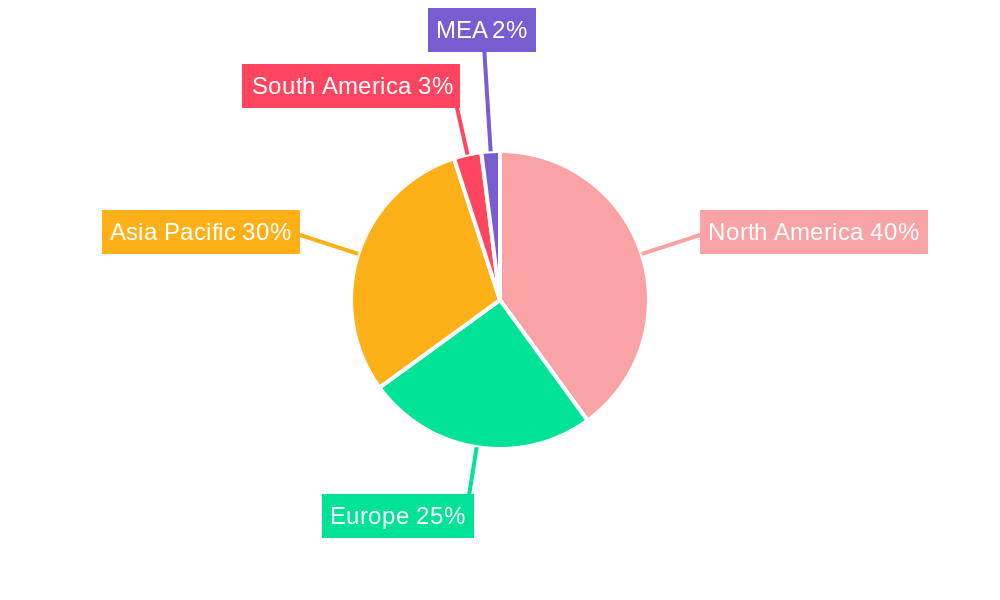
Segment-wise, Computer-aided Engineering (CAE) and IC Physical Design and Verification are expected to dominate the market, given their crucial role in chip design and manufacturing. The services segment is also poised for significant growth as companies increasingly outsource EDA tasks to specialized providers. Geographically, North America currently holds a substantial market share, driven by a strong presence of EDA tool vendors and a large base of semiconductor and electronics companies. However, the Asia-Pacific region is expected to witness the fastest growth, propelled by the expanding semiconductor manufacturing industry in countries like China, Taiwan, and South Korea. While market restraints include high software costs and the need for specialized expertise, the overall outlook for the EDA tools market remains positive, driven by technological advancements and burgeoning demand across various industries.
EDA Tools Market: A Comprehensive Report (2019-2033)
This comprehensive report provides an in-depth analysis of the EDA Tools Market, offering invaluable insights for industry stakeholders, investors, and researchers. With a study period spanning 2019-2033, a base year of 2025, and a forecast period of 2025-2033, this report meticulously examines market dynamics, growth drivers, and future trends. The market is segmented by type (Computer-aided Engineering (CAE), IC Physical Design and Verification, Printed Circuit Board and Multi-chip Module (PCB and MCM), Semiconductor Intellectual Property (SIP), Services) and application (Communication, Consumer Electronics, Automotive, Industrial, Other Applications). Key players like Ansys Inc, Aldec Inc, Xilinx Inc, Altium Limited, Keysight Technologies Inc, Mentor Graphic Corporation (Siemens PLM Software), Synopsys Inc, Cadence Design Systems Inc, Lauterbach GmbH, Agnisys Inc, and Zuken Ltd are analyzed for their market share, strategies, and contributions to innovation. The report projects a xx Million market value by 2033, with a CAGR of xx% during the forecast period.
EDA Tools Market Market Structure & Competitive Dynamics
The EDA tools market is characterized by a moderately concentrated structure, with a few dominant players holding significant market share. The market is highly innovative, driven by continuous advancements in semiconductor technology and the increasing complexity of electronic systems. Regulatory frameworks, particularly those related to intellectual property and data security, play a crucial role. Product substitutes are limited, with EDA tools being essential for the design and verification of electronic systems. End-user trends towards miniaturization, increased functionality, and improved power efficiency are key drivers of market growth. Mergers and acquisitions (M&A) are frequent, reflecting the strategic importance of EDA technology and the consolidation within the industry. The total M&A deal value in the past five years is estimated at xx Million. Key acquisitions have shaped the competitive landscape, with notable deals exceeding xx Million in value. These transactions have often involved the acquisition of specialized technology companies by larger players, allowing them to expand their product portfolios and strengthen their market positions.
- Market Concentration: High, with top 5 players holding approximately xx% of the market share.
- Innovation Ecosystems: Strong, with significant R&D investments from leading players and a vibrant ecosystem of startups and research institutions.
- M&A Activities: Frequent, with significant deal values reflecting industry consolidation and the acquisition of specialized technologies.
- Regulatory Frameworks: Impactful, particularly concerning IP protection and data security standards.
- End-User Trends: Driving demand for more advanced and efficient EDA tools.
EDA Tools Market Industry Trends & Insights
The EDA tools market is experiencing robust growth, fueled by several key trends. The increasing demand for sophisticated electronic devices across various sectors, including consumer electronics, automotive, and industrial automation, is a major driver. The rising complexity of electronic systems necessitates the use of advanced EDA tools for efficient design and verification. Technological advancements, such as the adoption of artificial intelligence (AI) and machine learning (ML) in EDA tools, are enhancing design automation and improving efficiency. Consumer preferences for smaller, faster, and more power-efficient devices further fuel the demand for sophisticated EDA solutions. The competitive landscape is dynamic, with leading companies constantly innovating and expanding their product offerings to cater to evolving market needs. The market exhibits a high barrier to entry due to the significant expertise required in software development and semiconductor design. The CAGR for the period 2025-2033 is projected to be xx%, with market penetration projected to reach xx% by 2033.
Dominant Markets & Segments in EDA Tools Market
The North American region currently holds the largest market share in the EDA tools market, driven by a strong presence of major players, significant investments in R&D, and a high concentration of semiconductor companies. Within the segment types, IC Physical Design and Verification holds the largest share, followed by Computer-aided Engineering (CAE). In terms of applications, the Communication segment dominates due to the rapid growth of the 5G and related technologies.
Key Drivers in North America: Strong presence of major players, high R&D investment, and a dense semiconductor industry.
Key Drivers in Asia-Pacific: Rapid growth of electronics manufacturing and a burgeoning semiconductor industry.
Dominant Segment (Type): IC Physical Design and Verification – due to increasing complexity of integrated circuits.
Dominant Segment (Application): Communication – driven by high demand for advanced communication technologies.
Computer-aided Engineering (CAE): This segment is experiencing steady growth driven by increased demand for simulation and modeling capabilities in various industries.
IC Physical Design and Verification: This is the largest segment, driven by rising complexity in IC design and stringent verification requirements.
Printed Circuit Board and Multi-chip Module (PCB and MCM): Growth is driven by the growing demand for high-density PCBs and MCMs in various applications.
Semiconductor Intellectual Property (SIP): This market is expanding due to growing demand for reusable IP blocks.
Services: Services like consulting, training, and support are crucial for effective EDA tool adoption.
EDA Tools Market Product Innovations
Recent innovations in EDA tools focus on incorporating AI and ML to automate design processes, improve verification efficiency, and reduce design cycle times. Cloud-based EDA platforms are gaining traction, offering scalability, accessibility, and collaboration features. The integration of advanced simulation techniques, including 3D simulations and multiphysics analysis, is another key trend, enhancing the accuracy and realism of design verification. These advancements cater to the demands of designing increasingly complex systems with stringent performance requirements, improving time-to-market and product quality.
Report Segmentation & Scope
This report provides a detailed segmentation of the EDA tools market by type and application. Each segment's growth projections, market size, and competitive dynamics are analyzed. The type segment includes Computer-aided Engineering (CAE), IC Physical Design and Verification, Printed Circuit Board and Multi-chip Module (PCB and MCM), Semiconductor Intellectual Property (SIP), and Services. The application segment includes Communication, Consumer Electronics, Automotive, Industrial, and Other Applications. Each segment's growth is influenced by specific technological advancements and industry trends, resulting in varied market dynamics and competitive landscapes within the overall EDA tools market.
Key Drivers of EDA Tools Market Growth
Several factors contribute to the growth of the EDA tools market. The increasing complexity of electronic systems necessitates sophisticated design and verification tools. The rising demand for smaller, faster, and more power-efficient devices drives innovation in EDA tools. Advancements in semiconductor technology, such as the adoption of advanced nodes and 3D packaging, further fuel the demand for advanced EDA solutions. Government initiatives to promote the growth of the semiconductor industry, coupled with increasing R&D spending by major companies, are also key drivers.
Challenges in the EDA Tools Market Sector
The EDA tools market faces challenges such as the high cost of software licenses, the need for specialized expertise, and the complexities involved in integrating different EDA tools. The rapid pace of technological change necessitates continuous investments in upgrading software and training personnel. Competition among major players is intense, placing pressure on pricing and profitability. The impact of these challenges is a reduction in market penetration and increased customer acquisition costs for emerging players.
Leading Players in the EDA Tools Market Market
- Ansys Inc
- Aldec Inc
- Xilinx Inc
- Altium Limited
- Keysight Technologies Inc
- Mentor Graphic Corporation (Siemens PLM Software)
- Synopsys Inc
- Cadence Design Systems Inc
- Lauterbach GmbH
- Agnisys Inc
- Zuken Ltd
Key Developments in EDA Tools Market Sector
- July 2022: Cadence Design Systems, Inc. finalized the acquisition of Future Facilities, bolstering its capabilities in CFD and multiphysics system analysis.
- April 2022: Keysight Technologies, Inc. joined the Si2 TITAN council, contributing expertise in RF and microwave applications.
- May 2021: Siemens acquired Fractal Technologies, enhancing its IC verification offerings.
- May 2021: Keysight Technologies Inc. acquired Quantum Benchmark, expanding into quantum computing software solutions.
Strategic EDA Tools Market Market Outlook
The future of the EDA tools market is bright, driven by the continued growth of the electronics industry and ongoing advancements in semiconductor technology. The increasing adoption of AI and ML in EDA tools will lead to further automation and efficiency improvements. The emergence of new applications, such as quantum computing, will create new opportunities for EDA tool vendors. Strategic partnerships and collaborations between EDA tool vendors and semiconductor companies will be crucial for driving innovation and expanding market reach. The market is poised for significant growth, with opportunities for both established players and new entrants.
EDA Tools Market Segmentation
-
1. Type
- 1.1. Computer-aided Engineering (CAE)
- 1.2. IC Physical Design and Verification
- 1.3. Printed
- 1.4. Semiconductor Intellectual Property (SIP)
- 1.5. Services
-
2. Application
- 2.1. Communication
- 2.2. Consumer Electronics
- 2.3. Automotive
- 2.4. Industrial
- 2.5. Other Applications
-
3. End-user
- 3.1. Semiconductor manufacturers
- 3.2. Electronics manufacturers
- 3.3. Design houses
- 3.4. Research institutions
EDA Tools Market Segmentation By Geography
- 1. North America
- 2. Europe
- 3. Asia Pacific
- 4. Rest of the World
EDA Tools Market REPORT HIGHLIGHTS
| Aspects | Details |
|---|---|
| Study Period | 2019-2033 |
| Base Year | 2024 |
| Estimated Year | 2025 |
| Forecast Period | 2025-2033 |
| Historical Period | 2019-2024 |
| Growth Rate | CAGR of 8.46% from 2019-2033 |
| Segmentation |
|
Table of Contents
- 1. Introduction
- 1.1. Research Scope
- 1.2. Market Segmentation
- 1.3. Research Methodology
- 1.4. Definitions and Assumptions
- 2. Executive Summary
- 2.1. Introduction
- 3. Market Dynamics
- 3.1. Introduction
- 3.2. Market Drivers
- 3.2.1 Booming Automotive
- 3.2.2 IoT
- 3.2.3 and AI Sectors; Upcoming Trend of EDA Toolsets Equipped with Machine Learning Capabilities
- 3.3. Market Restrains
- 3.3.1. Moore's Law about to be Proven Faulty
- 3.4. Market Trends
- 3.4.1. IC Physical Design and Verification Segment to Grow Significantly
- 4. Market Factor Analysis
- 4.1. Porters Five Forces
- 4.2. Supply/Value Chain
- 4.3. PESTEL analysis
- 4.4. Market Entropy
- 4.5. Patent/Trademark Analysis
- 5. Global EDA Tools Market Analysis, Insights and Forecast, 2019-2031
- 5.1. Market Analysis, Insights and Forecast - by Type
- 5.1.1. Computer-aided Engineering (CAE)
- 5.1.2. IC Physical Design and Verification
- 5.1.3. Printed
- 5.1.4. Semiconductor Intellectual Property (SIP)
- 5.1.5. Services
- 5.2. Market Analysis, Insights and Forecast - by Application
- 5.2.1. Communication
- 5.2.2. Consumer Electronics
- 5.2.3. Automotive
- 5.2.4. Industrial
- 5.2.5. Other Applications
- 5.3. Market Analysis, Insights and Forecast - by End-user
- 5.3.1. Semiconductor manufacturers
- 5.3.2. Electronics manufacturers
- 5.3.3. Design houses
- 5.3.4. Research institutions
- 5.4. Market Analysis, Insights and Forecast - by Region
- 5.4.1. North America
- 5.4.2. Europe
- 5.4.3. Asia Pacific
- 5.4.4. Rest of the World
- 5.1. Market Analysis, Insights and Forecast - by Type
- 6. North America EDA Tools Market Analysis, Insights and Forecast, 2019-2031
- 6.1. Market Analysis, Insights and Forecast - by Type
- 6.1.1. Computer-aided Engineering (CAE)
- 6.1.2. IC Physical Design and Verification
- 6.1.3. Printed
- 6.1.4. Semiconductor Intellectual Property (SIP)
- 6.1.5. Services
- 6.2. Market Analysis, Insights and Forecast - by Application
- 6.2.1. Communication
- 6.2.2. Consumer Electronics
- 6.2.3. Automotive
- 6.2.4. Industrial
- 6.2.5. Other Applications
- 6.3. Market Analysis, Insights and Forecast - by End-user
- 6.3.1. Semiconductor manufacturers
- 6.3.2. Electronics manufacturers
- 6.3.3. Design houses
- 6.3.4. Research institutions
- 6.1. Market Analysis, Insights and Forecast - by Type
- 7. Europe EDA Tools Market Analysis, Insights and Forecast, 2019-2031
- 7.1. Market Analysis, Insights and Forecast - by Type
- 7.1.1. Computer-aided Engineering (CAE)
- 7.1.2. IC Physical Design and Verification
- 7.1.3. Printed
- 7.1.4. Semiconductor Intellectual Property (SIP)
- 7.1.5. Services
- 7.2. Market Analysis, Insights and Forecast - by Application
- 7.2.1. Communication
- 7.2.2. Consumer Electronics
- 7.2.3. Automotive
- 7.2.4. Industrial
- 7.2.5. Other Applications
- 7.3. Market Analysis, Insights and Forecast - by End-user
- 7.3.1. Semiconductor manufacturers
- 7.3.2. Electronics manufacturers
- 7.3.3. Design houses
- 7.3.4. Research institutions
- 7.1. Market Analysis, Insights and Forecast - by Type
- 8. Asia Pacific EDA Tools Market Analysis, Insights and Forecast, 2019-2031
- 8.1. Market Analysis, Insights and Forecast - by Type
- 8.1.1. Computer-aided Engineering (CAE)
- 8.1.2. IC Physical Design and Verification
- 8.1.3. Printed
- 8.1.4. Semiconductor Intellectual Property (SIP)
- 8.1.5. Services
- 8.2. Market Analysis, Insights and Forecast - by Application
- 8.2.1. Communication
- 8.2.2. Consumer Electronics
- 8.2.3. Automotive
- 8.2.4. Industrial
- 8.2.5. Other Applications
- 8.3. Market Analysis, Insights and Forecast - by End-user
- 8.3.1. Semiconductor manufacturers
- 8.3.2. Electronics manufacturers
- 8.3.3. Design houses
- 8.3.4. Research institutions
- 8.1. Market Analysis, Insights and Forecast - by Type
- 9. Rest of the World EDA Tools Market Analysis, Insights and Forecast, 2019-2031
- 9.1. Market Analysis, Insights and Forecast - by Type
- 9.1.1. Computer-aided Engineering (CAE)
- 9.1.2. IC Physical Design and Verification
- 9.1.3. Printed
- 9.1.4. Semiconductor Intellectual Property (SIP)
- 9.1.5. Services
- 9.2. Market Analysis, Insights and Forecast - by Application
- 9.2.1. Communication
- 9.2.2. Consumer Electronics
- 9.2.3. Automotive
- 9.2.4. Industrial
- 9.2.5. Other Applications
- 9.3. Market Analysis, Insights and Forecast - by End-user
- 9.3.1. Semiconductor manufacturers
- 9.3.2. Electronics manufacturers
- 9.3.3. Design houses
- 9.3.4. Research institutions
- 9.1. Market Analysis, Insights and Forecast - by Type
- 10. North America EDA Tools Market Analysis, Insights and Forecast, 2019-2031
- 10.1. Market Analysis, Insights and Forecast - By Country/Sub-region
- 10.1.1 United States
- 10.1.2 Canada
- 10.1.3 Mexico
- 11. Europe EDA Tools Market Analysis, Insights and Forecast, 2019-2031
- 11.1. Market Analysis, Insights and Forecast - By Country/Sub-region
- 11.1.1 Germany
- 11.1.2 United Kingdom
- 11.1.3 France
- 11.1.4 Spain
- 11.1.5 Italy
- 11.1.6 Spain
- 11.1.7 Belgium
- 11.1.8 Netherland
- 11.1.9 Nordics
- 11.1.10 Rest of Europe
- 12. Asia Pacific EDA Tools Market Analysis, Insights and Forecast, 2019-2031
- 12.1. Market Analysis, Insights and Forecast - By Country/Sub-region
- 12.1.1 China
- 12.1.2 Japan
- 12.1.3 India
- 12.1.4 South Korea
- 12.1.5 Southeast Asia
- 12.1.6 Australia
- 12.1.7 Indonesia
- 12.1.8 Phillipes
- 12.1.9 Singapore
- 12.1.10 Thailandc
- 12.1.11 Rest of Asia Pacific
- 13. South America EDA Tools Market Analysis, Insights and Forecast, 2019-2031
- 13.1. Market Analysis, Insights and Forecast - By Country/Sub-region
- 13.1.1 Brazil
- 13.1.2 Argentina
- 13.1.3 Peru
- 13.1.4 Chile
- 13.1.5 Colombia
- 13.1.6 Ecuador
- 13.1.7 Venezuela
- 13.1.8 Rest of South America
- 14. North America EDA Tools Market Analysis, Insights and Forecast, 2019-2031
- 14.1. Market Analysis, Insights and Forecast - By Country/Sub-region
- 14.1.1 United States
- 14.1.2 Canada
- 14.1.3 Mexico
- 15. MEA EDA Tools Market Analysis, Insights and Forecast, 2019-2031
- 15.1. Market Analysis, Insights and Forecast - By Country/Sub-region
- 15.1.1 United Arab Emirates
- 15.1.2 Saudi Arabia
- 15.1.3 South Africa
- 15.1.4 Rest of Middle East and Africa
- 16. Competitive Analysis
- 16.1. Global Market Share Analysis 2024
- 16.2. Company Profiles
- 16.2.1 Ansys Inc
- 16.2.1.1. Overview
- 16.2.1.2. Products
- 16.2.1.3. SWOT Analysis
- 16.2.1.4. Recent Developments
- 16.2.1.5. Financials (Based on Availability)
- 16.2.2 Aldec Inc
- 16.2.2.1. Overview
- 16.2.2.2. Products
- 16.2.2.3. SWOT Analysis
- 16.2.2.4. Recent Developments
- 16.2.2.5. Financials (Based on Availability)
- 16.2.3 Xilinx Inc
- 16.2.3.1. Overview
- 16.2.3.2. Products
- 16.2.3.3. SWOT Analysis
- 16.2.3.4. Recent Developments
- 16.2.3.5. Financials (Based on Availability)
- 16.2.4 Altium Limited
- 16.2.4.1. Overview
- 16.2.4.2. Products
- 16.2.4.3. SWOT Analysis
- 16.2.4.4. Recent Developments
- 16.2.4.5. Financials (Based on Availability)
- 16.2.5 Keysight Technologies Inc
- 16.2.5.1. Overview
- 16.2.5.2. Products
- 16.2.5.3. SWOT Analysis
- 16.2.5.4. Recent Developments
- 16.2.5.5. Financials (Based on Availability)
- 16.2.6 Mentor Graphic Corporation (Siemens PLM Software)
- 16.2.6.1. Overview
- 16.2.6.2. Products
- 16.2.6.3. SWOT Analysis
- 16.2.6.4. Recent Developments
- 16.2.6.5. Financials (Based on Availability)
- 16.2.7 Synopsys Inc
- 16.2.7.1. Overview
- 16.2.7.2. Products
- 16.2.7.3. SWOT Analysis
- 16.2.7.4. Recent Developments
- 16.2.7.5. Financials (Based on Availability)
- 16.2.8 Cadence Design Systems Inc
- 16.2.8.1. Overview
- 16.2.8.2. Products
- 16.2.8.3. SWOT Analysis
- 16.2.8.4. Recent Developments
- 16.2.8.5. Financials (Based on Availability)
- 16.2.9 Lauterbach GmbH
- 16.2.9.1. Overview
- 16.2.9.2. Products
- 16.2.9.3. SWOT Analysis
- 16.2.9.4. Recent Developments
- 16.2.9.5. Financials (Based on Availability)
- 16.2.10 Agnisys Inc
- 16.2.10.1. Overview
- 16.2.10.2. Products
- 16.2.10.3. SWOT Analysis
- 16.2.10.4. Recent Developments
- 16.2.10.5. Financials (Based on Availability)
- 16.2.11 Zuken Ltd
- 16.2.11.1. Overview
- 16.2.11.2. Products
- 16.2.11.3. SWOT Analysis
- 16.2.11.4. Recent Developments
- 16.2.11.5. Financials (Based on Availability)
- 16.2.1 Ansys Inc
List of Figures
- Figure 1: Global EDA Tools Market Revenue Breakdown (Million, %) by Region 2024 & 2032
- Figure 2: Global EDA Tools Market Volume Breakdown (K Unit, %) by Region 2024 & 2032
- Figure 3: North America EDA Tools Market Revenue (Million), by Country 2024 & 2032
- Figure 4: North America EDA Tools Market Volume (K Unit), by Country 2024 & 2032
- Figure 5: North America EDA Tools Market Revenue Share (%), by Country 2024 & 2032
- Figure 6: North America EDA Tools Market Volume Share (%), by Country 2024 & 2032
- Figure 7: Europe EDA Tools Market Revenue (Million), by Country 2024 & 2032
- Figure 8: Europe EDA Tools Market Volume (K Unit), by Country 2024 & 2032
- Figure 9: Europe EDA Tools Market Revenue Share (%), by Country 2024 & 2032
- Figure 10: Europe EDA Tools Market Volume Share (%), by Country 2024 & 2032
- Figure 11: Asia Pacific EDA Tools Market Revenue (Million), by Country 2024 & 2032
- Figure 12: Asia Pacific EDA Tools Market Volume (K Unit), by Country 2024 & 2032
- Figure 13: Asia Pacific EDA Tools Market Revenue Share (%), by Country 2024 & 2032
- Figure 14: Asia Pacific EDA Tools Market Volume Share (%), by Country 2024 & 2032
- Figure 15: South America EDA Tools Market Revenue (Million), by Country 2024 & 2032
- Figure 16: South America EDA Tools Market Volume (K Unit), by Country 2024 & 2032
- Figure 17: South America EDA Tools Market Revenue Share (%), by Country 2024 & 2032
- Figure 18: South America EDA Tools Market Volume Share (%), by Country 2024 & 2032
- Figure 19: North America EDA Tools Market Revenue (Million), by Country 2024 & 2032
- Figure 20: North America EDA Tools Market Volume (K Unit), by Country 2024 & 2032
- Figure 21: North America EDA Tools Market Revenue Share (%), by Country 2024 & 2032
- Figure 22: North America EDA Tools Market Volume Share (%), by Country 2024 & 2032
- Figure 23: MEA EDA Tools Market Revenue (Million), by Country 2024 & 2032
- Figure 24: MEA EDA Tools Market Volume (K Unit), by Country 2024 & 2032
- Figure 25: MEA EDA Tools Market Revenue Share (%), by Country 2024 & 2032
- Figure 26: MEA EDA Tools Market Volume Share (%), by Country 2024 & 2032
- Figure 27: North America EDA Tools Market Revenue (Million), by Type 2024 & 2032
- Figure 28: North America EDA Tools Market Volume (K Unit), by Type 2024 & 2032
- Figure 29: North America EDA Tools Market Revenue Share (%), by Type 2024 & 2032
- Figure 30: North America EDA Tools Market Volume Share (%), by Type 2024 & 2032
- Figure 31: North America EDA Tools Market Revenue (Million), by Application 2024 & 2032
- Figure 32: North America EDA Tools Market Volume (K Unit), by Application 2024 & 2032
- Figure 33: North America EDA Tools Market Revenue Share (%), by Application 2024 & 2032
- Figure 34: North America EDA Tools Market Volume Share (%), by Application 2024 & 2032
- Figure 35: North America EDA Tools Market Revenue (Million), by End-user 2024 & 2032
- Figure 36: North America EDA Tools Market Volume (K Unit), by End-user 2024 & 2032
- Figure 37: North America EDA Tools Market Revenue Share (%), by End-user 2024 & 2032
- Figure 38: North America EDA Tools Market Volume Share (%), by End-user 2024 & 2032
- Figure 39: North America EDA Tools Market Revenue (Million), by Country 2024 & 2032
- Figure 40: North America EDA Tools Market Volume (K Unit), by Country 2024 & 2032
- Figure 41: North America EDA Tools Market Revenue Share (%), by Country 2024 & 2032
- Figure 42: North America EDA Tools Market Volume Share (%), by Country 2024 & 2032
- Figure 43: Europe EDA Tools Market Revenue (Million), by Type 2024 & 2032
- Figure 44: Europe EDA Tools Market Volume (K Unit), by Type 2024 & 2032
- Figure 45: Europe EDA Tools Market Revenue Share (%), by Type 2024 & 2032
- Figure 46: Europe EDA Tools Market Volume Share (%), by Type 2024 & 2032
- Figure 47: Europe EDA Tools Market Revenue (Million), by Application 2024 & 2032
- Figure 48: Europe EDA Tools Market Volume (K Unit), by Application 2024 & 2032
- Figure 49: Europe EDA Tools Market Revenue Share (%), by Application 2024 & 2032
- Figure 50: Europe EDA Tools Market Volume Share (%), by Application 2024 & 2032
- Figure 51: Europe EDA Tools Market Revenue (Million), by End-user 2024 & 2032
- Figure 52: Europe EDA Tools Market Volume (K Unit), by End-user 2024 & 2032
- Figure 53: Europe EDA Tools Market Revenue Share (%), by End-user 2024 & 2032
- Figure 54: Europe EDA Tools Market Volume Share (%), by End-user 2024 & 2032
- Figure 55: Europe EDA Tools Market Revenue (Million), by Country 2024 & 2032
- Figure 56: Europe EDA Tools Market Volume (K Unit), by Country 2024 & 2032
- Figure 57: Europe EDA Tools Market Revenue Share (%), by Country 2024 & 2032
- Figure 58: Europe EDA Tools Market Volume Share (%), by Country 2024 & 2032
- Figure 59: Asia Pacific EDA Tools Market Revenue (Million), by Type 2024 & 2032
- Figure 60: Asia Pacific EDA Tools Market Volume (K Unit), by Type 2024 & 2032
- Figure 61: Asia Pacific EDA Tools Market Revenue Share (%), by Type 2024 & 2032
- Figure 62: Asia Pacific EDA Tools Market Volume Share (%), by Type 2024 & 2032
- Figure 63: Asia Pacific EDA Tools Market Revenue (Million), by Application 2024 & 2032
- Figure 64: Asia Pacific EDA Tools Market Volume (K Unit), by Application 2024 & 2032
- Figure 65: Asia Pacific EDA Tools Market Revenue Share (%), by Application 2024 & 2032
- Figure 66: Asia Pacific EDA Tools Market Volume Share (%), by Application 2024 & 2032
- Figure 67: Asia Pacific EDA Tools Market Revenue (Million), by End-user 2024 & 2032
- Figure 68: Asia Pacific EDA Tools Market Volume (K Unit), by End-user 2024 & 2032
- Figure 69: Asia Pacific EDA Tools Market Revenue Share (%), by End-user 2024 & 2032
- Figure 70: Asia Pacific EDA Tools Market Volume Share (%), by End-user 2024 & 2032
- Figure 71: Asia Pacific EDA Tools Market Revenue (Million), by Country 2024 & 2032
- Figure 72: Asia Pacific EDA Tools Market Volume (K Unit), by Country 2024 & 2032
- Figure 73: Asia Pacific EDA Tools Market Revenue Share (%), by Country 2024 & 2032
- Figure 74: Asia Pacific EDA Tools Market Volume Share (%), by Country 2024 & 2032
- Figure 75: Rest of the World EDA Tools Market Revenue (Million), by Type 2024 & 2032
- Figure 76: Rest of the World EDA Tools Market Volume (K Unit), by Type 2024 & 2032
- Figure 77: Rest of the World EDA Tools Market Revenue Share (%), by Type 2024 & 2032
- Figure 78: Rest of the World EDA Tools Market Volume Share (%), by Type 2024 & 2032
- Figure 79: Rest of the World EDA Tools Market Revenue (Million), by Application 2024 & 2032
- Figure 80: Rest of the World EDA Tools Market Volume (K Unit), by Application 2024 & 2032
- Figure 81: Rest of the World EDA Tools Market Revenue Share (%), by Application 2024 & 2032
- Figure 82: Rest of the World EDA Tools Market Volume Share (%), by Application 2024 & 2032
- Figure 83: Rest of the World EDA Tools Market Revenue (Million), by End-user 2024 & 2032
- Figure 84: Rest of the World EDA Tools Market Volume (K Unit), by End-user 2024 & 2032
- Figure 85: Rest of the World EDA Tools Market Revenue Share (%), by End-user 2024 & 2032
- Figure 86: Rest of the World EDA Tools Market Volume Share (%), by End-user 2024 & 2032
- Figure 87: Rest of the World EDA Tools Market Revenue (Million), by Country 2024 & 2032
- Figure 88: Rest of the World EDA Tools Market Volume (K Unit), by Country 2024 & 2032
- Figure 89: Rest of the World EDA Tools Market Revenue Share (%), by Country 2024 & 2032
- Figure 90: Rest of the World EDA Tools Market Volume Share (%), by Country 2024 & 2032
List of Tables
- Table 1: Global EDA Tools Market Revenue Million Forecast, by Region 2019 & 2032
- Table 2: Global EDA Tools Market Volume K Unit Forecast, by Region 2019 & 2032
- Table 3: Global EDA Tools Market Revenue Million Forecast, by Type 2019 & 2032
- Table 4: Global EDA Tools Market Volume K Unit Forecast, by Type 2019 & 2032
- Table 5: Global EDA Tools Market Revenue Million Forecast, by Application 2019 & 2032
- Table 6: Global EDA Tools Market Volume K Unit Forecast, by Application 2019 & 2032
- Table 7: Global EDA Tools Market Revenue Million Forecast, by End-user 2019 & 2032
- Table 8: Global EDA Tools Market Volume K Unit Forecast, by End-user 2019 & 2032
- Table 9: Global EDA Tools Market Revenue Million Forecast, by Region 2019 & 2032
- Table 10: Global EDA Tools Market Volume K Unit Forecast, by Region 2019 & 2032
- Table 11: Global EDA Tools Market Revenue Million Forecast, by Country 2019 & 2032
- Table 12: Global EDA Tools Market Volume K Unit Forecast, by Country 2019 & 2032
- Table 13: United States EDA Tools Market Revenue (Million) Forecast, by Application 2019 & 2032
- Table 14: United States EDA Tools Market Volume (K Unit) Forecast, by Application 2019 & 2032
- Table 15: Canada EDA Tools Market Revenue (Million) Forecast, by Application 2019 & 2032
- Table 16: Canada EDA Tools Market Volume (K Unit) Forecast, by Application 2019 & 2032
- Table 17: Mexico EDA Tools Market Revenue (Million) Forecast, by Application 2019 & 2032
- Table 18: Mexico EDA Tools Market Volume (K Unit) Forecast, by Application 2019 & 2032
- Table 19: Global EDA Tools Market Revenue Million Forecast, by Country 2019 & 2032
- Table 20: Global EDA Tools Market Volume K Unit Forecast, by Country 2019 & 2032
- Table 21: Germany EDA Tools Market Revenue (Million) Forecast, by Application 2019 & 2032
- Table 22: Germany EDA Tools Market Volume (K Unit) Forecast, by Application 2019 & 2032
- Table 23: United Kingdom EDA Tools Market Revenue (Million) Forecast, by Application 2019 & 2032
- Table 24: United Kingdom EDA Tools Market Volume (K Unit) Forecast, by Application 2019 & 2032
- Table 25: France EDA Tools Market Revenue (Million) Forecast, by Application 2019 & 2032
- Table 26: France EDA Tools Market Volume (K Unit) Forecast, by Application 2019 & 2032
- Table 27: Spain EDA Tools Market Revenue (Million) Forecast, by Application 2019 & 2032
- Table 28: Spain EDA Tools Market Volume (K Unit) Forecast, by Application 2019 & 2032
- Table 29: Italy EDA Tools Market Revenue (Million) Forecast, by Application 2019 & 2032
- Table 30: Italy EDA Tools Market Volume (K Unit) Forecast, by Application 2019 & 2032
- Table 31: Spain EDA Tools Market Revenue (Million) Forecast, by Application 2019 & 2032
- Table 32: Spain EDA Tools Market Volume (K Unit) Forecast, by Application 2019 & 2032
- Table 33: Belgium EDA Tools Market Revenue (Million) Forecast, by Application 2019 & 2032
- Table 34: Belgium EDA Tools Market Volume (K Unit) Forecast, by Application 2019 & 2032
- Table 35: Netherland EDA Tools Market Revenue (Million) Forecast, by Application 2019 & 2032
- Table 36: Netherland EDA Tools Market Volume (K Unit) Forecast, by Application 2019 & 2032
- Table 37: Nordics EDA Tools Market Revenue (Million) Forecast, by Application 2019 & 2032
- Table 38: Nordics EDA Tools Market Volume (K Unit) Forecast, by Application 2019 & 2032
- Table 39: Rest of Europe EDA Tools Market Revenue (Million) Forecast, by Application 2019 & 2032
- Table 40: Rest of Europe EDA Tools Market Volume (K Unit) Forecast, by Application 2019 & 2032
- Table 41: Global EDA Tools Market Revenue Million Forecast, by Country 2019 & 2032
- Table 42: Global EDA Tools Market Volume K Unit Forecast, by Country 2019 & 2032
- Table 43: China EDA Tools Market Revenue (Million) Forecast, by Application 2019 & 2032
- Table 44: China EDA Tools Market Volume (K Unit) Forecast, by Application 2019 & 2032
- Table 45: Japan EDA Tools Market Revenue (Million) Forecast, by Application 2019 & 2032
- Table 46: Japan EDA Tools Market Volume (K Unit) Forecast, by Application 2019 & 2032
- Table 47: India EDA Tools Market Revenue (Million) Forecast, by Application 2019 & 2032
- Table 48: India EDA Tools Market Volume (K Unit) Forecast, by Application 2019 & 2032
- Table 49: South Korea EDA Tools Market Revenue (Million) Forecast, by Application 2019 & 2032
- Table 50: South Korea EDA Tools Market Volume (K Unit) Forecast, by Application 2019 & 2032
- Table 51: Southeast Asia EDA Tools Market Revenue (Million) Forecast, by Application 2019 & 2032
- Table 52: Southeast Asia EDA Tools Market Volume (K Unit) Forecast, by Application 2019 & 2032
- Table 53: Australia EDA Tools Market Revenue (Million) Forecast, by Application 2019 & 2032
- Table 54: Australia EDA Tools Market Volume (K Unit) Forecast, by Application 2019 & 2032
- Table 55: Indonesia EDA Tools Market Revenue (Million) Forecast, by Application 2019 & 2032
- Table 56: Indonesia EDA Tools Market Volume (K Unit) Forecast, by Application 2019 & 2032
- Table 57: Phillipes EDA Tools Market Revenue (Million) Forecast, by Application 2019 & 2032
- Table 58: Phillipes EDA Tools Market Volume (K Unit) Forecast, by Application 2019 & 2032
- Table 59: Singapore EDA Tools Market Revenue (Million) Forecast, by Application 2019 & 2032
- Table 60: Singapore EDA Tools Market Volume (K Unit) Forecast, by Application 2019 & 2032
- Table 61: Thailandc EDA Tools Market Revenue (Million) Forecast, by Application 2019 & 2032
- Table 62: Thailandc EDA Tools Market Volume (K Unit) Forecast, by Application 2019 & 2032
- Table 63: Rest of Asia Pacific EDA Tools Market Revenue (Million) Forecast, by Application 2019 & 2032
- Table 64: Rest of Asia Pacific EDA Tools Market Volume (K Unit) Forecast, by Application 2019 & 2032
- Table 65: Global EDA Tools Market Revenue Million Forecast, by Country 2019 & 2032
- Table 66: Global EDA Tools Market Volume K Unit Forecast, by Country 2019 & 2032
- Table 67: Brazil EDA Tools Market Revenue (Million) Forecast, by Application 2019 & 2032
- Table 68: Brazil EDA Tools Market Volume (K Unit) Forecast, by Application 2019 & 2032
- Table 69: Argentina EDA Tools Market Revenue (Million) Forecast, by Application 2019 & 2032
- Table 70: Argentina EDA Tools Market Volume (K Unit) Forecast, by Application 2019 & 2032
- Table 71: Peru EDA Tools Market Revenue (Million) Forecast, by Application 2019 & 2032
- Table 72: Peru EDA Tools Market Volume (K Unit) Forecast, by Application 2019 & 2032
- Table 73: Chile EDA Tools Market Revenue (Million) Forecast, by Application 2019 & 2032
- Table 74: Chile EDA Tools Market Volume (K Unit) Forecast, by Application 2019 & 2032
- Table 75: Colombia EDA Tools Market Revenue (Million) Forecast, by Application 2019 & 2032
- Table 76: Colombia EDA Tools Market Volume (K Unit) Forecast, by Application 2019 & 2032
- Table 77: Ecuador EDA Tools Market Revenue (Million) Forecast, by Application 2019 & 2032
- Table 78: Ecuador EDA Tools Market Volume (K Unit) Forecast, by Application 2019 & 2032
- Table 79: Venezuela EDA Tools Market Revenue (Million) Forecast, by Application 2019 & 2032
- Table 80: Venezuela EDA Tools Market Volume (K Unit) Forecast, by Application 2019 & 2032
- Table 81: Rest of South America EDA Tools Market Revenue (Million) Forecast, by Application 2019 & 2032
- Table 82: Rest of South America EDA Tools Market Volume (K Unit) Forecast, by Application 2019 & 2032
- Table 83: Global EDA Tools Market Revenue Million Forecast, by Country 2019 & 2032
- Table 84: Global EDA Tools Market Volume K Unit Forecast, by Country 2019 & 2032
- Table 85: United States EDA Tools Market Revenue (Million) Forecast, by Application 2019 & 2032
- Table 86: United States EDA Tools Market Volume (K Unit) Forecast, by Application 2019 & 2032
- Table 87: Canada EDA Tools Market Revenue (Million) Forecast, by Application 2019 & 2032
- Table 88: Canada EDA Tools Market Volume (K Unit) Forecast, by Application 2019 & 2032
- Table 89: Mexico EDA Tools Market Revenue (Million) Forecast, by Application 2019 & 2032
- Table 90: Mexico EDA Tools Market Volume (K Unit) Forecast, by Application 2019 & 2032
- Table 91: Global EDA Tools Market Revenue Million Forecast, by Country 2019 & 2032
- Table 92: Global EDA Tools Market Volume K Unit Forecast, by Country 2019 & 2032
- Table 93: United Arab Emirates EDA Tools Market Revenue (Million) Forecast, by Application 2019 & 2032
- Table 94: United Arab Emirates EDA Tools Market Volume (K Unit) Forecast, by Application 2019 & 2032
- Table 95: Saudi Arabia EDA Tools Market Revenue (Million) Forecast, by Application 2019 & 2032
- Table 96: Saudi Arabia EDA Tools Market Volume (K Unit) Forecast, by Application 2019 & 2032
- Table 97: South Africa EDA Tools Market Revenue (Million) Forecast, by Application 2019 & 2032
- Table 98: South Africa EDA Tools Market Volume (K Unit) Forecast, by Application 2019 & 2032
- Table 99: Rest of Middle East and Africa EDA Tools Market Revenue (Million) Forecast, by Application 2019 & 2032
- Table 100: Rest of Middle East and Africa EDA Tools Market Volume (K Unit) Forecast, by Application 2019 & 2032
- Table 101: Global EDA Tools Market Revenue Million Forecast, by Type 2019 & 2032
- Table 102: Global EDA Tools Market Volume K Unit Forecast, by Type 2019 & 2032
- Table 103: Global EDA Tools Market Revenue Million Forecast, by Application 2019 & 2032
- Table 104: Global EDA Tools Market Volume K Unit Forecast, by Application 2019 & 2032
- Table 105: Global EDA Tools Market Revenue Million Forecast, by End-user 2019 & 2032
- Table 106: Global EDA Tools Market Volume K Unit Forecast, by End-user 2019 & 2032
- Table 107: Global EDA Tools Market Revenue Million Forecast, by Country 2019 & 2032
- Table 108: Global EDA Tools Market Volume K Unit Forecast, by Country 2019 & 2032
- Table 109: Global EDA Tools Market Revenue Million Forecast, by Type 2019 & 2032
- Table 110: Global EDA Tools Market Volume K Unit Forecast, by Type 2019 & 2032
- Table 111: Global EDA Tools Market Revenue Million Forecast, by Application 2019 & 2032
- Table 112: Global EDA Tools Market Volume K Unit Forecast, by Application 2019 & 2032
- Table 113: Global EDA Tools Market Revenue Million Forecast, by End-user 2019 & 2032
- Table 114: Global EDA Tools Market Volume K Unit Forecast, by End-user 2019 & 2032
- Table 115: Global EDA Tools Market Revenue Million Forecast, by Country 2019 & 2032
- Table 116: Global EDA Tools Market Volume K Unit Forecast, by Country 2019 & 2032
- Table 117: Global EDA Tools Market Revenue Million Forecast, by Type 2019 & 2032
- Table 118: Global EDA Tools Market Volume K Unit Forecast, by Type 2019 & 2032
- Table 119: Global EDA Tools Market Revenue Million Forecast, by Application 2019 & 2032
- Table 120: Global EDA Tools Market Volume K Unit Forecast, by Application 2019 & 2032
- Table 121: Global EDA Tools Market Revenue Million Forecast, by End-user 2019 & 2032
- Table 122: Global EDA Tools Market Volume K Unit Forecast, by End-user 2019 & 2032
- Table 123: Global EDA Tools Market Revenue Million Forecast, by Country 2019 & 2032
- Table 124: Global EDA Tools Market Volume K Unit Forecast, by Country 2019 & 2032
- Table 125: Global EDA Tools Market Revenue Million Forecast, by Type 2019 & 2032
- Table 126: Global EDA Tools Market Volume K Unit Forecast, by Type 2019 & 2032
- Table 127: Global EDA Tools Market Revenue Million Forecast, by Application 2019 & 2032
- Table 128: Global EDA Tools Market Volume K Unit Forecast, by Application 2019 & 2032
- Table 129: Global EDA Tools Market Revenue Million Forecast, by End-user 2019 & 2032
- Table 130: Global EDA Tools Market Volume K Unit Forecast, by End-user 2019 & 2032
- Table 131: Global EDA Tools Market Revenue Million Forecast, by Country 2019 & 2032
- Table 132: Global EDA Tools Market Volume K Unit Forecast, by Country 2019 & 2032
Frequently Asked Questions
1. What is the projected Compound Annual Growth Rate (CAGR) of the EDA Tools Market?
The projected CAGR is approximately 8.46%.
2. Which companies are prominent players in the EDA Tools Market?
Key companies in the market include Ansys Inc, Aldec Inc, Xilinx Inc, Altium Limited, Keysight Technologies Inc, Mentor Graphic Corporation (Siemens PLM Software), Synopsys Inc, Cadence Design Systems Inc, Lauterbach GmbH, Agnisys Inc, Zuken Ltd.
3. What are the main segments of the EDA Tools Market?
The market segments include Type, Application, End-user .
4. Can you provide details about the market size?
The market size is estimated to be USD 17.72 Million as of 2022.
5. What are some drivers contributing to market growth?
Booming Automotive. IoT. and AI Sectors; Upcoming Trend of EDA Toolsets Equipped with Machine Learning Capabilities.
6. What are the notable trends driving market growth?
IC Physical Design and Verification Segment to Grow Significantly.
7. Are there any restraints impacting market growth?
Moore's Law about to be Proven Faulty.
8. Can you provide examples of recent developments in the market?
July 2022 - Future Facilities' acquisition by Cadence Design Systems, Inc. has been finalized, the company announced. The inclusion of Future Facilities technologies and experience bolsters Cadence's approach to intelligent system design and expands its capabilities in computational fluid dynamics (CFD) and multiphysics system analysis. Leading technology companies can make wise business decisions about data center design, operations, and lifecycle management and lessen their carbon footprint thanks to Future Facilities' electronics cooling analysis and energy performance optimization solutions for data center design and operation using physics-based 3D digital twins.
9. What pricing options are available for accessing the report?
Pricing options include single-user, multi-user, and enterprise licenses priced at USD 4750, USD 5250, and USD 8750 respectively.
10. Is the market size provided in terms of value or volume?
The market size is provided in terms of value, measured in Million and volume, measured in K Unit.
11. Are there any specific market keywords associated with the report?
Yes, the market keyword associated with the report is "EDA Tools Market," which aids in identifying and referencing the specific market segment covered.
12. How do I determine which pricing option suits my needs best?
The pricing options vary based on user requirements and access needs. Individual users may opt for single-user licenses, while businesses requiring broader access may choose multi-user or enterprise licenses for cost-effective access to the report.
13. Are there any additional resources or data provided in the EDA Tools Market report?
While the report offers comprehensive insights, it's advisable to review the specific contents or supplementary materials provided to ascertain if additional resources or data are available.
14. How can I stay updated on further developments or reports in the EDA Tools Market?
To stay informed about further developments, trends, and reports in the EDA Tools Market, consider subscribing to industry newsletters, following relevant companies and organizations, or regularly checking reputable industry news sources and publications.
Methodology
Step 1 - Identification of Relevant Samples Size from Population Database


Step 2 - Approaches for Defining Global Market Size (Value, Volume* & Price*)

Note*: In applicable scenarios
Step 3 - Data Sources
Primary Research
- Web Analytics
- Survey Reports
- Research Institute
- Latest Research Reports
- Opinion Leaders
Secondary Research
- Annual Reports
- White Paper
- Latest Press Release
- Industry Association
- Paid Database
- Investor Presentations

Step 4 - Data Triangulation
Involves using different sources of information in order to increase the validity of a study
These sources are likely to be stakeholders in a program - participants, other researchers, program staff, other community members, and so on.
Then we put all data in single framework & apply various statistical tools to find out the dynamic on the market.
During the analysis stage, feedback from the stakeholder groups would be compared to determine areas of agreement as well as areas of divergence


