
Key Insights
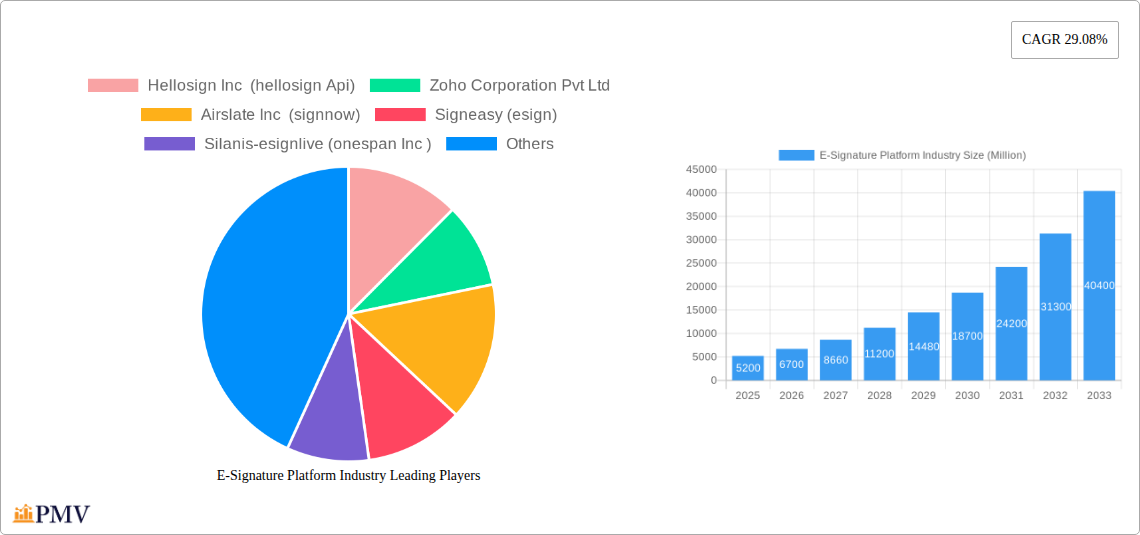
The global e-signature platform market is experiencing robust growth, projected to reach \$5.20 billion in 2025 and maintain a Compound Annual Growth Rate (CAGR) of 29.08% from 2025 to 2033. This expansion is fueled by several key factors. Increasing digital transformation initiatives across various industries, particularly BFSI (Banking, Financial Services, and Insurance), Government and Defense, and Healthcare, are driving the adoption of secure and efficient e-signature solutions. The rising need for streamlined document workflows, reduced operational costs, and enhanced security are further bolstering market growth. The shift towards remote work and increased regulatory compliance requirements also contribute significantly to the market's upward trajectory. The market is segmented by deployment (on-premise and cloud), organization size (small and medium enterprises and large enterprises), and end-user industry. Cloud-based solutions are dominating the market due to their scalability, accessibility, and cost-effectiveness. Large enterprises are leading the adoption, followed by SMEs, reflecting the increasing need for digitalization in business processes across all organizational sizes. Competition is fierce, with established players like DocuSign and Adobe competing with emerging innovative solutions.
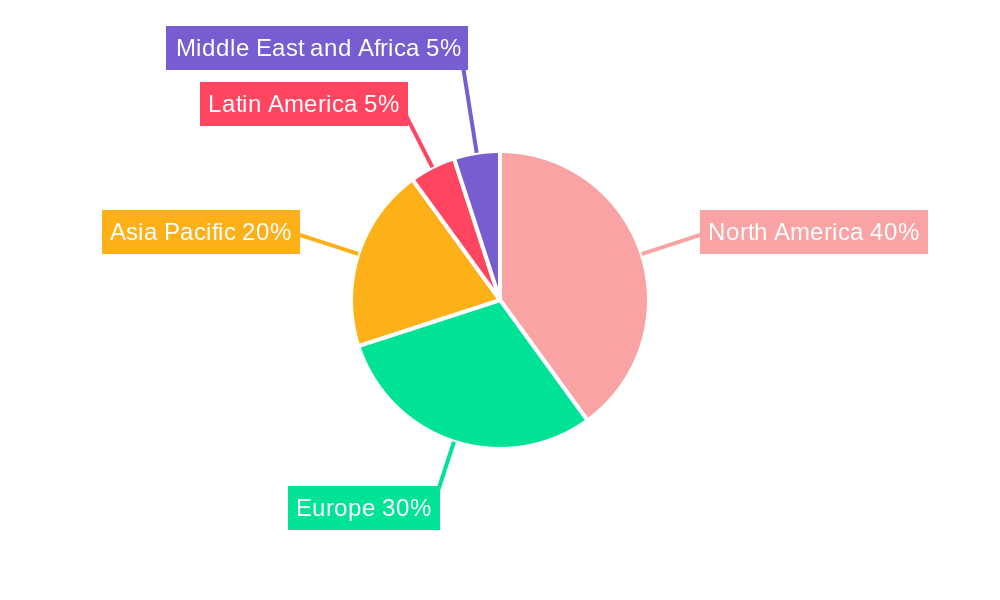
The market's growth is not without its challenges. Concerns regarding data security and the legal validity of e-signatures in certain jurisdictions remain obstacles. However, ongoing technological advancements, increased regulatory clarity, and rising consumer awareness are mitigating these concerns. The future of the e-signature platform market appears promising, with continued innovation in areas such as AI-powered document automation, blockchain integration for enhanced security, and cross-border compatibility expected to drive further growth in the coming years. Geographic expansion, particularly in the Asia-Pacific region, presents significant opportunities for market players. The market is expected to see continued strong growth in North America and Europe, while emerging markets in Asia-Pacific and Latin America offer substantial untapped potential.
E-Signature Platform Industry: A Comprehensive Market Report (2019-2033)
This in-depth report provides a comprehensive analysis of the E-Signature Platform industry, covering market size, growth drivers, competitive landscape, and future outlook. The study period spans from 2019 to 2033, with 2025 as the base and estimated year. The report offers actionable insights for businesses operating in or considering entry into this rapidly evolving market. With a forecast period of 2025-2033 and historical data from 2019-2024, this report is an essential resource for strategic decision-making. The global market value is projected to reach xx Million by 2033.
E-Signature Platform Industry Market Structure & Competitive Dynamics
The e-signature platform market is characterized by a blend of established players and emerging innovators. Market concentration is moderate, with several dominant players commanding significant market share, while numerous smaller companies compete in niche segments. DocuSign Inc holds a substantial market share, followed by Adobe Inc and others. The competitive landscape is dynamic, driven by continuous innovation in features, security protocols, and integration capabilities. Regulatory frameworks, particularly around digital identity verification and legal enforceability, significantly influence market dynamics. Product substitutes, such as traditional paper-based signatures, are declining in prevalence due to efficiency and cost benefits offered by e-signature solutions. End-user trends favor cloud-based solutions due to accessibility and scalability. Mergers and acquisitions (M&A) are a common feature, with deal values ranging from xx Million to xx Million, reflecting consolidation and expansion efforts. Recent notable M&A activity includes PandaDoc's acquisition of LiveNotary in March 2022.
- Market Concentration: Moderate, with several key players controlling a significant portion of the market.
- Innovation Ecosystem: High, characterized by rapid technological advancements in security, integration, and user experience.
- Regulatory Frameworks: Significant impact on market growth and adoption, varying by region.
- Product Substitutes: Traditional paper-based signatures are gradually being replaced.
- End-User Trends: Strong preference for cloud-based, user-friendly solutions.
- M&A Activity: High, with deals valued from xx Million to xx Million, driving consolidation and expansion.
E-Signature Platform Industry Industry Trends & Insights
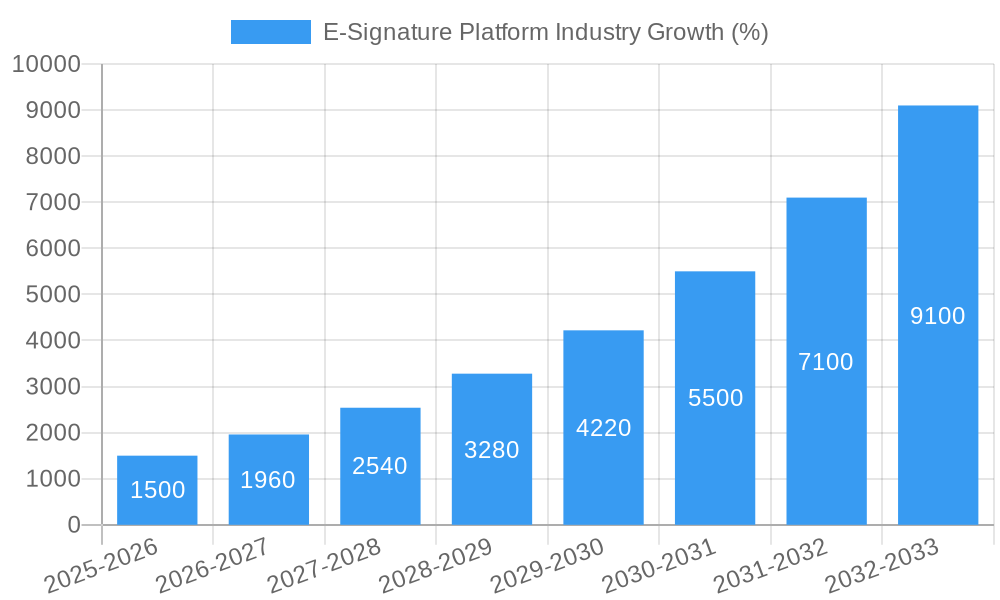
The e-signature platform market is experiencing robust growth, driven by the increasing adoption of digital technologies across various industries. The market exhibits a Compound Annual Growth Rate (CAGR) of xx% during the forecast period (2025-2033). This growth is fueled by several factors, including the rising demand for streamlined workflows, improved efficiency, reduced operational costs, and enhanced security features. Technological advancements, such as AI-powered document automation and advanced security protocols, further drive market expansion. Consumer preference shifts towards user-friendly interfaces and seamless integrations with existing business systems. Competitive dynamics remain intense, with companies focusing on innovation, strategic partnerships, and acquisitions to maintain market share. Market penetration is gradually increasing across diverse sectors, although adoption rates vary based on industry-specific regulations and digital maturity levels.
Dominant Markets & Segments in E-Signature Platform Industry
The cloud-based segment dominates the e-signature platform market, driven by its scalability, accessibility, and cost-effectiveness. The Large Enterprise segment is a significant revenue contributor due to higher adoption rates and larger deployment sizes. Within end-user industries, BFSI (Banking, Financial Services, and Insurance) and Government and Defense sectors demonstrate substantial growth potential due to stringent regulatory requirements and the need for secure, legally-binding digital transactions. North America currently holds a dominant position in the global market, driven by high digital adoption rates, mature technological infrastructure, and robust regulatory frameworks.
- By Deployment: Cloud-based solutions dominate due to scalability and accessibility.
- By Organization Size: Large Enterprises drive significant revenue due to high adoption and scale.
- By End-User: BFSI and Government & Defense show strong growth, driven by regulatory needs and large-scale deployment.
- Key Drivers (Regional Dominance): North America's dominance is attributed to factors such as high digital adoption, robust technological infrastructure, and clear regulatory frameworks. Other regions lag behind due to slower digital transformation rates and less developed technological infrastructure.
E-Signature Platform Industry Product Innovations
Recent product innovations in the e-signature platform market focus on enhancing security, improving user experience, and expanding integration capabilities. Advanced features like AI-powered document automation, biometric authentication, and blockchain-based security are becoming increasingly prevalent. These developments aim to address customer needs for secure, reliable, and efficient e-signature solutions. The market is seeing a trend towards integrated platforms that offer a complete suite of document management functionalities, including e-signature, workflow automation, and data analytics. This comprehensive approach improves operational efficiency and strengthens market fit.
Report Segmentation & Scope
This report segments the e-signature platform market across various dimensions:
- By Deployment: On-premise and Cloud, with growth projections and market sizes provided for each. The Cloud segment is anticipated to maintain the highest growth rate.
- By Organization Size: Small and Medium Enterprises (SMEs) and Large Enterprises. Large enterprises show higher adoption rates, driving a larger market share.
- By End-User: BFSI, Government and Defense, Healthcare, Oil and Gas, IT and Telecom, Logistics and Transportation, and Other End-user Industries. Each industry's adoption rate and market size projections are detailed. Competitive dynamics within each segment are also discussed.
Key Drivers of E-Signature Platform Industry Growth
Several key factors drive the growth of the e-signature platform industry. Increased regulatory compliance mandates across various industries necessitate the adoption of digital signature solutions for secure and legally-binding transactions. The growing need for streamlined workflows, increased operational efficiency, and reduced operational costs are further driving the market. Technological advancements in areas such as AI-powered document processing and improved security features enhance the appeal of e-signature platforms. The expanding adoption of cloud-based solutions further fuels the market's growth.
Challenges in the E-Signature Platform Industry Sector
Despite its strong growth trajectory, the e-signature platform industry faces challenges such as stringent regulatory compliance requirements, varying across different regions, and the need for robust cybersecurity measures to mitigate potential risks. Supply chain disruptions and escalating costs for some components can hinder market expansion. Intense competition from established players and emerging startups presents an ongoing challenge. Maintaining user trust and addressing concerns related to data privacy and security are critical to sustained growth.
Leading Players in the E-Signature Platform Industry Market
- Hellosign Inc (hellosign Api)
- Zoho Corporation Pvt Ltd
- Airslate Inc (signnow)
- Signeasy (esign)
- Silanis-esignlive (onespan Inc )
- Adobe Inc
- Yousign
- Docusign Inc
- Rightsignature (citrix Systems)
- Pandadoc Inc
Key Developments in E-Signature Platform Industry Sector
- March 2022: PandaDoc announced the acquisition of LiveNotary, expanding its digital document management solutions.
- March 2022: PandaDoc partnered with QuickBooks, integrating its platform with Intuit's financial management platform.
- August 2022: ZorroSign upgraded its user experience and interface with new features and security enhancements.
- September 2022: The National Institute of Standards and Technology (NIST) requested additional digital signature proposals for Post-Quantum Cryptography (PQC) standardization.
Strategic E-Signature Platform Industry Market Outlook
The e-signature platform market presents significant growth potential driven by increasing digital adoption and the need for secure, efficient document workflows. Strategic opportunities lie in developing innovative solutions that address evolving regulatory requirements and enhance security features. Companies focusing on seamless integrations with existing business systems and providing user-friendly interfaces are poised for success. Expansion into emerging markets and strategic partnerships are crucial for sustained growth and market leadership.
E-Signature Platform Industry Segmentation
-
1. Deployment
- 1.1. On-premise
- 1.2. Cloud
-
2. Organization Size
- 2.1. Small and Medium Enterprise
- 2.2. Large Enterprise
-
3. End-User Industry
- 3.1. BFSI
- 3.2. Government and Defense
- 3.3. Healthcare
- 3.4. Oil and Gas
- 3.5. IT and Telecom
- 3.6. Logistics and Transportation
- 3.7. Other End-user Industries
E-Signature Platform Industry Segmentation By Geography
-
1. North America
- 1.1. United States
- 1.2. Canada
-
2. Europe
- 2.1. United Kingdom
- 2.2. Germany
- 2.3. France
- 2.4. Italy
-
3. Asia
- 3.1. China
- 3.2. Japan
- 3.3. South Korea
- 4. Australia and New Zealand
- 5. Latin America
- 6. Middle East and Africa
E-Signature Platform Industry REPORT HIGHLIGHTS
| Aspects | Details |
|---|---|
| Study Period | 2019-2033 |
| Base Year | 2024 |
| Estimated Year | 2025 |
| Forecast Period | 2025-2033 |
| Historical Period | 2019-2024 |
| Growth Rate | CAGR of 29.08% from 2019-2033 |
| Segmentation |
|
Table of Contents
- 1. Introduction
- 1.1. Research Scope
- 1.2. Market Segmentation
- 1.3. Research Methodology
- 1.4. Definitions and Assumptions
- 2. Executive Summary
- 2.1. Introduction
- 3. Market Dynamics
- 3.1. Introduction
- 3.2. Market Drivers
- 3.2.1. Rise In E-signatures And Adoption Of Cloud-based Services; Increase In Remote Work Culture And Overseas Contracts
- 3.3. Market Restrains
- 3.3.1. Increasing Vulnerability Related To Cyber-attacks and Frauds
- 3.4. Market Trends
- 3.4.1. Government and Defense to hold significant share
- 4. Market Factor Analysis
- 4.1. Porters Five Forces
- 4.2. Supply/Value Chain
- 4.3. PESTEL analysis
- 4.4. Market Entropy
- 4.5. Patent/Trademark Analysis
- 5. Global E-Signature Platform Industry Analysis, Insights and Forecast, 2019-2031
- 5.1. Market Analysis, Insights and Forecast - by Deployment
- 5.1.1. On-premise
- 5.1.2. Cloud
- 5.2. Market Analysis, Insights and Forecast - by Organization Size
- 5.2.1. Small and Medium Enterprise
- 5.2.2. Large Enterprise
- 5.3. Market Analysis, Insights and Forecast - by End-User Industry
- 5.3.1. BFSI
- 5.3.2. Government and Defense
- 5.3.3. Healthcare
- 5.3.4. Oil and Gas
- 5.3.5. IT and Telecom
- 5.3.6. Logistics and Transportation
- 5.3.7. Other End-user Industries
- 5.4. Market Analysis, Insights and Forecast - by Region
- 5.4.1. North America
- 5.4.2. Europe
- 5.4.3. Asia
- 5.4.4. Australia and New Zealand
- 5.4.5. Latin America
- 5.4.6. Middle East and Africa
- 5.1. Market Analysis, Insights and Forecast - by Deployment
- 6. North America E-Signature Platform Industry Analysis, Insights and Forecast, 2019-2031
- 6.1. Market Analysis, Insights and Forecast - by Deployment
- 6.1.1. On-premise
- 6.1.2. Cloud
- 6.2. Market Analysis, Insights and Forecast - by Organization Size
- 6.2.1. Small and Medium Enterprise
- 6.2.2. Large Enterprise
- 6.3. Market Analysis, Insights and Forecast - by End-User Industry
- 6.3.1. BFSI
- 6.3.2. Government and Defense
- 6.3.3. Healthcare
- 6.3.4. Oil and Gas
- 6.3.5. IT and Telecom
- 6.3.6. Logistics and Transportation
- 6.3.7. Other End-user Industries
- 6.1. Market Analysis, Insights and Forecast - by Deployment
- 7. Europe E-Signature Platform Industry Analysis, Insights and Forecast, 2019-2031
- 7.1. Market Analysis, Insights and Forecast - by Deployment
- 7.1.1. On-premise
- 7.1.2. Cloud
- 7.2. Market Analysis, Insights and Forecast - by Organization Size
- 7.2.1. Small and Medium Enterprise
- 7.2.2. Large Enterprise
- 7.3. Market Analysis, Insights and Forecast - by End-User Industry
- 7.3.1. BFSI
- 7.3.2. Government and Defense
- 7.3.3. Healthcare
- 7.3.4. Oil and Gas
- 7.3.5. IT and Telecom
- 7.3.6. Logistics and Transportation
- 7.3.7. Other End-user Industries
- 7.1. Market Analysis, Insights and Forecast - by Deployment
- 8. Asia E-Signature Platform Industry Analysis, Insights and Forecast, 2019-2031
- 8.1. Market Analysis, Insights and Forecast - by Deployment
- 8.1.1. On-premise
- 8.1.2. Cloud
- 8.2. Market Analysis, Insights and Forecast - by Organization Size
- 8.2.1. Small and Medium Enterprise
- 8.2.2. Large Enterprise
- 8.3. Market Analysis, Insights and Forecast - by End-User Industry
- 8.3.1. BFSI
- 8.3.2. Government and Defense
- 8.3.3. Healthcare
- 8.3.4. Oil and Gas
- 8.3.5. IT and Telecom
- 8.3.6. Logistics and Transportation
- 8.3.7. Other End-user Industries
- 8.1. Market Analysis, Insights and Forecast - by Deployment
- 9. Australia and New Zealand E-Signature Platform Industry Analysis, Insights and Forecast, 2019-2031
- 9.1. Market Analysis, Insights and Forecast - by Deployment
- 9.1.1. On-premise
- 9.1.2. Cloud
- 9.2. Market Analysis, Insights and Forecast - by Organization Size
- 9.2.1. Small and Medium Enterprise
- 9.2.2. Large Enterprise
- 9.3. Market Analysis, Insights and Forecast - by End-User Industry
- 9.3.1. BFSI
- 9.3.2. Government and Defense
- 9.3.3. Healthcare
- 9.3.4. Oil and Gas
- 9.3.5. IT and Telecom
- 9.3.6. Logistics and Transportation
- 9.3.7. Other End-user Industries
- 9.1. Market Analysis, Insights and Forecast - by Deployment
- 10. Latin America E-Signature Platform Industry Analysis, Insights and Forecast, 2019-2031
- 10.1. Market Analysis, Insights and Forecast - by Deployment
- 10.1.1. On-premise
- 10.1.2. Cloud
- 10.2. Market Analysis, Insights and Forecast - by Organization Size
- 10.2.1. Small and Medium Enterprise
- 10.2.2. Large Enterprise
- 10.3. Market Analysis, Insights and Forecast - by End-User Industry
- 10.3.1. BFSI
- 10.3.2. Government and Defense
- 10.3.3. Healthcare
- 10.3.4. Oil and Gas
- 10.3.5. IT and Telecom
- 10.3.6. Logistics and Transportation
- 10.3.7. Other End-user Industries
- 10.1. Market Analysis, Insights and Forecast - by Deployment
- 11. Middle East and Africa E-Signature Platform Industry Analysis, Insights and Forecast, 2019-2031
- 11.1. Market Analysis, Insights and Forecast - by Deployment
- 11.1.1. On-premise
- 11.1.2. Cloud
- 11.2. Market Analysis, Insights and Forecast - by Organization Size
- 11.2.1. Small and Medium Enterprise
- 11.2.2. Large Enterprise
- 11.3. Market Analysis, Insights and Forecast - by End-User Industry
- 11.3.1. BFSI
- 11.3.2. Government and Defense
- 11.3.3. Healthcare
- 11.3.4. Oil and Gas
- 11.3.5. IT and Telecom
- 11.3.6. Logistics and Transportation
- 11.3.7. Other End-user Industries
- 11.1. Market Analysis, Insights and Forecast - by Deployment
- 12. North America E-Signature Platform Industry Analysis, Insights and Forecast, 2019-2031
- 12.1. Market Analysis, Insights and Forecast - By Country/Sub-region
- 12.1.1 United States
- 12.1.2 Canada
- 13. Europe E-Signature Platform Industry Analysis, Insights and Forecast, 2019-2031
- 13.1. Market Analysis, Insights and Forecast - By Country/Sub-region
- 13.1.1 United Kingdom
- 13.1.2 Germany
- 13.1.3 France
- 13.1.4 Italy
- 13.1.5 Rest of Europe
- 14. Asia Pacific E-Signature Platform Industry Analysis, Insights and Forecast, 2019-2031
- 14.1. Market Analysis, Insights and Forecast - By Country/Sub-region
- 14.1.1 China
- 14.1.2 Japan
- 14.1.3 South Korea
- 14.1.4 Rest of Asia Pacific
- 15. Latin America E-Signature Platform Industry Analysis, Insights and Forecast, 2019-2031
- 15.1. Market Analysis, Insights and Forecast - By Country/Sub-region
- 15.1.1.
- 16. Middle East and Africa E-Signature Platform Industry Analysis, Insights and Forecast, 2019-2031
- 16.1. Market Analysis, Insights and Forecast - By Country/Sub-region
- 16.1.1.
- 17. Competitive Analysis
- 17.1. Global Market Share Analysis 2024
- 17.2. Company Profiles
- 17.2.1 Hellosign Inc (hellosign Api)
- 17.2.1.1. Overview
- 17.2.1.2. Products
- 17.2.1.3. SWOT Analysis
- 17.2.1.4. Recent Developments
- 17.2.1.5. Financials (Based on Availability)
- 17.2.2 Zoho Corporation Pvt Ltd
- 17.2.2.1. Overview
- 17.2.2.2. Products
- 17.2.2.3. SWOT Analysis
- 17.2.2.4. Recent Developments
- 17.2.2.5. Financials (Based on Availability)
- 17.2.3 Airslate Inc (signnow)
- 17.2.3.1. Overview
- 17.2.3.2. Products
- 17.2.3.3. SWOT Analysis
- 17.2.3.4. Recent Developments
- 17.2.3.5. Financials (Based on Availability)
- 17.2.4 Signeasy (esign)
- 17.2.4.1. Overview
- 17.2.4.2. Products
- 17.2.4.3. SWOT Analysis
- 17.2.4.4. Recent Developments
- 17.2.4.5. Financials (Based on Availability)
- 17.2.5 Silanis-esignlive (onespan Inc )
- 17.2.5.1. Overview
- 17.2.5.2. Products
- 17.2.5.3. SWOT Analysis
- 17.2.5.4. Recent Developments
- 17.2.5.5. Financials (Based on Availability)
- 17.2.6 Adobe Inc
- 17.2.6.1. Overview
- 17.2.6.2. Products
- 17.2.6.3. SWOT Analysis
- 17.2.6.4. Recent Developments
- 17.2.6.5. Financials (Based on Availability)
- 17.2.7 Yousign
- 17.2.7.1. Overview
- 17.2.7.2. Products
- 17.2.7.3. SWOT Analysis
- 17.2.7.4. Recent Developments
- 17.2.7.5. Financials (Based on Availability)
- 17.2.8 Docusign Inc
- 17.2.8.1. Overview
- 17.2.8.2. Products
- 17.2.8.3. SWOT Analysis
- 17.2.8.4. Recent Developments
- 17.2.8.5. Financials (Based on Availability)
- 17.2.9 Rightsignature (citrix Systems)
- 17.2.9.1. Overview
- 17.2.9.2. Products
- 17.2.9.3. SWOT Analysis
- 17.2.9.4. Recent Developments
- 17.2.9.5. Financials (Based on Availability)
- 17.2.10 Pandadoc Inc
- 17.2.10.1. Overview
- 17.2.10.2. Products
- 17.2.10.3. SWOT Analysis
- 17.2.10.4. Recent Developments
- 17.2.10.5. Financials (Based on Availability)
- 17.2.1 Hellosign Inc (hellosign Api)
List of Figures
- Figure 1: Global E-Signature Platform Industry Revenue Breakdown (Million, %) by Region 2024 & 2032
- Figure 2: North America E-Signature Platform Industry Revenue (Million), by Country 2024 & 2032
- Figure 3: North America E-Signature Platform Industry Revenue Share (%), by Country 2024 & 2032
- Figure 4: Europe E-Signature Platform Industry Revenue (Million), by Country 2024 & 2032
- Figure 5: Europe E-Signature Platform Industry Revenue Share (%), by Country 2024 & 2032
- Figure 6: Asia Pacific E-Signature Platform Industry Revenue (Million), by Country 2024 & 2032
- Figure 7: Asia Pacific E-Signature Platform Industry Revenue Share (%), by Country 2024 & 2032
- Figure 8: Latin America E-Signature Platform Industry Revenue (Million), by Country 2024 & 2032
- Figure 9: Latin America E-Signature Platform Industry Revenue Share (%), by Country 2024 & 2032
- Figure 10: Middle East and Africa E-Signature Platform Industry Revenue (Million), by Country 2024 & 2032
- Figure 11: Middle East and Africa E-Signature Platform Industry Revenue Share (%), by Country 2024 & 2032
- Figure 12: North America E-Signature Platform Industry Revenue (Million), by Deployment 2024 & 2032
- Figure 13: North America E-Signature Platform Industry Revenue Share (%), by Deployment 2024 & 2032
- Figure 14: North America E-Signature Platform Industry Revenue (Million), by Organization Size 2024 & 2032
- Figure 15: North America E-Signature Platform Industry Revenue Share (%), by Organization Size 2024 & 2032
- Figure 16: North America E-Signature Platform Industry Revenue (Million), by End-User Industry 2024 & 2032
- Figure 17: North America E-Signature Platform Industry Revenue Share (%), by End-User Industry 2024 & 2032
- Figure 18: North America E-Signature Platform Industry Revenue (Million), by Country 2024 & 2032
- Figure 19: North America E-Signature Platform Industry Revenue Share (%), by Country 2024 & 2032
- Figure 20: Europe E-Signature Platform Industry Revenue (Million), by Deployment 2024 & 2032
- Figure 21: Europe E-Signature Platform Industry Revenue Share (%), by Deployment 2024 & 2032
- Figure 22: Europe E-Signature Platform Industry Revenue (Million), by Organization Size 2024 & 2032
- Figure 23: Europe E-Signature Platform Industry Revenue Share (%), by Organization Size 2024 & 2032
- Figure 24: Europe E-Signature Platform Industry Revenue (Million), by End-User Industry 2024 & 2032
- Figure 25: Europe E-Signature Platform Industry Revenue Share (%), by End-User Industry 2024 & 2032
- Figure 26: Europe E-Signature Platform Industry Revenue (Million), by Country 2024 & 2032
- Figure 27: Europe E-Signature Platform Industry Revenue Share (%), by Country 2024 & 2032
- Figure 28: Asia E-Signature Platform Industry Revenue (Million), by Deployment 2024 & 2032
- Figure 29: Asia E-Signature Platform Industry Revenue Share (%), by Deployment 2024 & 2032
- Figure 30: Asia E-Signature Platform Industry Revenue (Million), by Organization Size 2024 & 2032
- Figure 31: Asia E-Signature Platform Industry Revenue Share (%), by Organization Size 2024 & 2032
- Figure 32: Asia E-Signature Platform Industry Revenue (Million), by End-User Industry 2024 & 2032
- Figure 33: Asia E-Signature Platform Industry Revenue Share (%), by End-User Industry 2024 & 2032
- Figure 34: Asia E-Signature Platform Industry Revenue (Million), by Country 2024 & 2032
- Figure 35: Asia E-Signature Platform Industry Revenue Share (%), by Country 2024 & 2032
- Figure 36: Australia and New Zealand E-Signature Platform Industry Revenue (Million), by Deployment 2024 & 2032
- Figure 37: Australia and New Zealand E-Signature Platform Industry Revenue Share (%), by Deployment 2024 & 2032
- Figure 38: Australia and New Zealand E-Signature Platform Industry Revenue (Million), by Organization Size 2024 & 2032
- Figure 39: Australia and New Zealand E-Signature Platform Industry Revenue Share (%), by Organization Size 2024 & 2032
- Figure 40: Australia and New Zealand E-Signature Platform Industry Revenue (Million), by End-User Industry 2024 & 2032
- Figure 41: Australia and New Zealand E-Signature Platform Industry Revenue Share (%), by End-User Industry 2024 & 2032
- Figure 42: Australia and New Zealand E-Signature Platform Industry Revenue (Million), by Country 2024 & 2032
- Figure 43: Australia and New Zealand E-Signature Platform Industry Revenue Share (%), by Country 2024 & 2032
- Figure 44: Latin America E-Signature Platform Industry Revenue (Million), by Deployment 2024 & 2032
- Figure 45: Latin America E-Signature Platform Industry Revenue Share (%), by Deployment 2024 & 2032
- Figure 46: Latin America E-Signature Platform Industry Revenue (Million), by Organization Size 2024 & 2032
- Figure 47: Latin America E-Signature Platform Industry Revenue Share (%), by Organization Size 2024 & 2032
- Figure 48: Latin America E-Signature Platform Industry Revenue (Million), by End-User Industry 2024 & 2032
- Figure 49: Latin America E-Signature Platform Industry Revenue Share (%), by End-User Industry 2024 & 2032
- Figure 50: Latin America E-Signature Platform Industry Revenue (Million), by Country 2024 & 2032
- Figure 51: Latin America E-Signature Platform Industry Revenue Share (%), by Country 2024 & 2032
- Figure 52: Middle East and Africa E-Signature Platform Industry Revenue (Million), by Deployment 2024 & 2032
- Figure 53: Middle East and Africa E-Signature Platform Industry Revenue Share (%), by Deployment 2024 & 2032
- Figure 54: Middle East and Africa E-Signature Platform Industry Revenue (Million), by Organization Size 2024 & 2032
- Figure 55: Middle East and Africa E-Signature Platform Industry Revenue Share (%), by Organization Size 2024 & 2032
- Figure 56: Middle East and Africa E-Signature Platform Industry Revenue (Million), by End-User Industry 2024 & 2032
- Figure 57: Middle East and Africa E-Signature Platform Industry Revenue Share (%), by End-User Industry 2024 & 2032
- Figure 58: Middle East and Africa E-Signature Platform Industry Revenue (Million), by Country 2024 & 2032
- Figure 59: Middle East and Africa E-Signature Platform Industry Revenue Share (%), by Country 2024 & 2032
List of Tables
- Table 1: Global E-Signature Platform Industry Revenue Million Forecast, by Region 2019 & 2032
- Table 2: Global E-Signature Platform Industry Revenue Million Forecast, by Deployment 2019 & 2032
- Table 3: Global E-Signature Platform Industry Revenue Million Forecast, by Organization Size 2019 & 2032
- Table 4: Global E-Signature Platform Industry Revenue Million Forecast, by End-User Industry 2019 & 2032
- Table 5: Global E-Signature Platform Industry Revenue Million Forecast, by Region 2019 & 2032
- Table 6: Global E-Signature Platform Industry Revenue Million Forecast, by Country 2019 & 2032
- Table 7: United States E-Signature Platform Industry Revenue (Million) Forecast, by Application 2019 & 2032
- Table 8: Canada E-Signature Platform Industry Revenue (Million) Forecast, by Application 2019 & 2032
- Table 9: Global E-Signature Platform Industry Revenue Million Forecast, by Country 2019 & 2032
- Table 10: United Kingdom E-Signature Platform Industry Revenue (Million) Forecast, by Application 2019 & 2032
- Table 11: Germany E-Signature Platform Industry Revenue (Million) Forecast, by Application 2019 & 2032
- Table 12: France E-Signature Platform Industry Revenue (Million) Forecast, by Application 2019 & 2032
- Table 13: Italy E-Signature Platform Industry Revenue (Million) Forecast, by Application 2019 & 2032
- Table 14: Rest of Europe E-Signature Platform Industry Revenue (Million) Forecast, by Application 2019 & 2032
- Table 15: Global E-Signature Platform Industry Revenue Million Forecast, by Country 2019 & 2032
- Table 16: China E-Signature Platform Industry Revenue (Million) Forecast, by Application 2019 & 2032
- Table 17: Japan E-Signature Platform Industry Revenue (Million) Forecast, by Application 2019 & 2032
- Table 18: South Korea E-Signature Platform Industry Revenue (Million) Forecast, by Application 2019 & 2032
- Table 19: Rest of Asia Pacific E-Signature Platform Industry Revenue (Million) Forecast, by Application 2019 & 2032
- Table 20: Global E-Signature Platform Industry Revenue Million Forecast, by Country 2019 & 2032
- Table 21: E-Signature Platform Industry Revenue (Million) Forecast, by Application 2019 & 2032
- Table 22: Global E-Signature Platform Industry Revenue Million Forecast, by Country 2019 & 2032
- Table 23: E-Signature Platform Industry Revenue (Million) Forecast, by Application 2019 & 2032
- Table 24: Global E-Signature Platform Industry Revenue Million Forecast, by Deployment 2019 & 2032
- Table 25: Global E-Signature Platform Industry Revenue Million Forecast, by Organization Size 2019 & 2032
- Table 26: Global E-Signature Platform Industry Revenue Million Forecast, by End-User Industry 2019 & 2032
- Table 27: Global E-Signature Platform Industry Revenue Million Forecast, by Country 2019 & 2032
- Table 28: United States E-Signature Platform Industry Revenue (Million) Forecast, by Application 2019 & 2032
- Table 29: Canada E-Signature Platform Industry Revenue (Million) Forecast, by Application 2019 & 2032
- Table 30: Global E-Signature Platform Industry Revenue Million Forecast, by Deployment 2019 & 2032
- Table 31: Global E-Signature Platform Industry Revenue Million Forecast, by Organization Size 2019 & 2032
- Table 32: Global E-Signature Platform Industry Revenue Million Forecast, by End-User Industry 2019 & 2032
- Table 33: Global E-Signature Platform Industry Revenue Million Forecast, by Country 2019 & 2032
- Table 34: United Kingdom E-Signature Platform Industry Revenue (Million) Forecast, by Application 2019 & 2032
- Table 35: Germany E-Signature Platform Industry Revenue (Million) Forecast, by Application 2019 & 2032
- Table 36: France E-Signature Platform Industry Revenue (Million) Forecast, by Application 2019 & 2032
- Table 37: Italy E-Signature Platform Industry Revenue (Million) Forecast, by Application 2019 & 2032
- Table 38: Global E-Signature Platform Industry Revenue Million Forecast, by Deployment 2019 & 2032
- Table 39: Global E-Signature Platform Industry Revenue Million Forecast, by Organization Size 2019 & 2032
- Table 40: Global E-Signature Platform Industry Revenue Million Forecast, by End-User Industry 2019 & 2032
- Table 41: Global E-Signature Platform Industry Revenue Million Forecast, by Country 2019 & 2032
- Table 42: China E-Signature Platform Industry Revenue (Million) Forecast, by Application 2019 & 2032
- Table 43: Japan E-Signature Platform Industry Revenue (Million) Forecast, by Application 2019 & 2032
- Table 44: South Korea E-Signature Platform Industry Revenue (Million) Forecast, by Application 2019 & 2032
- Table 45: Global E-Signature Platform Industry Revenue Million Forecast, by Deployment 2019 & 2032
- Table 46: Global E-Signature Platform Industry Revenue Million Forecast, by Organization Size 2019 & 2032
- Table 47: Global E-Signature Platform Industry Revenue Million Forecast, by End-User Industry 2019 & 2032
- Table 48: Global E-Signature Platform Industry Revenue Million Forecast, by Country 2019 & 2032
- Table 49: Global E-Signature Platform Industry Revenue Million Forecast, by Deployment 2019 & 2032
- Table 50: Global E-Signature Platform Industry Revenue Million Forecast, by Organization Size 2019 & 2032
- Table 51: Global E-Signature Platform Industry Revenue Million Forecast, by End-User Industry 2019 & 2032
- Table 52: Global E-Signature Platform Industry Revenue Million Forecast, by Country 2019 & 2032
- Table 53: Global E-Signature Platform Industry Revenue Million Forecast, by Deployment 2019 & 2032
- Table 54: Global E-Signature Platform Industry Revenue Million Forecast, by Organization Size 2019 & 2032
- Table 55: Global E-Signature Platform Industry Revenue Million Forecast, by End-User Industry 2019 & 2032
- Table 56: Global E-Signature Platform Industry Revenue Million Forecast, by Country 2019 & 2032
Frequently Asked Questions
1. What is the projected Compound Annual Growth Rate (CAGR) of the E-Signature Platform Industry?
The projected CAGR is approximately 29.08%.
2. Which companies are prominent players in the E-Signature Platform Industry?
Key companies in the market include Hellosign Inc (hellosign Api), Zoho Corporation Pvt Ltd, Airslate Inc (signnow), Signeasy (esign), Silanis-esignlive (onespan Inc ), Adobe Inc, Yousign, Docusign Inc, Rightsignature (citrix Systems), Pandadoc Inc.
3. What are the main segments of the E-Signature Platform Industry?
The market segments include Deployment, Organization Size, End-User Industry.
4. Can you provide details about the market size?
The market size is estimated to be USD 5.20 Million as of 2022.
5. What are some drivers contributing to market growth?
Rise In E-signatures And Adoption Of Cloud-based Services; Increase In Remote Work Culture And Overseas Contracts.
6. What are the notable trends driving market growth?
Government and Defense to hold significant share.
7. Are there any restraints impacting market growth?
Increasing Vulnerability Related To Cyber-attacks and Frauds.
8. Can you provide examples of recent developments in the market?
September 2022 - The National Institute of Standards and Technology requested additional digital signature proposals to be considered in the Post-Quantum Cryptography (PQC) standardization process. NIST is primarily interested in additional general-purpose signature schemes that are not based on structured lattices. For some applications, including certificate transparency, it may also be interested in signature schemes comprising short signatures and fast verification.
9. What pricing options are available for accessing the report?
Pricing options include single-user, multi-user, and enterprise licenses priced at USD 4750, USD 5250, and USD 8750 respectively.
10. Is the market size provided in terms of value or volume?
The market size is provided in terms of value, measured in Million.
11. Are there any specific market keywords associated with the report?
Yes, the market keyword associated with the report is "E-Signature Platform Industry," which aids in identifying and referencing the specific market segment covered.
12. How do I determine which pricing option suits my needs best?
The pricing options vary based on user requirements and access needs. Individual users may opt for single-user licenses, while businesses requiring broader access may choose multi-user or enterprise licenses for cost-effective access to the report.
13. Are there any additional resources or data provided in the E-Signature Platform Industry report?
While the report offers comprehensive insights, it's advisable to review the specific contents or supplementary materials provided to ascertain if additional resources or data are available.
14. How can I stay updated on further developments or reports in the E-Signature Platform Industry?
To stay informed about further developments, trends, and reports in the E-Signature Platform Industry, consider subscribing to industry newsletters, following relevant companies and organizations, or regularly checking reputable industry news sources and publications.
Methodology
Step 1 - Identification of Relevant Samples Size from Population Database


Step 2 - Approaches for Defining Global Market Size (Value, Volume* & Price*)

Note*: In applicable scenarios
Step 3 - Data Sources
Primary Research
- Web Analytics
- Survey Reports
- Research Institute
- Latest Research Reports
- Opinion Leaders
Secondary Research
- Annual Reports
- White Paper
- Latest Press Release
- Industry Association
- Paid Database
- Investor Presentations

Step 4 - Data Triangulation
Involves using different sources of information in order to increase the validity of a study
These sources are likely to be stakeholders in a program - participants, other researchers, program staff, other community members, and so on.
Then we put all data in single framework & apply various statistical tools to find out the dynamic on the market.
During the analysis stage, feedback from the stakeholder groups would be compared to determine areas of agreement as well as areas of divergence


