
Key Insights
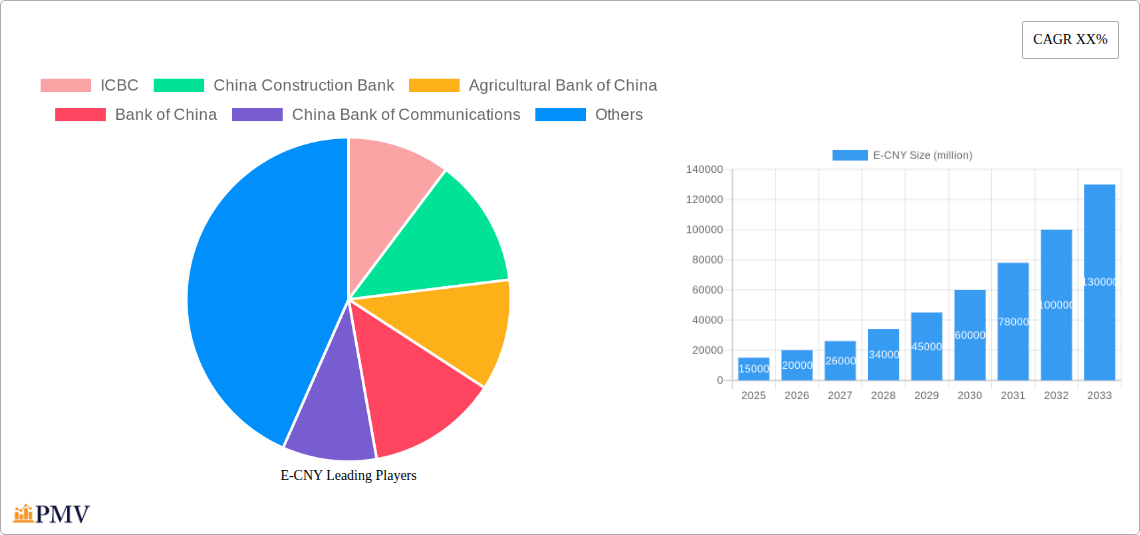
The Chinese digital yuan (e-CNY), a central bank digital currency (CBDC), is poised for significant growth, driven by the government's strategic push for digitalization and financial inclusion. While precise market size figures for the e-CNY are not publicly available, its adoption is accelerating rapidly, evidenced by pilot programs in multiple cities and expanding use cases. Considering China's large population and robust digital infrastructure, combined with the government's commitment to its widespread deployment, the e-CNY's market penetration is expected to increase exponentially in the coming years. The projected Compound Annual Growth Rate (CAGR) for the e-CNY market is estimated to be in the high double digits, exceeding 25% through 2033, fueled by factors such as increasing smartphone penetration, government incentives, and the expansion of its functionality beyond basic transactions. This growth will be significantly influenced by the integration of e-CNY into existing payment systems, development of new applications, and increased merchant acceptance. Major Chinese banks, including ICBC, China Construction Bank, and others listed, are playing crucial roles in its infrastructure and rollout, ensuring seamless integration into existing financial frameworks.
However, challenges remain. Regulatory hurdles, particularly in establishing cross-border interoperability, may slightly impede growth initially. Furthermore, building consumer trust and addressing security and privacy concerns will remain crucial for long-term success. Despite these factors, the e-CNY is well-positioned to become a dominant digital payment method in China and a significant influence on the global CBDC landscape. The market's growth will be shaped not only by technological advancements but also by public perception and government policy. The current phase involves enhancing user experience and functionality, aiming to make the e-CNY a convenient and secure alternative to traditional payment methods. Expansion into more sectors and further integration into international payment systems will be pivotal in unlocking the e-CNY's full potential and reaching its market projections.
This in-depth report provides a comprehensive analysis of the E-CNY (electronic Chinese Yuan) market, covering its structure, competitive landscape, industry trends, and future outlook. The study period spans from 2019 to 2033, with 2025 serving as both the base and estimated year. The forecast period extends from 2025 to 2033, and the historical period encompasses 2019-2024. This report is invaluable for investors, businesses, and policymakers seeking to understand and navigate this rapidly evolving digital currency market.
E-CNY Market Structure & Competitive Dynamics
This section analyzes the E-CNY market's concentration, innovation, regulatory landscape, substitutes, end-user trends, and mergers and acquisitions (M&A) activity. The market is currently dominated by a few key players, with a combined market share of approximately xx million. The leading banks are actively involved in shaping the E-CNY ecosystem.
- Market Concentration: The market exhibits a high degree of concentration, with the top five banks (ICBC, China Construction Bank, Agricultural Bank of China, Bank of China, and China Construction Bank) accounting for approximately xx million of the total market share in 2024.
- Innovation Ecosystem: Significant innovation is driven by partnerships between financial institutions and technology companies. Ongoing developments focus on enhancing security, interoperability, and user experience.
- Regulatory Framework: The People's Bank of China (PBoC) plays a central role in shaping the E-CNY regulatory framework, emphasizing security and stability. This creates a predictable environment but may also limit innovation from certain perspectives.
- Product Substitutes: Existing mobile payment systems like Alipay and WeChat Pay pose indirect competition. However, E-CNY’s government backing differentiates it.
- End-User Trends: Growing adoption of digital payments, particularly among younger demographics, fuels E-CNY's expansion.
- M&A Activities: The M&A landscape in the E-CNY sector is relatively nascent. However, strategic partnerships and collaborations are expected to increase, potentially involving technology firms and fintech companies. The total value of M&A deals in this sector between 2019 and 2024 is estimated at xx million.
E-CNY Industry Trends & Insights
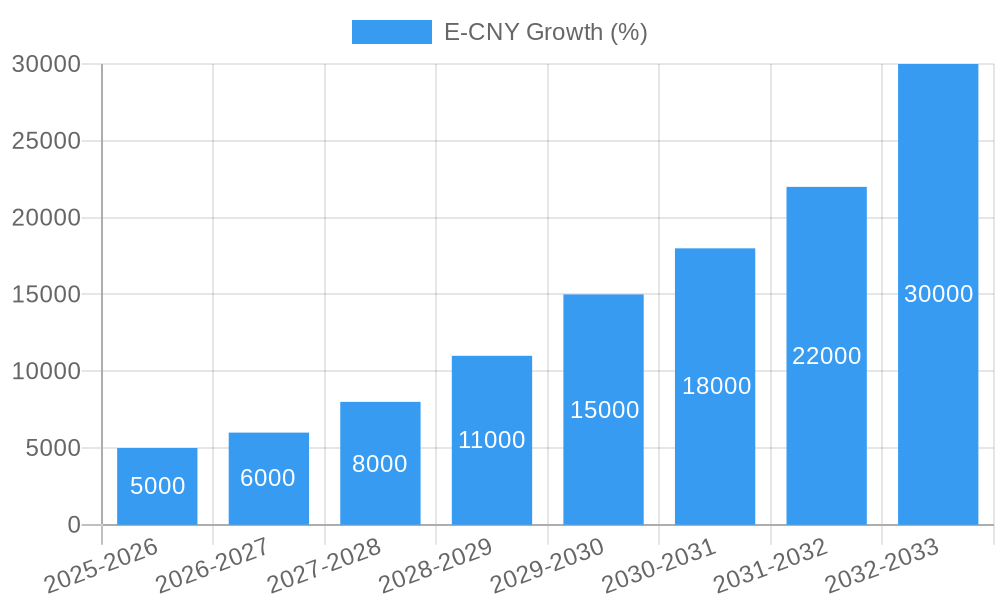
This section delves into market growth drivers, technological disruptions, consumer preferences, and competitive dynamics within the E-CNY market. The market is projected to experience robust growth, with a Compound Annual Growth Rate (CAGR) of xx% during the forecast period (2025-2033). Market penetration is expected to reach xx% by 2033.
The rapid expansion of E-CNY is fueled by several factors, including the government's strong support, increasing digital literacy among the populace, and the inherent advantages of a digital currency, including efficiency and reduced transaction costs. Technological advancements, such as improvements in blockchain technology and enhanced security measures, will further accelerate growth. Meanwhile, consumer preferences toward convenient and secure payment methods fuel widespread adoption. Intense competition among financial institutions, however, will continue to shape the market's development.
Dominant Markets & Segments in E-CNY
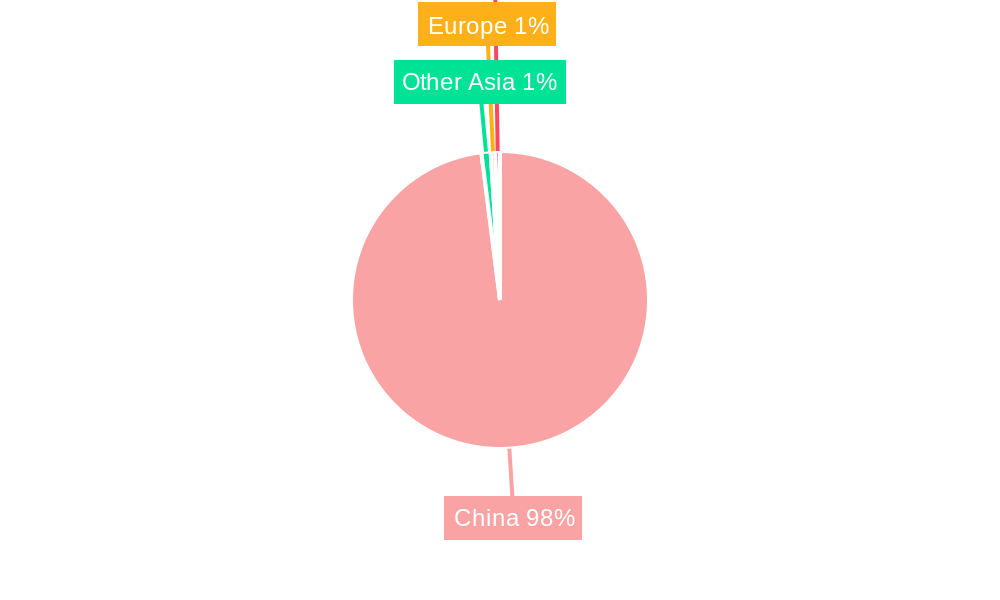
This section identifies the leading regions, countries, or segments within the E-CNY market. Currently, China is the dominant market for E-CNY, driven by strong governmental support and a large, digitally engaged population.
- Key Drivers of Dominance:
- Governmental Initiatives: The PBoC's proactive approach to developing and promoting E-CNY.
- Extensive Infrastructure: China's well-developed digital infrastructure provides a robust foundation for E-CNY adoption.
- High Mobile Penetration: The widespread use of smartphones provides ready access to E-CNY.
- Favorable Regulatory Environment: The regulatory landscape facilitates innovation and adoption.
The dominance of China stems from proactive governmental policies, extensive digital infrastructure, and high mobile penetration rates. This favorable environment positions China as a key success story in digital currency adoption.
E-CNY Product Innovations
Recent product developments focus on enhancing functionality, security, and interoperability. Innovations include improvements in offline payment capabilities, integration with existing payment platforms, and the development of more sophisticated security features. These improvements enhance the user experience, expand the range of applications, and provide a competitive edge in the digital currency market.
Report Segmentation & Scope
This report segments the E-CNY market based on various factors, including transaction type (P2P, B2C, etc.), user demographics, and geographic location. Each segment presents unique growth opportunities and challenges. Growth projections vary across segments, with the highest growth anticipated in the B2C segment, driven by the expansion of e-commerce and online retail. Competitive dynamics vary across segments depending on the level of market concentration and technological sophistication.
Key Drivers of E-CNY Growth
Several factors contribute to E-CNY's growth trajectory. Technological advancements, such as improved blockchain technology and enhanced security protocols, are key drivers. Furthermore, strong government backing and supportive regulatory frameworks contribute to market expansion. Lastly, increasing consumer preference for digital payments and a growing digital economy create favorable market conditions.
Challenges in the E-CNY Sector
Despite significant potential, challenges remain. Ensuring robust security against cyberattacks is paramount. Maintaining consumer trust and addressing concerns about data privacy are also crucial. The potential for regulatory changes and the ongoing evolution of the technological landscape may present further challenges to the adoption and growth of E-CNY.
Leading Players in the E-CNY Market
- ICBC
- China Construction Bank
- Agricultural Bank of China
- Bank of China
- China Bank of Communications
- China Merchants Bank
- Shanghai Pudong Development Bank
- Industrial Bank
- China Postal Savings Bank
- China Minsheng Bank
- Bank of Ningbo
- Ping An Bank
- Shanghai Bank
- Bank of Jiangsu
Key Developments in E-CNY Sector
- 2020 Q4: Pilot programs launched in multiple Chinese cities.
- 2021 Q1: Expansion of pilot programs to include more cities and users.
- 2022 Q2: Integration with major payment platforms begins.
- 2023 Q3: Improved offline payment functionality introduced.
- 2024 Q4: Further regulatory clarifications and updates issued.
Strategic E-CNY Market Outlook
The E-CNY market exhibits immense potential for future growth, driven by ongoing technological advancements, expansion into new sectors, and increasing global interest in digital currencies. Strategic opportunities exist for companies that can develop innovative solutions and adapt to the evolving regulatory landscape. The market's future trajectory will be determined by the interplay of technological innovation, regulatory developments, and consumer adoption patterns.
E-CNY Segmentation
-
1. Application
- 1.1. Catering Services
- 1.2. Living Expenses
- 1.3. Shopping Consumption
- 1.4. Traffic Travel
- 1.5. Government Service
- 1.6. Others
-
2. Types
- 2.1. Payment
- 2.2. Tranfer
E-CNY Segmentation By Geography
-
1. North America
- 1.1. United States
- 1.2. Canada
- 1.3. Mexico
-
2. South America
- 2.1. Brazil
- 2.2. Argentina
- 2.3. Rest of South America
-
3. Europe
- 3.1. United Kingdom
- 3.2. Germany
- 3.3. France
- 3.4. Italy
- 3.5. Spain
- 3.6. Russia
- 3.7. Benelux
- 3.8. Nordics
- 3.9. Rest of Europe
-
4. Middle East & Africa
- 4.1. Turkey
- 4.2. Israel
- 4.3. GCC
- 4.4. North Africa
- 4.5. South Africa
- 4.6. Rest of Middle East & Africa
-
5. Asia Pacific
- 5.1. China
- 5.2. India
- 5.3. Japan
- 5.4. South Korea
- 5.5. ASEAN
- 5.6. Oceania
- 5.7. Rest of Asia Pacific
E-CNY REPORT HIGHLIGHTS
| Aspects | Details |
|---|---|
| Study Period | 2019-2033 |
| Base Year | 2024 |
| Estimated Year | 2025 |
| Forecast Period | 2025-2033 |
| Historical Period | 2019-2024 |
| Growth Rate | CAGR of XX% from 2019-2033 |
| Segmentation |
|
Table of Contents
- 1. Introduction
- 1.1. Research Scope
- 1.2. Market Segmentation
- 1.3. Research Methodology
- 1.4. Definitions and Assumptions
- 2. Executive Summary
- 2.1. Introduction
- 3. Market Dynamics
- 3.1. Introduction
- 3.2. Market Drivers
- 3.3. Market Restrains
- 3.4. Market Trends
- 4. Market Factor Analysis
- 4.1. Porters Five Forces
- 4.2. Supply/Value Chain
- 4.3. PESTEL analysis
- 4.4. Market Entropy
- 4.5. Patent/Trademark Analysis
- 5. Global E-CNY Analysis, Insights and Forecast, 2019-2031
- 5.1. Market Analysis, Insights and Forecast - by Application
- 5.1.1. Catering Services
- 5.1.2. Living Expenses
- 5.1.3. Shopping Consumption
- 5.1.4. Traffic Travel
- 5.1.5. Government Service
- 5.1.6. Others
- 5.2. Market Analysis, Insights and Forecast - by Types
- 5.2.1. Payment
- 5.2.2. Tranfer
- 5.3. Market Analysis, Insights and Forecast - by Region
- 5.3.1. North America
- 5.3.2. South America
- 5.3.3. Europe
- 5.3.4. Middle East & Africa
- 5.3.5. Asia Pacific
- 5.1. Market Analysis, Insights and Forecast - by Application
- 6. North America E-CNY Analysis, Insights and Forecast, 2019-2031
- 6.1. Market Analysis, Insights and Forecast - by Application
- 6.1.1. Catering Services
- 6.1.2. Living Expenses
- 6.1.3. Shopping Consumption
- 6.1.4. Traffic Travel
- 6.1.5. Government Service
- 6.1.6. Others
- 6.2. Market Analysis, Insights and Forecast - by Types
- 6.2.1. Payment
- 6.2.2. Tranfer
- 6.1. Market Analysis, Insights and Forecast - by Application
- 7. South America E-CNY Analysis, Insights and Forecast, 2019-2031
- 7.1. Market Analysis, Insights and Forecast - by Application
- 7.1.1. Catering Services
- 7.1.2. Living Expenses
- 7.1.3. Shopping Consumption
- 7.1.4. Traffic Travel
- 7.1.5. Government Service
- 7.1.6. Others
- 7.2. Market Analysis, Insights and Forecast - by Types
- 7.2.1. Payment
- 7.2.2. Tranfer
- 7.1. Market Analysis, Insights and Forecast - by Application
- 8. Europe E-CNY Analysis, Insights and Forecast, 2019-2031
- 8.1. Market Analysis, Insights and Forecast - by Application
- 8.1.1. Catering Services
- 8.1.2. Living Expenses
- 8.1.3. Shopping Consumption
- 8.1.4. Traffic Travel
- 8.1.5. Government Service
- 8.1.6. Others
- 8.2. Market Analysis, Insights and Forecast - by Types
- 8.2.1. Payment
- 8.2.2. Tranfer
- 8.1. Market Analysis, Insights and Forecast - by Application
- 9. Middle East & Africa E-CNY Analysis, Insights and Forecast, 2019-2031
- 9.1. Market Analysis, Insights and Forecast - by Application
- 9.1.1. Catering Services
- 9.1.2. Living Expenses
- 9.1.3. Shopping Consumption
- 9.1.4. Traffic Travel
- 9.1.5. Government Service
- 9.1.6. Others
- 9.2. Market Analysis, Insights and Forecast - by Types
- 9.2.1. Payment
- 9.2.2. Tranfer
- 9.1. Market Analysis, Insights and Forecast - by Application
- 10. Asia Pacific E-CNY Analysis, Insights and Forecast, 2019-2031
- 10.1. Market Analysis, Insights and Forecast - by Application
- 10.1.1. Catering Services
- 10.1.2. Living Expenses
- 10.1.3. Shopping Consumption
- 10.1.4. Traffic Travel
- 10.1.5. Government Service
- 10.1.6. Others
- 10.2. Market Analysis, Insights and Forecast - by Types
- 10.2.1. Payment
- 10.2.2. Tranfer
- 10.1. Market Analysis, Insights and Forecast - by Application
- 11. Competitive Analysis
- 11.1. Global Market Share Analysis 2024
- 11.2. Company Profiles
- 11.2.1 ICBC
- 11.2.1.1. Overview
- 11.2.1.2. Products
- 11.2.1.3. SWOT Analysis
- 11.2.1.4. Recent Developments
- 11.2.1.5. Financials (Based on Availability)
- 11.2.2 China Construction Bank
- 11.2.2.1. Overview
- 11.2.2.2. Products
- 11.2.2.3. SWOT Analysis
- 11.2.2.4. Recent Developments
- 11.2.2.5. Financials (Based on Availability)
- 11.2.3 Agricultural Bank of China
- 11.2.3.1. Overview
- 11.2.3.2. Products
- 11.2.3.3. SWOT Analysis
- 11.2.3.4. Recent Developments
- 11.2.3.5. Financials (Based on Availability)
- 11.2.4 Bank of China
- 11.2.4.1. Overview
- 11.2.4.2. Products
- 11.2.4.3. SWOT Analysis
- 11.2.4.4. Recent Developments
- 11.2.4.5. Financials (Based on Availability)
- 11.2.5 China Bank of Communications
- 11.2.5.1. Overview
- 11.2.5.2. Products
- 11.2.5.3. SWOT Analysis
- 11.2.5.4. Recent Developments
- 11.2.5.5. Financials (Based on Availability)
- 11.2.6 China Merchants Bank
- 11.2.6.1. Overview
- 11.2.6.2. Products
- 11.2.6.3. SWOT Analysis
- 11.2.6.4. Recent Developments
- 11.2.6.5. Financials (Based on Availability)
- 11.2.7 Shanghai Pudong Development Bank
- 11.2.7.1. Overview
- 11.2.7.2. Products
- 11.2.7.3. SWOT Analysis
- 11.2.7.4. Recent Developments
- 11.2.7.5. Financials (Based on Availability)
- 11.2.8 Industrial Bank
- 11.2.8.1. Overview
- 11.2.8.2. Products
- 11.2.8.3. SWOT Analysis
- 11.2.8.4. Recent Developments
- 11.2.8.5. Financials (Based on Availability)
- 11.2.9 China Postal Savings Bank
- 11.2.9.1. Overview
- 11.2.9.2. Products
- 11.2.9.3. SWOT Analysis
- 11.2.9.4. Recent Developments
- 11.2.9.5. Financials (Based on Availability)
- 11.2.10 China Minsheng Bank
- 11.2.10.1. Overview
- 11.2.10.2. Products
- 11.2.10.3. SWOT Analysis
- 11.2.10.4. Recent Developments
- 11.2.10.5. Financials (Based on Availability)
- 11.2.11 Bank of Ningbo
- 11.2.11.1. Overview
- 11.2.11.2. Products
- 11.2.11.3. SWOT Analysis
- 11.2.11.4. Recent Developments
- 11.2.11.5. Financials (Based on Availability)
- 11.2.12 Ping An Bank
- 11.2.12.1. Overview
- 11.2.12.2. Products
- 11.2.12.3. SWOT Analysis
- 11.2.12.4. Recent Developments
- 11.2.12.5. Financials (Based on Availability)
- 11.2.13 Shanghai Bank
- 11.2.13.1. Overview
- 11.2.13.2. Products
- 11.2.13.3. SWOT Analysis
- 11.2.13.4. Recent Developments
- 11.2.13.5. Financials (Based on Availability)
- 11.2.14 Bank of Jiangsu
- 11.2.14.1. Overview
- 11.2.14.2. Products
- 11.2.14.3. SWOT Analysis
- 11.2.14.4. Recent Developments
- 11.2.14.5. Financials (Based on Availability)
- 11.2.1 ICBC
List of Figures
- Figure 1: Global E-CNY Revenue Breakdown (million, %) by Region 2024 & 2032
- Figure 2: North America E-CNY Revenue (million), by Application 2024 & 2032
- Figure 3: North America E-CNY Revenue Share (%), by Application 2024 & 2032
- Figure 4: North America E-CNY Revenue (million), by Types 2024 & 2032
- Figure 5: North America E-CNY Revenue Share (%), by Types 2024 & 2032
- Figure 6: North America E-CNY Revenue (million), by Country 2024 & 2032
- Figure 7: North America E-CNY Revenue Share (%), by Country 2024 & 2032
- Figure 8: South America E-CNY Revenue (million), by Application 2024 & 2032
- Figure 9: South America E-CNY Revenue Share (%), by Application 2024 & 2032
- Figure 10: South America E-CNY Revenue (million), by Types 2024 & 2032
- Figure 11: South America E-CNY Revenue Share (%), by Types 2024 & 2032
- Figure 12: South America E-CNY Revenue (million), by Country 2024 & 2032
- Figure 13: South America E-CNY Revenue Share (%), by Country 2024 & 2032
- Figure 14: Europe E-CNY Revenue (million), by Application 2024 & 2032
- Figure 15: Europe E-CNY Revenue Share (%), by Application 2024 & 2032
- Figure 16: Europe E-CNY Revenue (million), by Types 2024 & 2032
- Figure 17: Europe E-CNY Revenue Share (%), by Types 2024 & 2032
- Figure 18: Europe E-CNY Revenue (million), by Country 2024 & 2032
- Figure 19: Europe E-CNY Revenue Share (%), by Country 2024 & 2032
- Figure 20: Middle East & Africa E-CNY Revenue (million), by Application 2024 & 2032
- Figure 21: Middle East & Africa E-CNY Revenue Share (%), by Application 2024 & 2032
- Figure 22: Middle East & Africa E-CNY Revenue (million), by Types 2024 & 2032
- Figure 23: Middle East & Africa E-CNY Revenue Share (%), by Types 2024 & 2032
- Figure 24: Middle East & Africa E-CNY Revenue (million), by Country 2024 & 2032
- Figure 25: Middle East & Africa E-CNY Revenue Share (%), by Country 2024 & 2032
- Figure 26: Asia Pacific E-CNY Revenue (million), by Application 2024 & 2032
- Figure 27: Asia Pacific E-CNY Revenue Share (%), by Application 2024 & 2032
- Figure 28: Asia Pacific E-CNY Revenue (million), by Types 2024 & 2032
- Figure 29: Asia Pacific E-CNY Revenue Share (%), by Types 2024 & 2032
- Figure 30: Asia Pacific E-CNY Revenue (million), by Country 2024 & 2032
- Figure 31: Asia Pacific E-CNY Revenue Share (%), by Country 2024 & 2032
List of Tables
- Table 1: Global E-CNY Revenue million Forecast, by Region 2019 & 2032
- Table 2: Global E-CNY Revenue million Forecast, by Application 2019 & 2032
- Table 3: Global E-CNY Revenue million Forecast, by Types 2019 & 2032
- Table 4: Global E-CNY Revenue million Forecast, by Region 2019 & 2032
- Table 5: Global E-CNY Revenue million Forecast, by Application 2019 & 2032
- Table 6: Global E-CNY Revenue million Forecast, by Types 2019 & 2032
- Table 7: Global E-CNY Revenue million Forecast, by Country 2019 & 2032
- Table 8: United States E-CNY Revenue (million) Forecast, by Application 2019 & 2032
- Table 9: Canada E-CNY Revenue (million) Forecast, by Application 2019 & 2032
- Table 10: Mexico E-CNY Revenue (million) Forecast, by Application 2019 & 2032
- Table 11: Global E-CNY Revenue million Forecast, by Application 2019 & 2032
- Table 12: Global E-CNY Revenue million Forecast, by Types 2019 & 2032
- Table 13: Global E-CNY Revenue million Forecast, by Country 2019 & 2032
- Table 14: Brazil E-CNY Revenue (million) Forecast, by Application 2019 & 2032
- Table 15: Argentina E-CNY Revenue (million) Forecast, by Application 2019 & 2032
- Table 16: Rest of South America E-CNY Revenue (million) Forecast, by Application 2019 & 2032
- Table 17: Global E-CNY Revenue million Forecast, by Application 2019 & 2032
- Table 18: Global E-CNY Revenue million Forecast, by Types 2019 & 2032
- Table 19: Global E-CNY Revenue million Forecast, by Country 2019 & 2032
- Table 20: United Kingdom E-CNY Revenue (million) Forecast, by Application 2019 & 2032
- Table 21: Germany E-CNY Revenue (million) Forecast, by Application 2019 & 2032
- Table 22: France E-CNY Revenue (million) Forecast, by Application 2019 & 2032
- Table 23: Italy E-CNY Revenue (million) Forecast, by Application 2019 & 2032
- Table 24: Spain E-CNY Revenue (million) Forecast, by Application 2019 & 2032
- Table 25: Russia E-CNY Revenue (million) Forecast, by Application 2019 & 2032
- Table 26: Benelux E-CNY Revenue (million) Forecast, by Application 2019 & 2032
- Table 27: Nordics E-CNY Revenue (million) Forecast, by Application 2019 & 2032
- Table 28: Rest of Europe E-CNY Revenue (million) Forecast, by Application 2019 & 2032
- Table 29: Global E-CNY Revenue million Forecast, by Application 2019 & 2032
- Table 30: Global E-CNY Revenue million Forecast, by Types 2019 & 2032
- Table 31: Global E-CNY Revenue million Forecast, by Country 2019 & 2032
- Table 32: Turkey E-CNY Revenue (million) Forecast, by Application 2019 & 2032
- Table 33: Israel E-CNY Revenue (million) Forecast, by Application 2019 & 2032
- Table 34: GCC E-CNY Revenue (million) Forecast, by Application 2019 & 2032
- Table 35: North Africa E-CNY Revenue (million) Forecast, by Application 2019 & 2032
- Table 36: South Africa E-CNY Revenue (million) Forecast, by Application 2019 & 2032
- Table 37: Rest of Middle East & Africa E-CNY Revenue (million) Forecast, by Application 2019 & 2032
- Table 38: Global E-CNY Revenue million Forecast, by Application 2019 & 2032
- Table 39: Global E-CNY Revenue million Forecast, by Types 2019 & 2032
- Table 40: Global E-CNY Revenue million Forecast, by Country 2019 & 2032
- Table 41: China E-CNY Revenue (million) Forecast, by Application 2019 & 2032
- Table 42: India E-CNY Revenue (million) Forecast, by Application 2019 & 2032
- Table 43: Japan E-CNY Revenue (million) Forecast, by Application 2019 & 2032
- Table 44: South Korea E-CNY Revenue (million) Forecast, by Application 2019 & 2032
- Table 45: ASEAN E-CNY Revenue (million) Forecast, by Application 2019 & 2032
- Table 46: Oceania E-CNY Revenue (million) Forecast, by Application 2019 & 2032
- Table 47: Rest of Asia Pacific E-CNY Revenue (million) Forecast, by Application 2019 & 2032
Frequently Asked Questions
1. What is the projected Compound Annual Growth Rate (CAGR) of the E-CNY?
The projected CAGR is approximately XX%.
2. Which companies are prominent players in the E-CNY?
Key companies in the market include ICBC, China Construction Bank, Agricultural Bank of China, Bank of China, China Bank of Communications, China Merchants Bank, Shanghai Pudong Development Bank, Industrial Bank, China Postal Savings Bank, China Minsheng Bank, Bank of Ningbo, Ping An Bank, Shanghai Bank, Bank of Jiangsu.
3. What are the main segments of the E-CNY?
The market segments include Application, Types.
4. Can you provide details about the market size?
The market size is estimated to be USD XXX million as of 2022.
5. What are some drivers contributing to market growth?
N/A
6. What are the notable trends driving market growth?
N/A
7. Are there any restraints impacting market growth?
N/A
8. Can you provide examples of recent developments in the market?
N/A
9. What pricing options are available for accessing the report?
Pricing options include single-user, multi-user, and enterprise licenses priced at USD 2900.00, USD 4350.00, and USD 5800.00 respectively.
10. Is the market size provided in terms of value or volume?
The market size is provided in terms of value, measured in million.
11. Are there any specific market keywords associated with the report?
Yes, the market keyword associated with the report is "E-CNY," which aids in identifying and referencing the specific market segment covered.
12. How do I determine which pricing option suits my needs best?
The pricing options vary based on user requirements and access needs. Individual users may opt for single-user licenses, while businesses requiring broader access may choose multi-user or enterprise licenses for cost-effective access to the report.
13. Are there any additional resources or data provided in the E-CNY report?
While the report offers comprehensive insights, it's advisable to review the specific contents or supplementary materials provided to ascertain if additional resources or data are available.
14. How can I stay updated on further developments or reports in the E-CNY?
To stay informed about further developments, trends, and reports in the E-CNY, consider subscribing to industry newsletters, following relevant companies and organizations, or regularly checking reputable industry news sources and publications.
Methodology
Step 1 - Identification of Relevant Samples Size from Population Database


Step 2 - Approaches for Defining Global Market Size (Value, Volume* & Price*)

Note*: In applicable scenarios
Step 3 - Data Sources
Primary Research
- Web Analytics
- Survey Reports
- Research Institute
- Latest Research Reports
- Opinion Leaders
Secondary Research
- Annual Reports
- White Paper
- Latest Press Release
- Industry Association
- Paid Database
- Investor Presentations

Step 4 - Data Triangulation
Involves using different sources of information in order to increase the validity of a study
These sources are likely to be stakeholders in a program - participants, other researchers, program staff, other community members, and so on.
Then we put all data in single framework & apply various statistical tools to find out the dynamic on the market.
During the analysis stage, feedback from the stakeholder groups would be compared to determine areas of agreement as well as areas of divergence


