
Key Insights
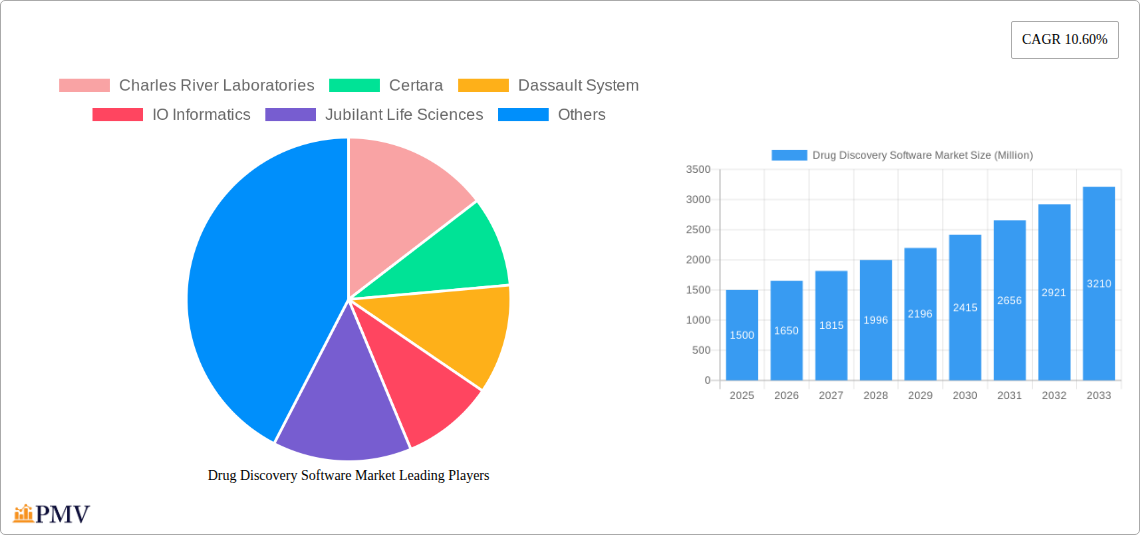
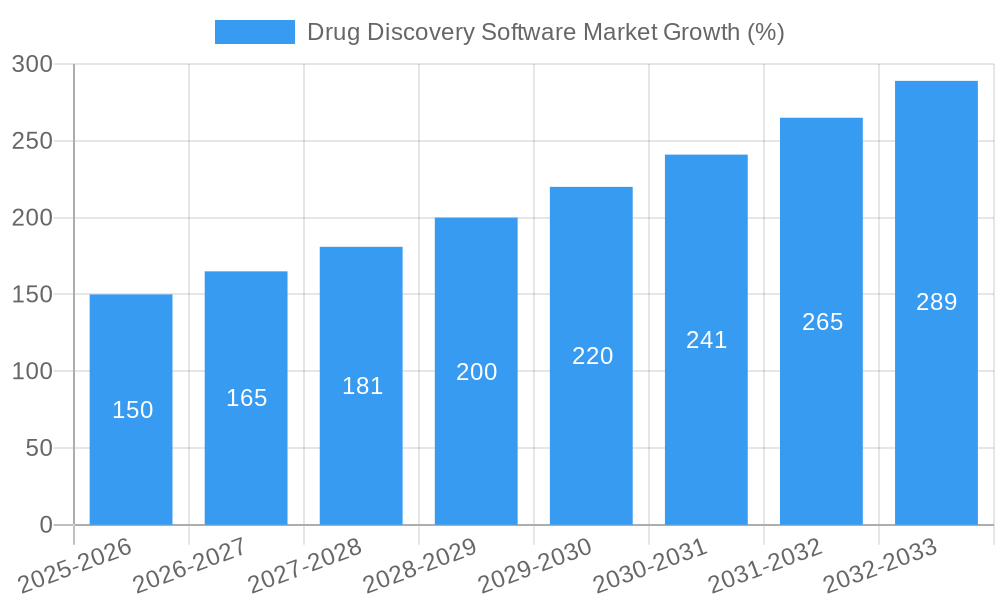
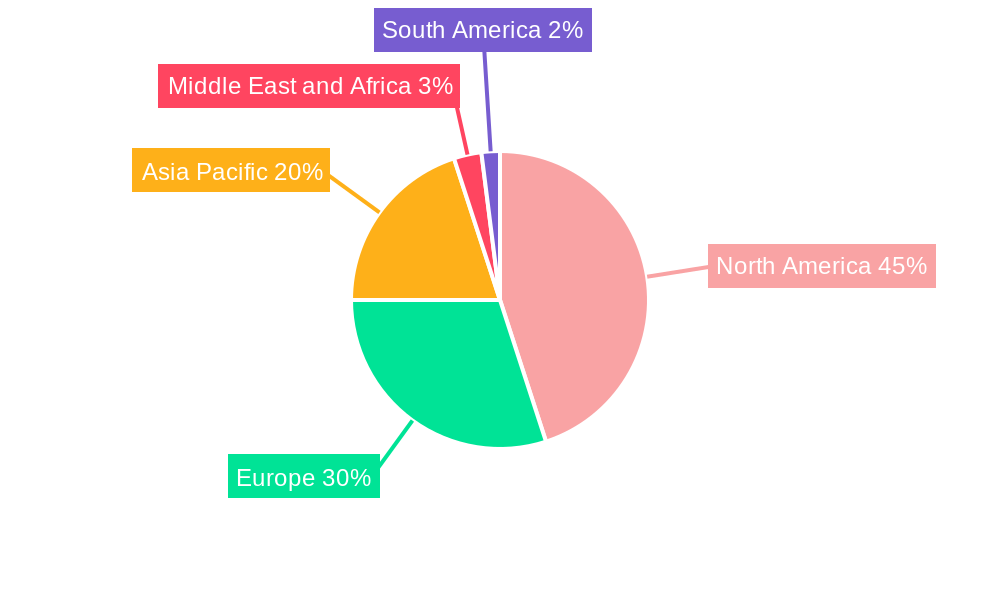
The Drug Discovery Software market is experiencing robust growth, driven by the increasing demand for efficient and cost-effective drug development processes within the pharmaceutical and biotechnology sectors. A Compound Annual Growth Rate (CAGR) of 10.60% from 2019-2033 indicates a significant expansion, with the market expected to reach substantial value by 2033. Key drivers include the rising prevalence of chronic diseases necessitating novel therapies, advancements in artificial intelligence and machine learning for drug design, and the growing adoption of cloud-based solutions for enhanced collaboration and data management. The market is segmented by function (sequencing and target data analysis, docking, molecular modeling, libraries and database preparation, and other functions) and end-user (pharmaceutical and biotechnology companies, contract research organizations (CROs), and other end-users). The North American region, particularly the United States, currently holds a dominant market share due to the presence of major pharmaceutical companies, robust research infrastructure, and significant investments in drug discovery research. However, the Asia-Pacific region is anticipated to witness substantial growth in the coming years fueled by rising healthcare expenditure and expanding pharmaceutical industries in countries like China and India. Challenges include the high cost of software licenses and implementation, the need for specialized expertise to operate these complex tools, and regulatory hurdles associated with drug development. Nevertheless, the ongoing technological advancements and increasing adoption of innovative drug discovery techniques will continue to propel market expansion throughout the forecast period.
The competitive landscape is characterized by a mix of established players like Charles River Laboratories, Thermo Fisher Scientific, and Dassault Systèmes, alongside emerging technology providers and specialized CROs. Strategic partnerships, mergers and acquisitions, and the continuous development of advanced functionalities are shaping the market dynamics. The increasing focus on personalized medicine and precision oncology is also creating new avenues for drug discovery software providers, leading to the development of specialized solutions tailored to specific therapeutic areas. This competitive landscape and the inherent growth drivers indicate substantial market opportunities for both established and emerging companies to capitalize on the evolving needs of the pharmaceutical and biotechnology industries. The ongoing trend of outsourcing drug discovery activities to CROs is further enhancing market demand, as CROs increasingly leverage software solutions to optimize their services and improve efficiency.
This in-depth report provides a comprehensive analysis of the Drug Discovery Software Market, offering invaluable insights for stakeholders across the pharmaceutical, biotechnology, and contract research sectors. The report covers market size, growth projections, competitive dynamics, technological advancements, and key regulatory considerations during the study period (2019-2033), with a focus on the base year 2025 and a forecast period of 2025-2033. The historical period analyzed is 2019-2024. This report is designed to be used without modification.
Drug Discovery Software Market Market Structure & Competitive Dynamics
The Drug Discovery Software market exhibits a moderately concentrated structure, with key players vying for market share. The market is characterized by a dynamic innovation ecosystem, driven by ongoing technological advancements in artificial intelligence (AI), machine learning (ML), and high-performance computing (HPC). Stringent regulatory frameworks, particularly those concerning data privacy and drug safety, significantly influence market dynamics. The presence of substitute technologies, such as traditional laboratory methods, creates competitive pressure. End-user trends, characterized by increasing adoption of cloud-based solutions and a focus on improving efficiency and reducing drug development timelines, shape market demand. Mergers and acquisitions (M&A) activity is prominent, with deals valued at approximately xx Million in the past five years, reflecting a consolidation trend within the industry. Major players such as Thermo Fisher Scientific, Dassault Systèmes, and Certara command significant market share, while smaller specialized firms focus on niche applications. The market share distribution is expected to evolve further as technology advances and consolidations reshape the landscape. Innovation is paramount, with companies continually enhancing their software capabilities to cater to the evolving needs of drug discovery researchers.
- Market Concentration: Moderately Concentrated
- M&A Activity: Significant, with deal values totaling approximately xx Million (2019-2024)
- Key Players' Market Share: Thermo Fisher Scientific (xx%), Dassault Systèmes (xx%), Certara (xx%), Others (xx%).
Drug Discovery Software Market Industry Trends & Insights
The Drug Discovery Software market is experiencing robust growth, driven by several key factors. The escalating demand for faster and more efficient drug discovery processes fuels market expansion. The integration of AI and ML into drug discovery workflows is revolutionizing the industry, leading to increased accuracy, reduced costs, and accelerated timelines. This technological disruption is prompting a paradigm shift in drug discovery practices, with significant implications for market players. The increasing adoption of cloud-based solutions enhances accessibility, scalability, and collaboration opportunities. A preference for integrated platforms offering a comprehensive suite of functionalities further shapes market demand. The compound annual growth rate (CAGR) during the forecast period (2025-2033) is projected to be xx%, driven by these aforementioned factors and expected market penetration exceeding xx% by 2033. The market's competitive dynamics are shaped by both established industry giants and emerging innovative firms, continuously pushing the technological boundaries and enhancing software functionalities.
Dominant Markets & Segments in Drug Discovery Software Market
The North American region currently dominates the drug discovery software market, driven by a confluence of factors.
- Leading Region: North America
- Key Drivers: Robust R&D investments, stringent regulatory frameworks, presence of major pharmaceutical and biotechnology companies.
- Dominant Segment (Function): Molecular Modeling
- Key Drivers: Growing need for accurate prediction of drug-target interactions, ability to simulate and analyze complex molecular structures, advancement in computational capabilities.
- Dominant Segment (End User): Pharmaceutical and Biotechnology Companies
- Key Drivers: Increased R&D spending, adoption of sophisticated drug discovery technologies, growing pipeline of new drugs.
Other segments, including Sequencing and Target Data Analysis, Docking, Libraries and Database Preparation, and Other Functions, show strong growth potential, fueled by continuous technological advancements and the increasing sophistication of drug discovery research. Contract Research Organizations (CROs) and other end-users are also contributing significantly to market expansion. Geographic expansion is also anticipated, particularly in regions with burgeoning pharmaceutical and biotechnology industries.
Drug Discovery Software Market Product Innovations
Recent product innovations in the drug discovery software market focus on enhanced AI and ML capabilities, improved user interfaces, and seamless integration with existing laboratory workflows. These innovations aim to streamline the drug discovery process, reducing timelines and costs. The market is witnessing the emergence of cloud-based solutions that offer greater scalability and collaboration features. These solutions cater to the needs of diverse research teams by simplifying data sharing and accelerating analysis. The integration of predictive modeling and simulation tools is transforming how drug candidates are evaluated, improving accuracy and reducing risks associated with traditional drug development approaches.
Report Segmentation & Scope
The report segments the Drug Discovery Software market based on Function (Sequencing and Target Data Analysis, Docking, Molecular Modeling, Libraries and Database Preparation, Other Functions) and End User (Pharmaceutical and Biotechnology Companies, Contract Research Organizations (CROs), Other End Users). Each segment's growth projection, market size, and competitive landscape are thoroughly analyzed. The report offers detailed analysis of each segment, including growth projections based on current trends and technological advancements within each area. For instance, the Molecular Modeling segment shows strong growth potential due to its critical role in drug design and optimization.
Key Drivers of Drug Discovery Software Market Growth
Several factors drive the growth of the drug discovery software market. Advancements in AI and ML algorithms significantly enhance the accuracy and speed of drug discovery. Rising R&D investments by pharmaceutical and biotechnology companies fuel demand for advanced software solutions. Government initiatives and supportive regulatory frameworks promote innovation and adoption of new technologies. The need for improved efficiency and reduced development costs further propels market growth.
Challenges in the Drug Discovery Software Market Sector
The drug discovery software market faces certain challenges. The high cost of developing and implementing advanced software solutions can limit adoption by smaller companies. Data security and privacy concerns remain critical, requiring robust solutions to address these issues. The integration of software with existing laboratory workflows can be complex and time-consuming. Intense competition among vendors and the constant need for software upgrades pose ongoing challenges.
Leading Players in the Drug Discovery Software Market Market
- Charles River Laboratories
- Certara
- Dassault Systèmes
- IO Informatics
- Jubilant Life Sciences
- Thermo Fisher Scientific
- Aragen Lifescience Pvt Ltd
- Infosys
- PerkinElmer
- Selvita
- Collaborative Drug Discovery
- IBM
Key Developments in Drug Discovery Software Market Sector
- February 2023: Insilico Medicine received FDA Orphan Drug Designation for a generative AI-discovered and designed drug for idiopathic pulmonary fibrosis. This highlights the growing acceptance of AI in drug discovery.
- February 2023: Evotec SE expanded its multi-target drug discovery agreement with Related Sciences, signaling a trend towards collaborative drug discovery efforts leveraging advanced technologies.
Strategic Drug Discovery Software Market Market Outlook
The Drug Discovery Software market is poised for continued growth, driven by technological advancements and increasing demand for efficient drug development solutions. Strategic opportunities exist for companies that can leverage AI and ML effectively, offer seamless integrations with existing workflows, and ensure data security and privacy. Companies focusing on innovative solutions catering to specific therapeutic areas stand to benefit significantly. The market's long-term outlook is optimistic, fueled by the constant pursuit of faster, more effective, and less expensive drug development.
Drug Discovery Software Market Segmentation
-
1. Function
- 1.1. Sequencing and Target Data Analysis
- 1.2. Docking
- 1.3. Molecular Modeling
- 1.4. Libraries and Database Preparation
- 1.5. Other Functions
-
2. End User
- 2.1. Pharmaceutical and Biotechnology Companies
- 2.2. Contract Research Organizations (CROS)
- 2.3. Other End Users
Drug Discovery Software Market Segmentation By Geography
-
1. North America
- 1.1. United States
- 1.2. Canada
- 1.3. Mexico
-
2. Europe
- 2.1. Germany
- 2.2. United Kingdom
- 2.3. France
- 2.4. Italy
- 2.5. Spain
- 2.6. Rest of Europe
-
3. Asia Pacific
- 3.1. China
- 3.2. Japan
- 3.3. India
- 3.4. Australia
- 3.5. South Korea
- 3.6. Rest of Asia Pacific
-
4. Middle East and Africa
- 4.1. GCC
- 4.2. South Africa
- 4.3. Rest of Middle East and Africa
-
5. South America
- 5.1. Brazil
- 5.2. Argentina
- 5.3. Rest of South America
Drug Discovery Software Market REPORT HIGHLIGHTS
| Aspects | Details |
|---|---|
| Study Period | 2019-2033 |
| Base Year | 2024 |
| Estimated Year | 2025 |
| Forecast Period | 2025-2033 |
| Historical Period | 2019-2024 |
| Growth Rate | CAGR of 10.60% from 2019-2033 |
| Segmentation |
|
Table of Contents
- 1. Introduction
- 1.1. Research Scope
- 1.2. Market Segmentation
- 1.3. Research Methodology
- 1.4. Definitions and Assumptions
- 2. Executive Summary
- 2.1. Introduction
- 3. Market Dynamics
- 3.1. Introduction
- 3.2. Market Drivers
- 3.2.1. Technological Advancements in Data Mining and Analytics; Increasing R&D on Drug Discovery
- 3.3. Market Restrains
- 3.3.1. High Pricing and Setup Cost of Informatics Software
- 3.4. Market Trends
- 3.4.1. Pharmaceutical and Biotechnology Companies Segment is Expected to Witness Growth Over the Forecast Period
- 4. Market Factor Analysis
- 4.1. Porters Five Forces
- 4.2. Supply/Value Chain
- 4.3. PESTEL analysis
- 4.4. Market Entropy
- 4.5. Patent/Trademark Analysis
- 5. Global Drug Discovery Software Market Analysis, Insights and Forecast, 2019-2031
- 5.1. Market Analysis, Insights and Forecast - by Function
- 5.1.1. Sequencing and Target Data Analysis
- 5.1.2. Docking
- 5.1.3. Molecular Modeling
- 5.1.4. Libraries and Database Preparation
- 5.1.5. Other Functions
- 5.2. Market Analysis, Insights and Forecast - by End User
- 5.2.1. Pharmaceutical and Biotechnology Companies
- 5.2.2. Contract Research Organizations (CROS)
- 5.2.3. Other End Users
- 5.3. Market Analysis, Insights and Forecast - by Region
- 5.3.1. North America
- 5.3.2. Europe
- 5.3.3. Asia Pacific
- 5.3.4. Middle East and Africa
- 5.3.5. South America
- 5.1. Market Analysis, Insights and Forecast - by Function
- 6. North America Drug Discovery Software Market Analysis, Insights and Forecast, 2019-2031
- 6.1. Market Analysis, Insights and Forecast - by Function
- 6.1.1. Sequencing and Target Data Analysis
- 6.1.2. Docking
- 6.1.3. Molecular Modeling
- 6.1.4. Libraries and Database Preparation
- 6.1.5. Other Functions
- 6.2. Market Analysis, Insights and Forecast - by End User
- 6.2.1. Pharmaceutical and Biotechnology Companies
- 6.2.2. Contract Research Organizations (CROS)
- 6.2.3. Other End Users
- 6.1. Market Analysis, Insights and Forecast - by Function
- 7. Europe Drug Discovery Software Market Analysis, Insights and Forecast, 2019-2031
- 7.1. Market Analysis, Insights and Forecast - by Function
- 7.1.1. Sequencing and Target Data Analysis
- 7.1.2. Docking
- 7.1.3. Molecular Modeling
- 7.1.4. Libraries and Database Preparation
- 7.1.5. Other Functions
- 7.2. Market Analysis, Insights and Forecast - by End User
- 7.2.1. Pharmaceutical and Biotechnology Companies
- 7.2.2. Contract Research Organizations (CROS)
- 7.2.3. Other End Users
- 7.1. Market Analysis, Insights and Forecast - by Function
- 8. Asia Pacific Drug Discovery Software Market Analysis, Insights and Forecast, 2019-2031
- 8.1. Market Analysis, Insights and Forecast - by Function
- 8.1.1. Sequencing and Target Data Analysis
- 8.1.2. Docking
- 8.1.3. Molecular Modeling
- 8.1.4. Libraries and Database Preparation
- 8.1.5. Other Functions
- 8.2. Market Analysis, Insights and Forecast - by End User
- 8.2.1. Pharmaceutical and Biotechnology Companies
- 8.2.2. Contract Research Organizations (CROS)
- 8.2.3. Other End Users
- 8.1. Market Analysis, Insights and Forecast - by Function
- 9. Middle East and Africa Drug Discovery Software Market Analysis, Insights and Forecast, 2019-2031
- 9.1. Market Analysis, Insights and Forecast - by Function
- 9.1.1. Sequencing and Target Data Analysis
- 9.1.2. Docking
- 9.1.3. Molecular Modeling
- 9.1.4. Libraries and Database Preparation
- 9.1.5. Other Functions
- 9.2. Market Analysis, Insights and Forecast - by End User
- 9.2.1. Pharmaceutical and Biotechnology Companies
- 9.2.2. Contract Research Organizations (CROS)
- 9.2.3. Other End Users
- 9.1. Market Analysis, Insights and Forecast - by Function
- 10. South America Drug Discovery Software Market Analysis, Insights and Forecast, 2019-2031
- 10.1. Market Analysis, Insights and Forecast - by Function
- 10.1.1. Sequencing and Target Data Analysis
- 10.1.2. Docking
- 10.1.3. Molecular Modeling
- 10.1.4. Libraries and Database Preparation
- 10.1.5. Other Functions
- 10.2. Market Analysis, Insights and Forecast - by End User
- 10.2.1. Pharmaceutical and Biotechnology Companies
- 10.2.2. Contract Research Organizations (CROS)
- 10.2.3. Other End Users
- 10.1. Market Analysis, Insights and Forecast - by Function
- 11. North America Drug Discovery Software Market Analysis, Insights and Forecast, 2019-2031
- 11.1. Market Analysis, Insights and Forecast - By Country/Sub-region
- 11.1.1 United States
- 11.1.2 Canada
- 11.1.3 Mexico
- 12. Europe Drug Discovery Software Market Analysis, Insights and Forecast, 2019-2031
- 12.1. Market Analysis, Insights and Forecast - By Country/Sub-region
- 12.1.1 Germany
- 12.1.2 United Kingdom
- 12.1.3 France
- 12.1.4 Italy
- 12.1.5 Spain
- 12.1.6 Rest of Europe
- 13. Asia Pacific Drug Discovery Software Market Analysis, Insights and Forecast, 2019-2031
- 13.1. Market Analysis, Insights and Forecast - By Country/Sub-region
- 13.1.1 China
- 13.1.2 Japan
- 13.1.3 India
- 13.1.4 Australia
- 13.1.5 South Korea
- 13.1.6 Rest of Asia Pacific
- 14. Middle East and Africa Drug Discovery Software Market Analysis, Insights and Forecast, 2019-2031
- 14.1. Market Analysis, Insights and Forecast - By Country/Sub-region
- 14.1.1 GCC
- 14.1.2 South Africa
- 14.1.3 Rest of Middle East and Africa
- 15. South America Drug Discovery Software Market Analysis, Insights and Forecast, 2019-2031
- 15.1. Market Analysis, Insights and Forecast - By Country/Sub-region
- 15.1.1 Brazil
- 15.1.2 Argentina
- 15.1.3 Rest of South America
- 16. Competitive Analysis
- 16.1. Global Market Share Analysis 2024
- 16.2. Company Profiles
- 16.2.1 Charles River Laboratories
- 16.2.1.1. Overview
- 16.2.1.2. Products
- 16.2.1.3. SWOT Analysis
- 16.2.1.4. Recent Developments
- 16.2.1.5. Financials (Based on Availability)
- 16.2.2 Certara
- 16.2.2.1. Overview
- 16.2.2.2. Products
- 16.2.2.3. SWOT Analysis
- 16.2.2.4. Recent Developments
- 16.2.2.5. Financials (Based on Availability)
- 16.2.3 Dassault System
- 16.2.3.1. Overview
- 16.2.3.2. Products
- 16.2.3.3. SWOT Analysis
- 16.2.3.4. Recent Developments
- 16.2.3.5. Financials (Based on Availability)
- 16.2.4 IO Informatics
- 16.2.4.1. Overview
- 16.2.4.2. Products
- 16.2.4.3. SWOT Analysis
- 16.2.4.4. Recent Developments
- 16.2.4.5. Financials (Based on Availability)
- 16.2.5 Jubilant Life Sciences
- 16.2.5.1. Overview
- 16.2.5.2. Products
- 16.2.5.3. SWOT Analysis
- 16.2.5.4. Recent Developments
- 16.2.5.5. Financials (Based on Availability)
- 16.2.6 Thermo Fisher Scientific
- 16.2.6.1. Overview
- 16.2.6.2. Products
- 16.2.6.3. SWOT Analysis
- 16.2.6.4. Recent Developments
- 16.2.6.5. Financials (Based on Availability)
- 16.2.7 Aragen Lifescience Pvt Ltd
- 16.2.7.1. Overview
- 16.2.7.2. Products
- 16.2.7.3. SWOT Analysis
- 16.2.7.4. Recent Developments
- 16.2.7.5. Financials (Based on Availability)
- 16.2.8 Infosys
- 16.2.8.1. Overview
- 16.2.8.2. Products
- 16.2.8.3. SWOT Analysis
- 16.2.8.4. Recent Developments
- 16.2.8.5. Financials (Based on Availability)
- 16.2.9 Perkinelmer
- 16.2.9.1. Overview
- 16.2.9.2. Products
- 16.2.9.3. SWOT Analysis
- 16.2.9.4. Recent Developments
- 16.2.9.5. Financials (Based on Availability)
- 16.2.10 Selvita
- 16.2.10.1. Overview
- 16.2.10.2. Products
- 16.2.10.3. SWOT Analysis
- 16.2.10.4. Recent Developments
- 16.2.10.5. Financials (Based on Availability)
- 16.2.11 Collaborative Drug Discovery
- 16.2.11.1. Overview
- 16.2.11.2. Products
- 16.2.11.3. SWOT Analysis
- 16.2.11.4. Recent Developments
- 16.2.11.5. Financials (Based on Availability)
- 16.2.12 IBM
- 16.2.12.1. Overview
- 16.2.12.2. Products
- 16.2.12.3. SWOT Analysis
- 16.2.12.4. Recent Developments
- 16.2.12.5. Financials (Based on Availability)
- 16.2.1 Charles River Laboratories
List of Figures
- Figure 1: Global Drug Discovery Software Market Revenue Breakdown (Million, %) by Region 2024 & 2032
- Figure 2: North America Drug Discovery Software Market Revenue (Million), by Country 2024 & 2032
- Figure 3: North America Drug Discovery Software Market Revenue Share (%), by Country 2024 & 2032
- Figure 4: Europe Drug Discovery Software Market Revenue (Million), by Country 2024 & 2032
- Figure 5: Europe Drug Discovery Software Market Revenue Share (%), by Country 2024 & 2032
- Figure 6: Asia Pacific Drug Discovery Software Market Revenue (Million), by Country 2024 & 2032
- Figure 7: Asia Pacific Drug Discovery Software Market Revenue Share (%), by Country 2024 & 2032
- Figure 8: Middle East and Africa Drug Discovery Software Market Revenue (Million), by Country 2024 & 2032
- Figure 9: Middle East and Africa Drug Discovery Software Market Revenue Share (%), by Country 2024 & 2032
- Figure 10: South America Drug Discovery Software Market Revenue (Million), by Country 2024 & 2032
- Figure 11: South America Drug Discovery Software Market Revenue Share (%), by Country 2024 & 2032
- Figure 12: North America Drug Discovery Software Market Revenue (Million), by Function 2024 & 2032
- Figure 13: North America Drug Discovery Software Market Revenue Share (%), by Function 2024 & 2032
- Figure 14: North America Drug Discovery Software Market Revenue (Million), by End User 2024 & 2032
- Figure 15: North America Drug Discovery Software Market Revenue Share (%), by End User 2024 & 2032
- Figure 16: North America Drug Discovery Software Market Revenue (Million), by Country 2024 & 2032
- Figure 17: North America Drug Discovery Software Market Revenue Share (%), by Country 2024 & 2032
- Figure 18: Europe Drug Discovery Software Market Revenue (Million), by Function 2024 & 2032
- Figure 19: Europe Drug Discovery Software Market Revenue Share (%), by Function 2024 & 2032
- Figure 20: Europe Drug Discovery Software Market Revenue (Million), by End User 2024 & 2032
- Figure 21: Europe Drug Discovery Software Market Revenue Share (%), by End User 2024 & 2032
- Figure 22: Europe Drug Discovery Software Market Revenue (Million), by Country 2024 & 2032
- Figure 23: Europe Drug Discovery Software Market Revenue Share (%), by Country 2024 & 2032
- Figure 24: Asia Pacific Drug Discovery Software Market Revenue (Million), by Function 2024 & 2032
- Figure 25: Asia Pacific Drug Discovery Software Market Revenue Share (%), by Function 2024 & 2032
- Figure 26: Asia Pacific Drug Discovery Software Market Revenue (Million), by End User 2024 & 2032
- Figure 27: Asia Pacific Drug Discovery Software Market Revenue Share (%), by End User 2024 & 2032
- Figure 28: Asia Pacific Drug Discovery Software Market Revenue (Million), by Country 2024 & 2032
- Figure 29: Asia Pacific Drug Discovery Software Market Revenue Share (%), by Country 2024 & 2032
- Figure 30: Middle East and Africa Drug Discovery Software Market Revenue (Million), by Function 2024 & 2032
- Figure 31: Middle East and Africa Drug Discovery Software Market Revenue Share (%), by Function 2024 & 2032
- Figure 32: Middle East and Africa Drug Discovery Software Market Revenue (Million), by End User 2024 & 2032
- Figure 33: Middle East and Africa Drug Discovery Software Market Revenue Share (%), by End User 2024 & 2032
- Figure 34: Middle East and Africa Drug Discovery Software Market Revenue (Million), by Country 2024 & 2032
- Figure 35: Middle East and Africa Drug Discovery Software Market Revenue Share (%), by Country 2024 & 2032
- Figure 36: South America Drug Discovery Software Market Revenue (Million), by Function 2024 & 2032
- Figure 37: South America Drug Discovery Software Market Revenue Share (%), by Function 2024 & 2032
- Figure 38: South America Drug Discovery Software Market Revenue (Million), by End User 2024 & 2032
- Figure 39: South America Drug Discovery Software Market Revenue Share (%), by End User 2024 & 2032
- Figure 40: South America Drug Discovery Software Market Revenue (Million), by Country 2024 & 2032
- Figure 41: South America Drug Discovery Software Market Revenue Share (%), by Country 2024 & 2032
List of Tables
- Table 1: Global Drug Discovery Software Market Revenue Million Forecast, by Region 2019 & 2032
- Table 2: Global Drug Discovery Software Market Revenue Million Forecast, by Function 2019 & 2032
- Table 3: Global Drug Discovery Software Market Revenue Million Forecast, by End User 2019 & 2032
- Table 4: Global Drug Discovery Software Market Revenue Million Forecast, by Region 2019 & 2032
- Table 5: Global Drug Discovery Software Market Revenue Million Forecast, by Country 2019 & 2032
- Table 6: United States Drug Discovery Software Market Revenue (Million) Forecast, by Application 2019 & 2032
- Table 7: Canada Drug Discovery Software Market Revenue (Million) Forecast, by Application 2019 & 2032
- Table 8: Mexico Drug Discovery Software Market Revenue (Million) Forecast, by Application 2019 & 2032
- Table 9: Global Drug Discovery Software Market Revenue Million Forecast, by Country 2019 & 2032
- Table 10: Germany Drug Discovery Software Market Revenue (Million) Forecast, by Application 2019 & 2032
- Table 11: United Kingdom Drug Discovery Software Market Revenue (Million) Forecast, by Application 2019 & 2032
- Table 12: France Drug Discovery Software Market Revenue (Million) Forecast, by Application 2019 & 2032
- Table 13: Italy Drug Discovery Software Market Revenue (Million) Forecast, by Application 2019 & 2032
- Table 14: Spain Drug Discovery Software Market Revenue (Million) Forecast, by Application 2019 & 2032
- Table 15: Rest of Europe Drug Discovery Software Market Revenue (Million) Forecast, by Application 2019 & 2032
- Table 16: Global Drug Discovery Software Market Revenue Million Forecast, by Country 2019 & 2032
- Table 17: China Drug Discovery Software Market Revenue (Million) Forecast, by Application 2019 & 2032
- Table 18: Japan Drug Discovery Software Market Revenue (Million) Forecast, by Application 2019 & 2032
- Table 19: India Drug Discovery Software Market Revenue (Million) Forecast, by Application 2019 & 2032
- Table 20: Australia Drug Discovery Software Market Revenue (Million) Forecast, by Application 2019 & 2032
- Table 21: South Korea Drug Discovery Software Market Revenue (Million) Forecast, by Application 2019 & 2032
- Table 22: Rest of Asia Pacific Drug Discovery Software Market Revenue (Million) Forecast, by Application 2019 & 2032
- Table 23: Global Drug Discovery Software Market Revenue Million Forecast, by Country 2019 & 2032
- Table 24: GCC Drug Discovery Software Market Revenue (Million) Forecast, by Application 2019 & 2032
- Table 25: South Africa Drug Discovery Software Market Revenue (Million) Forecast, by Application 2019 & 2032
- Table 26: Rest of Middle East and Africa Drug Discovery Software Market Revenue (Million) Forecast, by Application 2019 & 2032
- Table 27: Global Drug Discovery Software Market Revenue Million Forecast, by Country 2019 & 2032
- Table 28: Brazil Drug Discovery Software Market Revenue (Million) Forecast, by Application 2019 & 2032
- Table 29: Argentina Drug Discovery Software Market Revenue (Million) Forecast, by Application 2019 & 2032
- Table 30: Rest of South America Drug Discovery Software Market Revenue (Million) Forecast, by Application 2019 & 2032
- Table 31: Global Drug Discovery Software Market Revenue Million Forecast, by Function 2019 & 2032
- Table 32: Global Drug Discovery Software Market Revenue Million Forecast, by End User 2019 & 2032
- Table 33: Global Drug Discovery Software Market Revenue Million Forecast, by Country 2019 & 2032
- Table 34: United States Drug Discovery Software Market Revenue (Million) Forecast, by Application 2019 & 2032
- Table 35: Canada Drug Discovery Software Market Revenue (Million) Forecast, by Application 2019 & 2032
- Table 36: Mexico Drug Discovery Software Market Revenue (Million) Forecast, by Application 2019 & 2032
- Table 37: Global Drug Discovery Software Market Revenue Million Forecast, by Function 2019 & 2032
- Table 38: Global Drug Discovery Software Market Revenue Million Forecast, by End User 2019 & 2032
- Table 39: Global Drug Discovery Software Market Revenue Million Forecast, by Country 2019 & 2032
- Table 40: Germany Drug Discovery Software Market Revenue (Million) Forecast, by Application 2019 & 2032
- Table 41: United Kingdom Drug Discovery Software Market Revenue (Million) Forecast, by Application 2019 & 2032
- Table 42: France Drug Discovery Software Market Revenue (Million) Forecast, by Application 2019 & 2032
- Table 43: Italy Drug Discovery Software Market Revenue (Million) Forecast, by Application 2019 & 2032
- Table 44: Spain Drug Discovery Software Market Revenue (Million) Forecast, by Application 2019 & 2032
- Table 45: Rest of Europe Drug Discovery Software Market Revenue (Million) Forecast, by Application 2019 & 2032
- Table 46: Global Drug Discovery Software Market Revenue Million Forecast, by Function 2019 & 2032
- Table 47: Global Drug Discovery Software Market Revenue Million Forecast, by End User 2019 & 2032
- Table 48: Global Drug Discovery Software Market Revenue Million Forecast, by Country 2019 & 2032
- Table 49: China Drug Discovery Software Market Revenue (Million) Forecast, by Application 2019 & 2032
- Table 50: Japan Drug Discovery Software Market Revenue (Million) Forecast, by Application 2019 & 2032
- Table 51: India Drug Discovery Software Market Revenue (Million) Forecast, by Application 2019 & 2032
- Table 52: Australia Drug Discovery Software Market Revenue (Million) Forecast, by Application 2019 & 2032
- Table 53: South Korea Drug Discovery Software Market Revenue (Million) Forecast, by Application 2019 & 2032
- Table 54: Rest of Asia Pacific Drug Discovery Software Market Revenue (Million) Forecast, by Application 2019 & 2032
- Table 55: Global Drug Discovery Software Market Revenue Million Forecast, by Function 2019 & 2032
- Table 56: Global Drug Discovery Software Market Revenue Million Forecast, by End User 2019 & 2032
- Table 57: Global Drug Discovery Software Market Revenue Million Forecast, by Country 2019 & 2032
- Table 58: GCC Drug Discovery Software Market Revenue (Million) Forecast, by Application 2019 & 2032
- Table 59: South Africa Drug Discovery Software Market Revenue (Million) Forecast, by Application 2019 & 2032
- Table 60: Rest of Middle East and Africa Drug Discovery Software Market Revenue (Million) Forecast, by Application 2019 & 2032
- Table 61: Global Drug Discovery Software Market Revenue Million Forecast, by Function 2019 & 2032
- Table 62: Global Drug Discovery Software Market Revenue Million Forecast, by End User 2019 & 2032
- Table 63: Global Drug Discovery Software Market Revenue Million Forecast, by Country 2019 & 2032
- Table 64: Brazil Drug Discovery Software Market Revenue (Million) Forecast, by Application 2019 & 2032
- Table 65: Argentina Drug Discovery Software Market Revenue (Million) Forecast, by Application 2019 & 2032
- Table 66: Rest of South America Drug Discovery Software Market Revenue (Million) Forecast, by Application 2019 & 2032
Frequently Asked Questions
1. What is the projected Compound Annual Growth Rate (CAGR) of the Drug Discovery Software Market?
The projected CAGR is approximately 10.60%.
2. Which companies are prominent players in the Drug Discovery Software Market?
Key companies in the market include Charles River Laboratories, Certara, Dassault System, IO Informatics, Jubilant Life Sciences, Thermo Fisher Scientific, Aragen Lifescience Pvt Ltd, Infosys, Perkinelmer, Selvita, Collaborative Drug Discovery, IBM.
3. What are the main segments of the Drug Discovery Software Market?
The market segments include Function, End User.
4. Can you provide details about the market size?
The market size is estimated to be USD XX Million as of 2022.
5. What are some drivers contributing to market growth?
Technological Advancements in Data Mining and Analytics; Increasing R&D on Drug Discovery.
6. What are the notable trends driving market growth?
Pharmaceutical and Biotechnology Companies Segment is Expected to Witness Growth Over the Forecast Period.
7. Are there any restraints impacting market growth?
High Pricing and Setup Cost of Informatics Software.
8. Can you provide examples of recent developments in the market?
February 2023: Insilico Medicine, a clinical-stage end-to-end generative artificial intelligence (AI)-driven drug discovery company, received FDA Orphan Drug Designation for generative AI discovered and designed drug for idiopathic pulmonary fibrosis.
9. What pricing options are available for accessing the report?
Pricing options include single-user, multi-user, and enterprise licenses priced at USD 4750, USD 5250, and USD 8750 respectively.
10. Is the market size provided in terms of value or volume?
The market size is provided in terms of value, measured in Million.
11. Are there any specific market keywords associated with the report?
Yes, the market keyword associated with the report is "Drug Discovery Software Market," which aids in identifying and referencing the specific market segment covered.
12. How do I determine which pricing option suits my needs best?
The pricing options vary based on user requirements and access needs. Individual users may opt for single-user licenses, while businesses requiring broader access may choose multi-user or enterprise licenses for cost-effective access to the report.
13. Are there any additional resources or data provided in the Drug Discovery Software Market report?
While the report offers comprehensive insights, it's advisable to review the specific contents or supplementary materials provided to ascertain if additional resources or data are available.
14. How can I stay updated on further developments or reports in the Drug Discovery Software Market?
To stay informed about further developments, trends, and reports in the Drug Discovery Software Market, consider subscribing to industry newsletters, following relevant companies and organizations, or regularly checking reputable industry news sources and publications.
Methodology
Step 1 - Identification of Relevant Samples Size from Population Database


Step 2 - Approaches for Defining Global Market Size (Value, Volume* & Price*)

Note*: In applicable scenarios
Step 3 - Data Sources
Primary Research
- Web Analytics
- Survey Reports
- Research Institute
- Latest Research Reports
- Opinion Leaders
Secondary Research
- Annual Reports
- White Paper
- Latest Press Release
- Industry Association
- Paid Database
- Investor Presentations

Step 4 - Data Triangulation
Involves using different sources of information in order to increase the validity of a study
These sources are likely to be stakeholders in a program - participants, other researchers, program staff, other community members, and so on.
Then we put all data in single framework & apply various statistical tools to find out the dynamic on the market.
During the analysis stage, feedback from the stakeholder groups would be compared to determine areas of agreement as well as areas of divergence


