
Key Insights
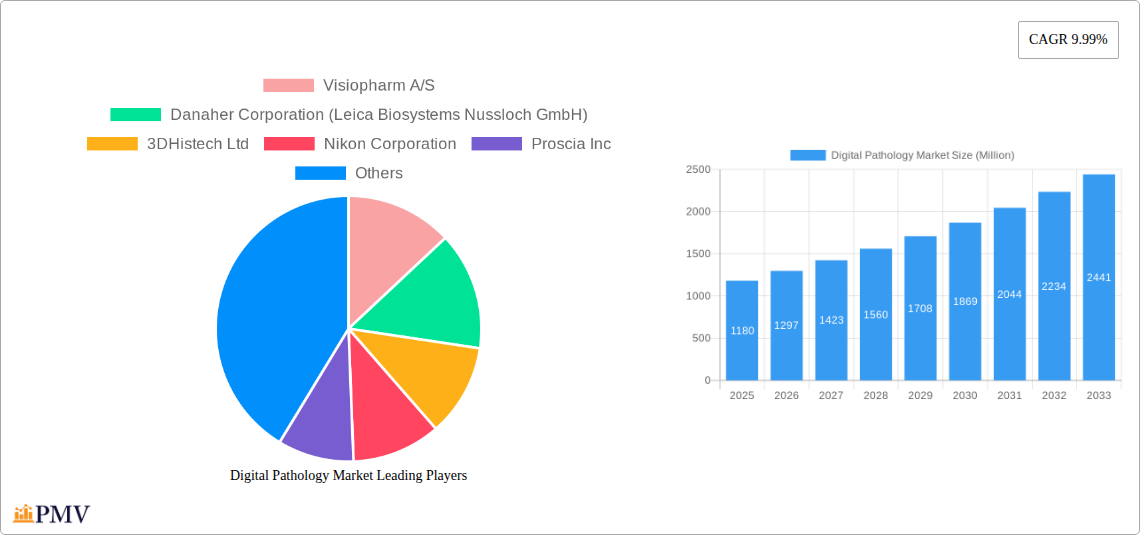
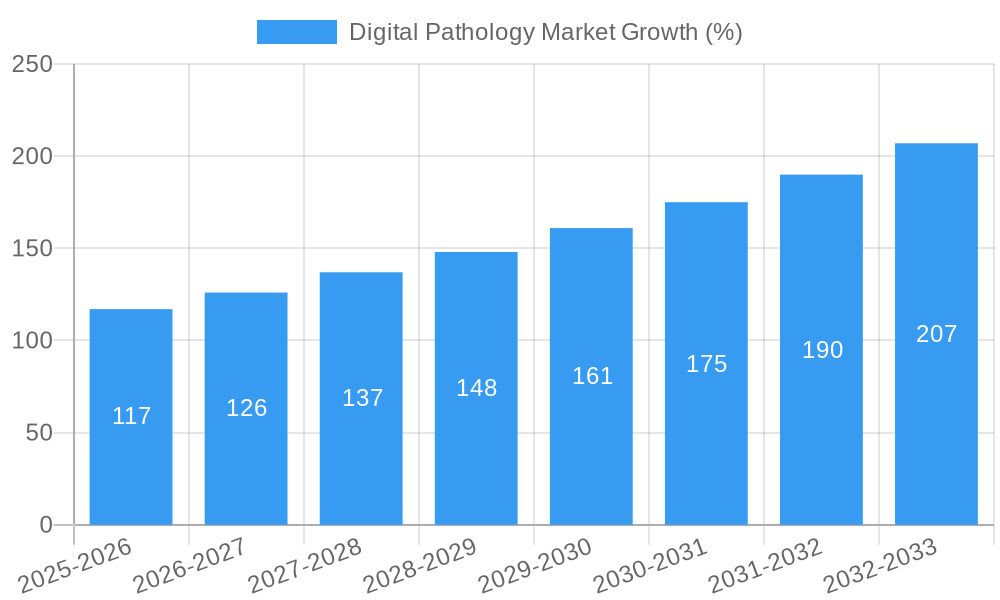
The global digital pathology market is experiencing robust growth, projected to reach \$1.18 billion in 2025 and expand significantly over the forecast period (2025-2033). A compound annual growth rate (CAGR) of 9.99% reflects the increasing adoption of digital pathology solutions across various segments. Key drivers include the rising demand for improved diagnostic accuracy, enhanced efficiency in laboratory workflows, and the need for remote access to pathology slides for consultations and education. The pharmaceutical and biotechnology sectors are major contributors, leveraging digital pathology for drug discovery and development. Hospitals and reference laboratories are increasingly adopting these technologies to streamline their operations and improve patient care. Growth is further fueled by technological advancements in scanner resolution, improved image analysis software, robust storage systems, and the development of AI-powered diagnostic tools. Market segmentation reveals a strong presence of scanners, software, and storage systems, with disease diagnosis and drug discovery as leading application areas.
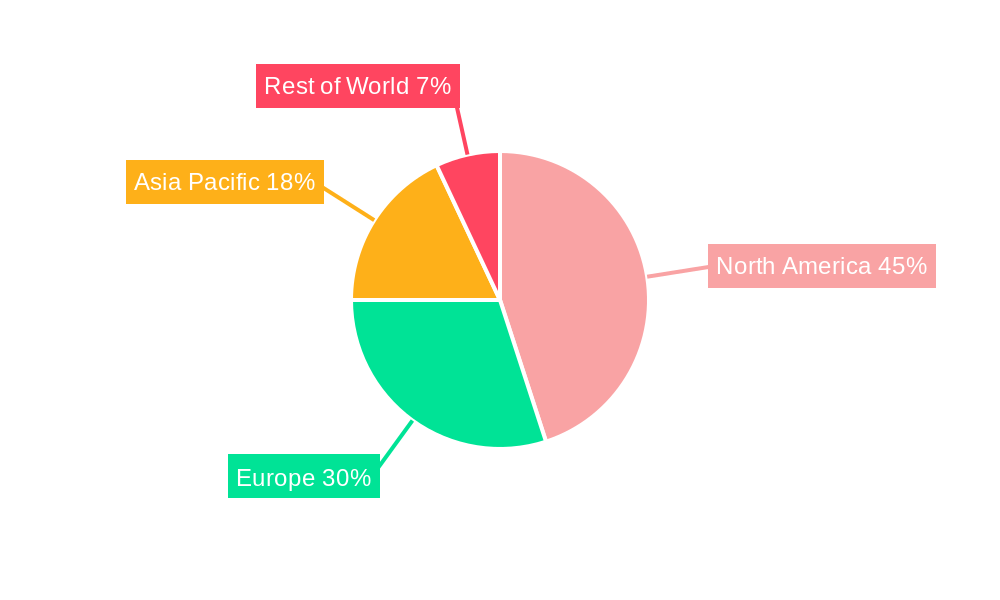
Despite the significant growth potential, certain restraints exist. These include the high initial investment costs associated with implementing digital pathology systems, the need for substantial training and expertise to effectively utilize the technology, and concerns about data security and interoperability. However, ongoing technological innovation, decreasing hardware costs, and the increasing availability of cloud-based solutions are mitigating these challenges. The market is characterized by a competitive landscape with both established players like Danaher Corporation and Leica Biosystems, and emerging innovative companies offering specialized solutions. Geographic expansion is expected to be significant, with North America currently dominating the market, followed by Europe and the Asia-Pacific region, which are expected to experience accelerated growth fueled by rising healthcare expenditure and infrastructure development. The continued expansion of telepathology and the growing integration of artificial intelligence will further shape the market's trajectory in the coming years.
Digital Pathology Market: A Comprehensive Report (2019-2033)
This comprehensive report provides a detailed analysis of the Digital Pathology Market, encompassing market size, growth drivers, competitive landscape, and future outlook. The study period covers 2019-2033, with a base year of 2025 and a forecast period of 2025-2033. This report is crucial for stakeholders seeking actionable insights into this rapidly evolving market, valued at xx Million in 2025 and projected to reach xx Million by 2033, exhibiting a CAGR of xx%.
Digital Pathology Market Market Structure & Competitive Dynamics
The digital pathology market is characterized by a moderately concentrated landscape with several key players vying for market share. Market concentration is influenced by factors such as technological advancements, regulatory approvals, and strategic partnerships. The market exhibits a dynamic innovation ecosystem, with companies constantly developing new scanners, software, and storage systems. Regulatory frameworks, particularly those related to medical device approvals and data privacy, significantly impact market growth. Product substitutes, such as traditional microscopy, pose a competitive challenge, although the advantages of digital pathology in terms of efficiency, collaboration, and data analysis are driving market adoption. End-user trends, particularly the increasing adoption of digital pathology in hospitals and reference laboratories, are a key growth driver. Mergers and acquisitions (M&A) activity is moderate, with deals focusing on expanding product portfolios and geographical reach. For instance, the M&A deal value in 2024 was estimated at xx Million. Key players such as Danaher Corporation (Leica Biosystems Nussloch GmbH) and F Hoffmann-La Roche Ltd (Ventana Medical Systems Inc) hold significant market share, estimated to be xx% and xx%, respectively, in 2025. Other companies with notable market presence include: Visiopharm A/S, 3DHistech Ltd, Nikon Corporation, Proscia Inc, XIFIN Inc, Leica Biosystems, Koninklijke Philips NV, Hamamatsu Photonics K K, Mikroscan Technologies Inc, Olympus Corporation, and Sectra AG. The competitive landscape is expected to become even more intense with new entrants and technological innovations in the coming years.
Digital Pathology Market Industry Trends & Insights
The digital pathology market is experiencing significant growth, driven by several key factors. Technological advancements, such as the development of higher-resolution scanners and more sophisticated image analysis software, are enhancing the capabilities of digital pathology systems. The rising prevalence of chronic diseases, coupled with the increasing demand for accurate and timely diagnosis, is fueling the adoption of digital pathology. Consumer preferences are shifting towards faster turnaround times and improved diagnostic accuracy, further boosting market growth. The market is also witnessing increased collaboration between technology providers and healthcare institutions, leading to the development of tailored solutions that meet specific clinical needs. The market's competitive dynamics are shaped by ongoing innovation, strategic partnerships, and regulatory changes. The market penetration rate is growing steadily, with xx% of pathology labs globally currently utilizing digital pathology systems in 2025, expected to reach xx% by 2033. This growth is fueled by the increasing adoption of digital pathology in various applications like disease diagnosis, drug discovery, and education and training, which are projected to account for xx%, xx%, and xx% of the market revenue respectively in 2025.
Dominant Markets & Segments in Digital Pathology Market
The North American region currently dominates the digital pathology market, driven by factors such as high healthcare expenditure, advanced technological infrastructure, and early adoption of innovative technologies. Within this region, the United States holds the largest market share. Other regions, including Europe and Asia-Pacific, are experiencing significant growth, although at a slower pace than North America.
- Key Drivers in North America: Strong regulatory support, well-funded research initiatives, and the presence of major market players.
- Key Drivers in Europe: Growing healthcare investments, increasing prevalence of chronic diseases, and government initiatives promoting digital healthcare.
- Key Drivers in Asia-Pacific: Rising healthcare expenditure, growing awareness of the benefits of digital pathology, and increasing investments in healthcare infrastructure.
Among the segments, the Hospital and Reference Laboratories end-user segment holds the largest market share, driven by the increasing adoption of digital pathology in large hospitals and diagnostic centers. The Scanner product segment is currently the most dominant, followed by Software, reflecting the importance of high-quality imaging and powerful analytical tools. The Disease Diagnosis application segment dominates the market, as digital pathology is increasingly utilized for improving the accuracy and efficiency of disease diagnosis.
Digital Pathology Market Product Innovations
Recent product developments in the digital pathology market focus on improving image quality, enhancing analytical capabilities, and integrating artificial intelligence (AI) for improved diagnostic accuracy. New scanners offer higher resolution and faster scanning speeds, while software solutions incorporate advanced algorithms for image analysis and data management. AI-powered tools are being integrated into digital pathology workflows to assist pathologists in identifying disease patterns and predicting patient outcomes. These innovations cater to the growing demand for faster, more accurate, and cost-effective diagnostic solutions, creating competitive advantages for companies that can deliver cutting-edge technologies.
Report Segmentation & Scope
This report segments the digital pathology market by End User (Pharmaceutical, Biotechnology, Companies and CROs, Hospital and Reference Laboratories, Other End Users), Product (Scanner, Software, Storage Systems, Other Products), and Application (Disease Diagnosis, Drug Discovery, Education and Training). Each segment is analyzed in detail, providing market size, growth projections, and competitive dynamics. The Hospital and Reference Laboratories segment is projected to witness the highest CAGR over the forecast period driven by the increasing adoption of digital pathology systems in hospitals and diagnostic centers globally. The software segment is anticipated to experience significant growth due to the increasing demand for advanced image analysis and data management tools. The Disease Diagnosis application segment is expected to maintain its dominance throughout the forecast period due to the growing need for accurate and efficient disease diagnosis.
Key Drivers of Digital Pathology Market Growth
The digital pathology market's growth is propelled by several factors: the increasing prevalence of chronic diseases demanding faster and more accurate diagnoses, technological advancements leading to improved image quality and analytical capabilities, rising adoption of telehealth and remote diagnostics, and the growing need for efficient data management and collaboration among healthcare professionals. Government initiatives and funding for healthcare infrastructure development also contribute significantly. Regulatory approvals for novel digital pathology devices and software further stimulate market expansion.
Challenges in the Digital Pathology Market Sector
The digital pathology market faces challenges including the high initial investment costs for equipment and software, the need for specialized training for pathologists and technicians, concerns around data security and privacy, and the integration of digital pathology systems into existing workflows. Regulatory hurdles in different countries can also pose challenges, along with the potential for technical glitches and the need for robust technical support. These factors can impact market growth, particularly in emerging markets.
Leading Players in the Digital Pathology Market Market
- Visiopharm A/S
- Danaher Corporation (Leica Biosystems Nussloch GmbH)
- 3DHistech Ltd
- Nikon Corporation
- Proscia Inc
- F Hoffmann-La Roche Ltd (Ventana Medical Systems Inc)
- XIFIN Inc
- Leica Biosystems
- Koninklijke Philips NV
- Hamamatsu Photonics K K
- Mikroscan Technologies Inc
- Olympus Corporation
- Sectra AG
Key Developments in Digital Pathology Market Sector
- June 2022: SpIntellx, Inc. and Inspirata collaborated to integrate SpIntellx HistoMapr-Breast and Inspirata's Dynamyx software, creating a seamless solution for breast cancer diagnosis using explainable AI (xAI). This integration significantly enhances diagnostic capabilities and efficiency.
- June 2022: Roche launched and received CE-IVD marking for its next-generation Ventana DP 600 slide scanner, improving scanning speed and image quality, thereby enhancing the overall efficiency of digital pathology workflows.
Strategic Digital Pathology Market Market Outlook
The digital pathology market holds significant growth potential driven by continuous technological advancements, increasing adoption in emerging markets, and the growing need for efficient and accurate disease diagnosis. Strategic opportunities exist for companies focusing on developing AI-powered diagnostic tools, cloud-based image storage and analysis solutions, and tailored software for specific clinical applications. Partnerships between technology providers and healthcare institutions will be crucial for successful market penetration. The market is poised for significant expansion, driven by increasing demand for improved healthcare efficiency and better patient outcomes.
Digital Pathology Market Segmentation
-
1. Product
- 1.1. Scanner
- 1.2. Software
- 1.3. Storage Systems
- 1.4. Other Products
-
2. Application
- 2.1. Disease Diagnosis
- 2.2. Drug Discovery
- 2.3. Education and Training
-
3. End User
- 3.1. Pharmaceutical, Biotechnology, Companies and CROs
- 3.2. Hospital and Reference Laboratories
- 3.3. Other End Users
Digital Pathology Market Segmentation By Geography
-
1. North America
- 1.1. United States
- 1.2. Canada
- 1.3. Mexico
-
2. Europe
- 2.1. Germany
- 2.2. United Kingdom
- 2.3. France
- 2.4. Italy
- 2.5. Spain
- 2.6. Rest of Europe
-
3. Asia Pacific
- 3.1. China
- 3.2. Japan
- 3.3. India
- 3.4. Australia
- 3.5. South Korea
- 3.6. Rest of Asia Pacific
-
4. Middle East and Africa
- 4.1. GCC
- 4.2. South Africa
- 4.3. Rest of Middle East and Africa
-
5. South America
- 5.1. Brazil
- 5.2. Argentina
- 5.3. Rest of South America
Digital Pathology Market REPORT HIGHLIGHTS
| Aspects | Details |
|---|---|
| Study Period | 2019-2033 |
| Base Year | 2024 |
| Estimated Year | 2025 |
| Forecast Period | 2025-2033 |
| Historical Period | 2019-2024 |
| Growth Rate | CAGR of 9.99% from 2019-2033 |
| Segmentation |
|
Table of Contents
- 1. Introduction
- 1.1. Research Scope
- 1.2. Market Segmentation
- 1.3. Research Methodology
- 1.4. Definitions and Assumptions
- 2. Executive Summary
- 2.1. Introduction
- 3. Market Dynamics
- 3.1. Introduction
- 3.2. Market Drivers
- 3.2.1. Growing Number of Tele-consultations; Rising Adoption of Digital Pathology to Enhance Lab Efficiency; Increasing Application in Drug Discovery and Companion Diagnostics
- 3.3. Market Restrains
- 3.3.1. Stringent Regulatory Concerns for Primary Diagnosis; Lack of Standard Guidelines for Digital Pathology
- 3.4. Market Trends
- 3.4.1. Disease Diagnosis Segment is Expected to Hold Significant Share Over the Forecast Period
- 4. Market Factor Analysis
- 4.1. Porters Five Forces
- 4.2. Supply/Value Chain
- 4.3. PESTEL analysis
- 4.4. Market Entropy
- 4.5. Patent/Trademark Analysis
- 5. Global Digital Pathology Market Analysis, Insights and Forecast, 2019-2031
- 5.1. Market Analysis, Insights and Forecast - by Product
- 5.1.1. Scanner
- 5.1.2. Software
- 5.1.3. Storage Systems
- 5.1.4. Other Products
- 5.2. Market Analysis, Insights and Forecast - by Application
- 5.2.1. Disease Diagnosis
- 5.2.2. Drug Discovery
- 5.2.3. Education and Training
- 5.3. Market Analysis, Insights and Forecast - by End User
- 5.3.1. Pharmaceutical, Biotechnology, Companies and CROs
- 5.3.2. Hospital and Reference Laboratories
- 5.3.3. Other End Users
- 5.4. Market Analysis, Insights and Forecast - by Region
- 5.4.1. North America
- 5.4.2. Europe
- 5.4.3. Asia Pacific
- 5.4.4. Middle East and Africa
- 5.4.5. South America
- 5.1. Market Analysis, Insights and Forecast - by Product
- 6. North America Digital Pathology Market Analysis, Insights and Forecast, 2019-2031
- 6.1. Market Analysis, Insights and Forecast - by Product
- 6.1.1. Scanner
- 6.1.2. Software
- 6.1.3. Storage Systems
- 6.1.4. Other Products
- 6.2. Market Analysis, Insights and Forecast - by Application
- 6.2.1. Disease Diagnosis
- 6.2.2. Drug Discovery
- 6.2.3. Education and Training
- 6.3. Market Analysis, Insights and Forecast - by End User
- 6.3.1. Pharmaceutical, Biotechnology, Companies and CROs
- 6.3.2. Hospital and Reference Laboratories
- 6.3.3. Other End Users
- 6.1. Market Analysis, Insights and Forecast - by Product
- 7. Europe Digital Pathology Market Analysis, Insights and Forecast, 2019-2031
- 7.1. Market Analysis, Insights and Forecast - by Product
- 7.1.1. Scanner
- 7.1.2. Software
- 7.1.3. Storage Systems
- 7.1.4. Other Products
- 7.2. Market Analysis, Insights and Forecast - by Application
- 7.2.1. Disease Diagnosis
- 7.2.2. Drug Discovery
- 7.2.3. Education and Training
- 7.3. Market Analysis, Insights and Forecast - by End User
- 7.3.1. Pharmaceutical, Biotechnology, Companies and CROs
- 7.3.2. Hospital and Reference Laboratories
- 7.3.3. Other End Users
- 7.1. Market Analysis, Insights and Forecast - by Product
- 8. Asia Pacific Digital Pathology Market Analysis, Insights and Forecast, 2019-2031
- 8.1. Market Analysis, Insights and Forecast - by Product
- 8.1.1. Scanner
- 8.1.2. Software
- 8.1.3. Storage Systems
- 8.1.4. Other Products
- 8.2. Market Analysis, Insights and Forecast - by Application
- 8.2.1. Disease Diagnosis
- 8.2.2. Drug Discovery
- 8.2.3. Education and Training
- 8.3. Market Analysis, Insights and Forecast - by End User
- 8.3.1. Pharmaceutical, Biotechnology, Companies and CROs
- 8.3.2. Hospital and Reference Laboratories
- 8.3.3. Other End Users
- 8.1. Market Analysis, Insights and Forecast - by Product
- 9. Middle East and Africa Digital Pathology Market Analysis, Insights and Forecast, 2019-2031
- 9.1. Market Analysis, Insights and Forecast - by Product
- 9.1.1. Scanner
- 9.1.2. Software
- 9.1.3. Storage Systems
- 9.1.4. Other Products
- 9.2. Market Analysis, Insights and Forecast - by Application
- 9.2.1. Disease Diagnosis
- 9.2.2. Drug Discovery
- 9.2.3. Education and Training
- 9.3. Market Analysis, Insights and Forecast - by End User
- 9.3.1. Pharmaceutical, Biotechnology, Companies and CROs
- 9.3.2. Hospital and Reference Laboratories
- 9.3.3. Other End Users
- 9.1. Market Analysis, Insights and Forecast - by Product
- 10. South America Digital Pathology Market Analysis, Insights and Forecast, 2019-2031
- 10.1. Market Analysis, Insights and Forecast - by Product
- 10.1.1. Scanner
- 10.1.2. Software
- 10.1.3. Storage Systems
- 10.1.4. Other Products
- 10.2. Market Analysis, Insights and Forecast - by Application
- 10.2.1. Disease Diagnosis
- 10.2.2. Drug Discovery
- 10.2.3. Education and Training
- 10.3. Market Analysis, Insights and Forecast - by End User
- 10.3.1. Pharmaceutical, Biotechnology, Companies and CROs
- 10.3.2. Hospital and Reference Laboratories
- 10.3.3. Other End Users
- 10.1. Market Analysis, Insights and Forecast - by Product
- 11. North Americ Digital Pathology Market Analysis, Insights and Forecast, 2019-2031
- 11.1. Market Analysis, Insights and Forecast - By Country/Sub-region
- 11.1.1 United States
- 11.1.2 Canada
- 11.1.3 Mexico
- 12. South America Digital Pathology Market Analysis, Insights and Forecast, 2019-2031
- 12.1. Market Analysis, Insights and Forecast - By Country/Sub-region
- 12.1.1 Brazil
- 12.1.2 Mexico
- 12.1.3 Rest of South America
- 13. Europe Digital Pathology Market Analysis, Insights and Forecast, 2019-2031
- 13.1. Market Analysis, Insights and Forecast - By Country/Sub-region
- 13.1.1 Germany
- 13.1.2 United Kingdom
- 13.1.3 France
- 13.1.4 Italy
- 13.1.5 Spain
- 13.1.6 Rest of Europe
- 14. Asia Pacific Digital Pathology Market Analysis, Insights and Forecast, 2019-2031
- 14.1. Market Analysis, Insights and Forecast - By Country/Sub-region
- 14.1.1 China
- 14.1.2 Japan
- 14.1.3 India
- 14.1.4 South Korea
- 14.1.5 Taiwan
- 14.1.6 Australia
- 14.1.7 Rest of Asia-Pacific
- 15. MEA Digital Pathology Market Analysis, Insights and Forecast, 2019-2031
- 15.1. Market Analysis, Insights and Forecast - By Country/Sub-region
- 15.1.1 Middle East
- 15.1.2 Africa
- 16. Competitive Analysis
- 16.1. Global Market Share Analysis 2024
- 16.2. Company Profiles
- 16.2.1 Visiopharm A/S
- 16.2.1.1. Overview
- 16.2.1.2. Products
- 16.2.1.3. SWOT Analysis
- 16.2.1.4. Recent Developments
- 16.2.1.5. Financials (Based on Availability)
- 16.2.2 Danaher Corporation (Leica Biosystems Nussloch GmbH)
- 16.2.2.1. Overview
- 16.2.2.2. Products
- 16.2.2.3. SWOT Analysis
- 16.2.2.4. Recent Developments
- 16.2.2.5. Financials (Based on Availability)
- 16.2.3 3DHistech Ltd
- 16.2.3.1. Overview
- 16.2.3.2. Products
- 16.2.3.3. SWOT Analysis
- 16.2.3.4. Recent Developments
- 16.2.3.5. Financials (Based on Availability)
- 16.2.4 Nikon Corporation
- 16.2.4.1. Overview
- 16.2.4.2. Products
- 16.2.4.3. SWOT Analysis
- 16.2.4.4. Recent Developments
- 16.2.4.5. Financials (Based on Availability)
- 16.2.5 Proscia Inc
- 16.2.5.1. Overview
- 16.2.5.2. Products
- 16.2.5.3. SWOT Analysis
- 16.2.5.4. Recent Developments
- 16.2.5.5. Financials (Based on Availability)
- 16.2.6 F Hoffmann-La Roche Ltd (Ventana Medical Systems Inc )
- 16.2.6.1. Overview
- 16.2.6.2. Products
- 16.2.6.3. SWOT Analysis
- 16.2.6.4. Recent Developments
- 16.2.6.5. Financials (Based on Availability)
- 16.2.7 XIFIN Inc
- 16.2.7.1. Overview
- 16.2.7.2. Products
- 16.2.7.3. SWOT Analysis
- 16.2.7.4. Recent Developments
- 16.2.7.5. Financials (Based on Availability)
- 16.2.8 Leica Biosystems
- 16.2.8.1. Overview
- 16.2.8.2. Products
- 16.2.8.3. SWOT Analysis
- 16.2.8.4. Recent Developments
- 16.2.8.5. Financials (Based on Availability)
- 16.2.9 Koninklijke Philips NV
- 16.2.9.1. Overview
- 16.2.9.2. Products
- 16.2.9.3. SWOT Analysis
- 16.2.9.4. Recent Developments
- 16.2.9.5. Financials (Based on Availability)
- 16.2.10 Hamamatsu Photonics K K
- 16.2.10.1. Overview
- 16.2.10.2. Products
- 16.2.10.3. SWOT Analysis
- 16.2.10.4. Recent Developments
- 16.2.10.5. Financials (Based on Availability)
- 16.2.11 Mikroscan Technologies Inc
- 16.2.11.1. Overview
- 16.2.11.2. Products
- 16.2.11.3. SWOT Analysis
- 16.2.11.4. Recent Developments
- 16.2.11.5. Financials (Based on Availability)
- 16.2.12 Olympus Corporation
- 16.2.12.1. Overview
- 16.2.12.2. Products
- 16.2.12.3. SWOT Analysis
- 16.2.12.4. Recent Developments
- 16.2.12.5. Financials (Based on Availability)
- 16.2.13 Sectra AG
- 16.2.13.1. Overview
- 16.2.13.2. Products
- 16.2.13.3. SWOT Analysis
- 16.2.13.4. Recent Developments
- 16.2.13.5. Financials (Based on Availability)
- 16.2.1 Visiopharm A/S
List of Figures
- Figure 1: Global Digital Pathology Market Revenue Breakdown (Million, %) by Region 2024 & 2032
- Figure 2: North Americ Digital Pathology Market Revenue (Million), by Country 2024 & 2032
- Figure 3: North Americ Digital Pathology Market Revenue Share (%), by Country 2024 & 2032
- Figure 4: South America Digital Pathology Market Revenue (Million), by Country 2024 & 2032
- Figure 5: South America Digital Pathology Market Revenue Share (%), by Country 2024 & 2032
- Figure 6: Europe Digital Pathology Market Revenue (Million), by Country 2024 & 2032
- Figure 7: Europe Digital Pathology Market Revenue Share (%), by Country 2024 & 2032
- Figure 8: Asia Pacific Digital Pathology Market Revenue (Million), by Country 2024 & 2032
- Figure 9: Asia Pacific Digital Pathology Market Revenue Share (%), by Country 2024 & 2032
- Figure 10: MEA Digital Pathology Market Revenue (Million), by Country 2024 & 2032
- Figure 11: MEA Digital Pathology Market Revenue Share (%), by Country 2024 & 2032
- Figure 12: North America Digital Pathology Market Revenue (Million), by Product 2024 & 2032
- Figure 13: North America Digital Pathology Market Revenue Share (%), by Product 2024 & 2032
- Figure 14: North America Digital Pathology Market Revenue (Million), by Application 2024 & 2032
- Figure 15: North America Digital Pathology Market Revenue Share (%), by Application 2024 & 2032
- Figure 16: North America Digital Pathology Market Revenue (Million), by End User 2024 & 2032
- Figure 17: North America Digital Pathology Market Revenue Share (%), by End User 2024 & 2032
- Figure 18: North America Digital Pathology Market Revenue (Million), by Country 2024 & 2032
- Figure 19: North America Digital Pathology Market Revenue Share (%), by Country 2024 & 2032
- Figure 20: Europe Digital Pathology Market Revenue (Million), by Product 2024 & 2032
- Figure 21: Europe Digital Pathology Market Revenue Share (%), by Product 2024 & 2032
- Figure 22: Europe Digital Pathology Market Revenue (Million), by Application 2024 & 2032
- Figure 23: Europe Digital Pathology Market Revenue Share (%), by Application 2024 & 2032
- Figure 24: Europe Digital Pathology Market Revenue (Million), by End User 2024 & 2032
- Figure 25: Europe Digital Pathology Market Revenue Share (%), by End User 2024 & 2032
- Figure 26: Europe Digital Pathology Market Revenue (Million), by Country 2024 & 2032
- Figure 27: Europe Digital Pathology Market Revenue Share (%), by Country 2024 & 2032
- Figure 28: Asia Pacific Digital Pathology Market Revenue (Million), by Product 2024 & 2032
- Figure 29: Asia Pacific Digital Pathology Market Revenue Share (%), by Product 2024 & 2032
- Figure 30: Asia Pacific Digital Pathology Market Revenue (Million), by Application 2024 & 2032
- Figure 31: Asia Pacific Digital Pathology Market Revenue Share (%), by Application 2024 & 2032
- Figure 32: Asia Pacific Digital Pathology Market Revenue (Million), by End User 2024 & 2032
- Figure 33: Asia Pacific Digital Pathology Market Revenue Share (%), by End User 2024 & 2032
- Figure 34: Asia Pacific Digital Pathology Market Revenue (Million), by Country 2024 & 2032
- Figure 35: Asia Pacific Digital Pathology Market Revenue Share (%), by Country 2024 & 2032
- Figure 36: Middle East and Africa Digital Pathology Market Revenue (Million), by Product 2024 & 2032
- Figure 37: Middle East and Africa Digital Pathology Market Revenue Share (%), by Product 2024 & 2032
- Figure 38: Middle East and Africa Digital Pathology Market Revenue (Million), by Application 2024 & 2032
- Figure 39: Middle East and Africa Digital Pathology Market Revenue Share (%), by Application 2024 & 2032
- Figure 40: Middle East and Africa Digital Pathology Market Revenue (Million), by End User 2024 & 2032
- Figure 41: Middle East and Africa Digital Pathology Market Revenue Share (%), by End User 2024 & 2032
- Figure 42: Middle East and Africa Digital Pathology Market Revenue (Million), by Country 2024 & 2032
- Figure 43: Middle East and Africa Digital Pathology Market Revenue Share (%), by Country 2024 & 2032
- Figure 44: South America Digital Pathology Market Revenue (Million), by Product 2024 & 2032
- Figure 45: South America Digital Pathology Market Revenue Share (%), by Product 2024 & 2032
- Figure 46: South America Digital Pathology Market Revenue (Million), by Application 2024 & 2032
- Figure 47: South America Digital Pathology Market Revenue Share (%), by Application 2024 & 2032
- Figure 48: South America Digital Pathology Market Revenue (Million), by End User 2024 & 2032
- Figure 49: South America Digital Pathology Market Revenue Share (%), by End User 2024 & 2032
- Figure 50: South America Digital Pathology Market Revenue (Million), by Country 2024 & 2032
- Figure 51: South America Digital Pathology Market Revenue Share (%), by Country 2024 & 2032
List of Tables
- Table 1: Global Digital Pathology Market Revenue Million Forecast, by Region 2019 & 2032
- Table 2: Global Digital Pathology Market Revenue Million Forecast, by Product 2019 & 2032
- Table 3: Global Digital Pathology Market Revenue Million Forecast, by Application 2019 & 2032
- Table 4: Global Digital Pathology Market Revenue Million Forecast, by End User 2019 & 2032
- Table 5: Global Digital Pathology Market Revenue Million Forecast, by Region 2019 & 2032
- Table 6: Global Digital Pathology Market Revenue Million Forecast, by Country 2019 & 2032
- Table 7: United States Digital Pathology Market Revenue (Million) Forecast, by Application 2019 & 2032
- Table 8: Canada Digital Pathology Market Revenue (Million) Forecast, by Application 2019 & 2032
- Table 9: Mexico Digital Pathology Market Revenue (Million) Forecast, by Application 2019 & 2032
- Table 10: Global Digital Pathology Market Revenue Million Forecast, by Country 2019 & 2032
- Table 11: Brazil Digital Pathology Market Revenue (Million) Forecast, by Application 2019 & 2032
- Table 12: Mexico Digital Pathology Market Revenue (Million) Forecast, by Application 2019 & 2032
- Table 13: Rest of South America Digital Pathology Market Revenue (Million) Forecast, by Application 2019 & 2032
- Table 14: Global Digital Pathology Market Revenue Million Forecast, by Country 2019 & 2032
- Table 15: Germany Digital Pathology Market Revenue (Million) Forecast, by Application 2019 & 2032
- Table 16: United Kingdom Digital Pathology Market Revenue (Million) Forecast, by Application 2019 & 2032
- Table 17: France Digital Pathology Market Revenue (Million) Forecast, by Application 2019 & 2032
- Table 18: Italy Digital Pathology Market Revenue (Million) Forecast, by Application 2019 & 2032
- Table 19: Spain Digital Pathology Market Revenue (Million) Forecast, by Application 2019 & 2032
- Table 20: Rest of Europe Digital Pathology Market Revenue (Million) Forecast, by Application 2019 & 2032
- Table 21: Global Digital Pathology Market Revenue Million Forecast, by Country 2019 & 2032
- Table 22: China Digital Pathology Market Revenue (Million) Forecast, by Application 2019 & 2032
- Table 23: Japan Digital Pathology Market Revenue (Million) Forecast, by Application 2019 & 2032
- Table 24: India Digital Pathology Market Revenue (Million) Forecast, by Application 2019 & 2032
- Table 25: South Korea Digital Pathology Market Revenue (Million) Forecast, by Application 2019 & 2032
- Table 26: Taiwan Digital Pathology Market Revenue (Million) Forecast, by Application 2019 & 2032
- Table 27: Australia Digital Pathology Market Revenue (Million) Forecast, by Application 2019 & 2032
- Table 28: Rest of Asia-Pacific Digital Pathology Market Revenue (Million) Forecast, by Application 2019 & 2032
- Table 29: Global Digital Pathology Market Revenue Million Forecast, by Country 2019 & 2032
- Table 30: Middle East Digital Pathology Market Revenue (Million) Forecast, by Application 2019 & 2032
- Table 31: Africa Digital Pathology Market Revenue (Million) Forecast, by Application 2019 & 2032
- Table 32: Global Digital Pathology Market Revenue Million Forecast, by Product 2019 & 2032
- Table 33: Global Digital Pathology Market Revenue Million Forecast, by Application 2019 & 2032
- Table 34: Global Digital Pathology Market Revenue Million Forecast, by End User 2019 & 2032
- Table 35: Global Digital Pathology Market Revenue Million Forecast, by Country 2019 & 2032
- Table 36: United States Digital Pathology Market Revenue (Million) Forecast, by Application 2019 & 2032
- Table 37: Canada Digital Pathology Market Revenue (Million) Forecast, by Application 2019 & 2032
- Table 38: Mexico Digital Pathology Market Revenue (Million) Forecast, by Application 2019 & 2032
- Table 39: Global Digital Pathology Market Revenue Million Forecast, by Product 2019 & 2032
- Table 40: Global Digital Pathology Market Revenue Million Forecast, by Application 2019 & 2032
- Table 41: Global Digital Pathology Market Revenue Million Forecast, by End User 2019 & 2032
- Table 42: Global Digital Pathology Market Revenue Million Forecast, by Country 2019 & 2032
- Table 43: Germany Digital Pathology Market Revenue (Million) Forecast, by Application 2019 & 2032
- Table 44: United Kingdom Digital Pathology Market Revenue (Million) Forecast, by Application 2019 & 2032
- Table 45: France Digital Pathology Market Revenue (Million) Forecast, by Application 2019 & 2032
- Table 46: Italy Digital Pathology Market Revenue (Million) Forecast, by Application 2019 & 2032
- Table 47: Spain Digital Pathology Market Revenue (Million) Forecast, by Application 2019 & 2032
- Table 48: Rest of Europe Digital Pathology Market Revenue (Million) Forecast, by Application 2019 & 2032
- Table 49: Global Digital Pathology Market Revenue Million Forecast, by Product 2019 & 2032
- Table 50: Global Digital Pathology Market Revenue Million Forecast, by Application 2019 & 2032
- Table 51: Global Digital Pathology Market Revenue Million Forecast, by End User 2019 & 2032
- Table 52: Global Digital Pathology Market Revenue Million Forecast, by Country 2019 & 2032
- Table 53: China Digital Pathology Market Revenue (Million) Forecast, by Application 2019 & 2032
- Table 54: Japan Digital Pathology Market Revenue (Million) Forecast, by Application 2019 & 2032
- Table 55: India Digital Pathology Market Revenue (Million) Forecast, by Application 2019 & 2032
- Table 56: Australia Digital Pathology Market Revenue (Million) Forecast, by Application 2019 & 2032
- Table 57: South Korea Digital Pathology Market Revenue (Million) Forecast, by Application 2019 & 2032
- Table 58: Rest of Asia Pacific Digital Pathology Market Revenue (Million) Forecast, by Application 2019 & 2032
- Table 59: Global Digital Pathology Market Revenue Million Forecast, by Product 2019 & 2032
- Table 60: Global Digital Pathology Market Revenue Million Forecast, by Application 2019 & 2032
- Table 61: Global Digital Pathology Market Revenue Million Forecast, by End User 2019 & 2032
- Table 62: Global Digital Pathology Market Revenue Million Forecast, by Country 2019 & 2032
- Table 63: GCC Digital Pathology Market Revenue (Million) Forecast, by Application 2019 & 2032
- Table 64: South Africa Digital Pathology Market Revenue (Million) Forecast, by Application 2019 & 2032
- Table 65: Rest of Middle East and Africa Digital Pathology Market Revenue (Million) Forecast, by Application 2019 & 2032
- Table 66: Global Digital Pathology Market Revenue Million Forecast, by Product 2019 & 2032
- Table 67: Global Digital Pathology Market Revenue Million Forecast, by Application 2019 & 2032
- Table 68: Global Digital Pathology Market Revenue Million Forecast, by End User 2019 & 2032
- Table 69: Global Digital Pathology Market Revenue Million Forecast, by Country 2019 & 2032
- Table 70: Brazil Digital Pathology Market Revenue (Million) Forecast, by Application 2019 & 2032
- Table 71: Argentina Digital Pathology Market Revenue (Million) Forecast, by Application 2019 & 2032
- Table 72: Rest of South America Digital Pathology Market Revenue (Million) Forecast, by Application 2019 & 2032
Frequently Asked Questions
1. What is the projected Compound Annual Growth Rate (CAGR) of the Digital Pathology Market?
The projected CAGR is approximately 9.99%.
2. Which companies are prominent players in the Digital Pathology Market?
Key companies in the market include Visiopharm A/S, Danaher Corporation (Leica Biosystems Nussloch GmbH), 3DHistech Ltd, Nikon Corporation, Proscia Inc, F Hoffmann-La Roche Ltd (Ventana Medical Systems Inc ), XIFIN Inc, Leica Biosystems, Koninklijke Philips NV, Hamamatsu Photonics K K, Mikroscan Technologies Inc, Olympus Corporation, Sectra AG.
3. What are the main segments of the Digital Pathology Market?
The market segments include Product, Application, End User.
4. Can you provide details about the market size?
The market size is estimated to be USD 1.18 Million as of 2022.
5. What are some drivers contributing to market growth?
Growing Number of Tele-consultations; Rising Adoption of Digital Pathology to Enhance Lab Efficiency; Increasing Application in Drug Discovery and Companion Diagnostics.
6. What are the notable trends driving market growth?
Disease Diagnosis Segment is Expected to Hold Significant Share Over the Forecast Period.
7. Are there any restraints impacting market growth?
Stringent Regulatory Concerns for Primary Diagnosis; Lack of Standard Guidelines for Digital Pathology.
8. Can you provide examples of recent developments in the market?
June 2022: SpIntellx, Inc. and Inspirata have collaborated to integrate the SpIntellx HistoMapr-Breast platform and Inspirata's Dynamyx software into one seamless solution. HistoMapr-Breast is the one and only computational pathology software that taps the power of explainable artificial intelligence (xAI) for healthcare providers to diagnose, prognosticate and treat breast cancer more efficiently and accurately.
9. What pricing options are available for accessing the report?
Pricing options include single-user, multi-user, and enterprise licenses priced at USD 4750, USD 5250, and USD 8750 respectively.
10. Is the market size provided in terms of value or volume?
The market size is provided in terms of value, measured in Million.
11. Are there any specific market keywords associated with the report?
Yes, the market keyword associated with the report is "Digital Pathology Market," which aids in identifying and referencing the specific market segment covered.
12. How do I determine which pricing option suits my needs best?
The pricing options vary based on user requirements and access needs. Individual users may opt for single-user licenses, while businesses requiring broader access may choose multi-user or enterprise licenses for cost-effective access to the report.
13. Are there any additional resources or data provided in the Digital Pathology Market report?
While the report offers comprehensive insights, it's advisable to review the specific contents or supplementary materials provided to ascertain if additional resources or data are available.
14. How can I stay updated on further developments or reports in the Digital Pathology Market?
To stay informed about further developments, trends, and reports in the Digital Pathology Market, consider subscribing to industry newsletters, following relevant companies and organizations, or regularly checking reputable industry news sources and publications.
Methodology
Step 1 - Identification of Relevant Samples Size from Population Database


Step 2 - Approaches for Defining Global Market Size (Value, Volume* & Price*)

Note*: In applicable scenarios
Step 3 - Data Sources
Primary Research
- Web Analytics
- Survey Reports
- Research Institute
- Latest Research Reports
- Opinion Leaders
Secondary Research
- Annual Reports
- White Paper
- Latest Press Release
- Industry Association
- Paid Database
- Investor Presentations

Step 4 - Data Triangulation
Involves using different sources of information in order to increase the validity of a study
These sources are likely to be stakeholders in a program - participants, other researchers, program staff, other community members, and so on.
Then we put all data in single framework & apply various statistical tools to find out the dynamic on the market.
During the analysis stage, feedback from the stakeholder groups would be compared to determine areas of agreement as well as areas of divergence


